

Abstract
Genomewide studies and localized candidate gene approaches have become everyday study designs for identifying polymorphisms in genes that influence complex human traits. Yet, in general, the number of significant findings and the need to focus in smaller regions require a prioritization of genes for further study. Some candidate gene identification algorithms have been proposed in recent years to attempt to streamline this prioritization, but many suffer from limitations imposed by the source data or are difficult to use and understand. CANDID is a prioritization algorithm designed to produce impartial, accurate rankings of candidate genes that influence complex human traits. CANDID can use information from publications, protein domain descriptions, cross-species conservation measures, gene expression profiles, and protein-protein interactions in its analysis. Additionally, users may supplement these data sources with results from linkage, association and other studies. CANDID was tested on well-known complex trait genes using data from the Online Mendelian Inheritance in Man (OMIM) database. Additionally, CANDID was evaluated in a modeled gene discovery environment, where it ranked genes whose trait associations were published after CANDID’s databases were compiled. In all settings, CANDID exhibited high sensitivity and specificity, indicating an improvement upon previously published algorithms. Its accuracy and ease of use make CANDID a highly useful tool in study design and analysis for complex human traits.
Keywords: candidate genes, data fusion, gene prioritization, integrative genomics
Introduction
Investigators initiating a study of a complex human trait generally choose either a candidate gene or genomewide approach. In a candidate gene approach, genes are selected based on their putative functions and possible relevance to the trait. This approach is necessarily biased towards well-characterized genes, but if the right candidate gene(s) are selected, it may be the quickest and least expensive study design. Genomewide studies are more impartial, but the resulting statistical analyses are complicated by the large number of statistically significant or suggestive results. In many cases, investigators use a combination of genomewide and candidate gene approaches, using genomewide technologies to identify a subset of genes of interest and then conducting further analysis on the most promising candidates in this subset [Calvo, et al. 2006; Mootha, et al. 2003; Niculescu, et al. 2000; Schadt, et al. 2005]. As a result, both candidate gene and genomewide approaches often require a candidate gene selection and/or prioritization step. This step is highly susceptible to bias from a number of sources, including the extent and area of the individual scientist’s knowledge and the degree to which potential candidate genes have been characterized in the scientific literature and public databases.
Some candidate identification algorithms (CIAs) have been created to assist in automating candidate gene selection or prioritization. These algorithms make use of a wide array of publicly available and user-generated data, and as such, they are very diverse in their designs. While some of these algorithms may be very successful under certain circumstances as discussed below, broader use of these algorithms is generally limited by shortcomings in two main areas: data sources and overall usability. Many CIAs require specific data inputs, such as previously obtained biological data, which may not be available. For example, Prioritizer, TOM, SUSPECTS and POCUS require the user to supply at least one locus of interest [Adie, et al. 2006; Franke, et al. 2006; Perez-Iratxeta, et al. 2005; Rossi, et al. 2006; Turner, et al. 2003]. GeneSeeker requests that the user supply a locus of interest; if there are none, the algorithm must rely solely on publicly-available expression data [van Driel, et al. 2003]. Another CIA, GeneRank, is based on Google’s PageRank algorithm and requires the user to supply expression data, again necessitating previous biological studies [Morrison, et al. 2005]. Two recently reported CIAs, Endeavour and CGI, do not require biological data but instead require a training set of at least several known disease genes, which are then used to create a profile that is compared to potential candidates [Aerts, et al. 2006; Ma, et al. 2007]. Selection of the training set relies on previous biological characterization of the trait, meaning that only a subset of well-characterized traits can be studied with these CIAs.
The choice of datasets used to evaluate candidates can also limit the usefulness of CIAs. For example, Gene Ontology (GO) functional classifications of genes are heavily relied upon in many CIAs, including Endeavour, Prioritizer, TOM, SUSPECTS, POCUS, G2D, GeneRank, and GFSST [Adie, et al. 2006; Aerts, et al. 2006; Franke, et al. 2006; Morrison, et al. 2005; Perez-Iratxeta, et al. 2005; Rossi, et al. 2006; Turner, et al. 2003; Zhang, et al. 2006]. GO classification terms include a unique identification number and a brief description of the corresponding biological function using a controlled vocabulary, making them ideally suited to annotating large datasets [Ashburner, et al. 2000]. However, only 60% of all human genes have associated GO terms, and these terms may be inconsistent due to differences in curators’ judgment [Ashburner, et al. 2000; Dolan, et al. 2005]. Additionally, genes that already have GO annotations may still have additional unidentified functions. Similar limitations occur with the use of manually-annotated pathway classifications from the Kyoto Encyclopedia of Genes and Genomes (KEGG), implemented in Endeavour, Prioritizer and Gentrepid [Aerts, et al. 2006; Franke, et al. 2006; George, et al. 2006]. Depending on the CIA in question, these issues reduce or eliminate the probability that poorly characterized genes are selected as candidates.
The usability limitations of current CIAs are generally related to either the algorithm output or the ease of use. Some CIAs evaluate a certain number of genes and then supply the user with an unordered subset of these genes [George, et al. 2006; Rossi, et al. 2006; Turner, et al. 2003; van Driel, et al. 2003; Zhang, et al. 2006]. This subset can be prohibitively large, depending on the nature of the intended follow-up experiments. In this situation, the user would be forced to rely upon his own knowledge to pick candidates out of the subset, negating the purpose of using a CIA. A better output method provides a ranked list of all considered genes, allowing the user to interpret the results as he or she sees fit. This method is employed by many of the CIAs, including Prioritizer, SUSPECTS, G2D, GeneRank, Endeavour and CGI [Adie, et al. 2006; Aerts, et al. 2006; Franke, et al. 2006; Ma, et al. 2007; Morrison, et al. 2005; Perez-Iratxeta, et al. 2005]. The last weakness of some CIAs is low accessibility. An ideal CIA would be easy for all potential users to understand and easy to access, preferably through a web-based interface that does not require software installation [Troyanskaya 2005]. Of the eleven previously mentioned CIAs, only five (Endeavour, G2D, TOM, GeneSeeker and SUSPECTS) are available as purely web-based applications that are easily accessible to both biologists and statisticians.
CANDID is a highly effective genomewide candidate identification algorithm designed with complex human trait genetics in mind. A variety of data sources are used by CANDID, and most of these were selected to reduce bias against poorly characterized genes. Users also have the option of supplementing CANDID’s analyses by providing their own data sources, including results from linkage and association studies. Additionally, users can optionally use their own knowledge to fine-tune their analyses by specifying which data sources CANDID uses and the weights CANDID gives to each source. Finally, CANDID has a flexible web-based interface that is easily accessible to both biologists and statisticians.
Methods
CANDID scores genes by up to eight criteria: publications, protein domains, cross-species conservation, gene expression profile, protein-protein interactions, linkage analysis results, association analysis results, and custom data (Figure 1). Each gene receives criterion-specific scores, which are normalized and weighted by the user-defined criterion weight and then summed to form the gene’s final score. Genes are ranked by final score and presented as a list to the user along with detailed scoring information. While CANDID evaluates all human genes by default, users also have the option of limiting their analyses to only protein-coding genes.
Figure 1.

Depiction of CANDID’s information flow. Genes are evaluated by up to 8 criteria (Publications, Protein domains, Conservation, Expression, Interactions, Linkage, Association, and Custom). Scores from each criterion are normalized, weighted by the value specified by the user for that criterion, and combined to form final scores. CANDID output consists of a list of all evaluated genes, ranked by final score, as well as other associated information.
Publication data and scoring
CANDID’s publications scoring method differs from those of previously described CIAs. G2D, for example, links genes to traits through medical subject headings (MeSH) and GO terms [Perez-Iratxeta, et al. 2007; Perez-Iratxeta, et al. 2005]. CANDID’s publications database consists of direct links between PubMed IDs and EntrezGene IDs, where a gene-publication link is made when a publication describes evidence of the sequence or function of the human gene or its murine ortholog. The publications associated with gene X will be identified as the set G(X). The CANDID user provides a set of keywords associated with the trait of interest that would be appropriate for a typical literature search. As a general rule, keywords should be chosen based on whether publications about that keyword would be of interest to someone researching the trait. For example, if someone researching schizophrenia were interested in knowing about genes with known functions in the brain, he or she should include “brain” as a keyword. As a result, keywords may range from very trait-specific (“schizophrenia”) to very broad (“brain”). Traits may also differ greatly in the number of applicable keywords. It is to be expected that some traits will only have a few relevant keywords, and in these cases, adding more keywords that are only vaguely related to the trait would likely introduce more noise into the final rankings. Also, synonyms should be included when appropriate to encompass as many relevant publications as possible. For example, searching for “Alzheimer” and “Alzheimer’s” returns different results, so both variations should be used when applicable. The resulting set of keywords is used in a “text word” PubMed search to identify all matching publications (M). The publication score, P, for gene X is a value between 0 and 1 equal to
The rationale for this method is to reward genes that are commonly linked with publications describing the trait of interest independent of the degree to which these genes are characterized in the literature. After all genes are scored for this criterion, scores are normalized by dividing all publications scores by the highest overall publications score, eliminating a relative bias against traits with few matching publications.
Protein domain data and scoring
Protein domain information is obtained from the National Center for Biotechnology Information (NCBI) Conserved Domain Database (CDD), a curated database that integrates information from other databases, such as Pfam, SMART and COG. The CDD is similar to InterPro, another protein domain resource used by CIAs such as SUSPECTS [Adie, et al. 2006]. Domain entries may possess a description of the domain and links to genes whose protein products contain these domains. As with the publications criterion, the CANDID user provides a set of keywords relating to the trait of interest, which are used to search the protein domain descriptions. Any gene whose protein product(s) contain at least one of the matching domains receives a score of 1. All other genes receive a score of 0. This method serves to reward genes for their putative functions, and since domain prediction is generally sequence-based, it will have the potential to reward nearly all protein-coding genes for which domains have been identified, regardless of how extensively they have been characterized in the scientific literature.
Conservation data and scoring
CANDID’s method for assigning conservation scores is similar to that of other CIAs, including DGP [Lopez-Bigas and Ouzounis 2004]. NCBI’s HomoloGene database provides the information for CANDID’s conservation analysis. HomoloGene analyzes genes from 18 completely sequenced organisms and detects homologs using amino acid and DNA sequences. For each gene, one of nine labels is supplied that describes the phylogenetic similarity between humans and the organism harboring the most distant homolog. “Eutheria,” for example, is a common descriptor that refers to genes present only in eutherian mammals, such as humans and mice. Human-specific genes receive a score of 0, while genes with the label “Eukaryota” receive the maximum score of 1. Scores for the other seven labels are distributed evenly, ranging from 0.125 to 0.875 in increments of 0.125; genes with the label “Eutheria” receive a score of 0.375. A high score for this criterion may be relevant for phenotypes that are known to involve conserved cellular processes, such as cancer, while it may be irrelevant for phenotypes such as hair color that only affect a small subset of species. Scores for this criterion are normalized by dividing all genes’ conservation scores by the highest conservation score.
Expression data and scoring
The Genomics Institute of the Novartis Research Foundation (GNF) Gene Atlas comprises expression levels of 17,761 human genes in 79 human tissues [Su, et al. 2004]. CANDID stands in contrast to other CIAs, such as TOM, that compare expression patterns across genes [Rossi, et al. 2006]. Instead, CANDID compares each gene’s expression levels across the 79 measured tissues in the GeneAtlas. Each gene receives a score of 1 for the tissue(s) in which the gene is most highly expressed, and the gene’s scores for the remaining tissues correspond to the ratio of the expression level in that tissue to the gene’s maximum expression level. With this strategy, genes that are specifically expressed in a certain tissue receive a high score for that tissue and very low scores for all other tissues, while “housekeeping” genes with roughly equal expression levels in all tissues receive roughly the same scores across all tissues. This method serves to highlight genes in the tissues where they may be thought to play the most important roles. In order to use this criterion, CANDID users must enter at least one tissue code between 1 and 79 corresponding to the tissue(s) of interest. A gene’s expression score corresponds to the sum of its individual tissue scores for all of the user-specified tissues. Scores for this criterion are normalized by dividing all genes’ expression scores by the highest expression score.
Protein-protein interaction data and scoring
Protein-protein interactions can provide valuable information about a gene product’s function, even in the absence of other information. As such, they have been widely used in recent CIAs, including Prioritizer, Gentrepid, and the method published by Oti, et al [Franke, et al. 2006; George, et al. 2006; Oti, et al. 2006]. In the NCBI Gene database, published protein-protein interactions for each gene are compiled from sources such as BIND, HPRD and BioGRID. To determine a gene’s interactions score, CANDID sums the publications and protein domains scores for all of the gene’s interacting partners. Using this method, it is possible for a gene of unknown function to have scores of zero in all categories, but still be highly rated due to an interaction with a key, high-scoring protein, perhaps identified through a high-throughput screen. These scores are not normalized, and as such, scores for this criterion range from 0 to an undefined upper limit.
Linkage data and scoring
CANDID was specifically designed to accommodate one or more sets of existing linkage data. CANDID users with linkage information may wish to limit their CANDID gene analyses to one or more loci or to prioritize genes based on the gene’s approximate LOD score. CANDID readily accepts custom linkage files as well as linkage output files from GENEHUNTER, MERLIN, and SOLAR [Abecasis, et al. 2002; Almasy and Blangero 1998; Kruglyak, et al. 1996]. Multiple linkage files may be submitted to MetaMaker, an associated tool on the CANDID website, to create a meta linkage file by summing individual LOD curves. All marker positions are in centiMorgans (cM) and correspond to the Marshfield genetic map. Base pair positions can be converted to approximate Marshfield cM positions using MapConverter, another tool on the CANDID website.
CANDID assigns a linkage score to each gene based on the approximate LOD score at the gene’s location. Approximate cM positions for each gene have been interpolated by examining the physical distance between the midpoint of the gene and the two closest Marshfield markers. The linkage score for a gene is interpolated between the two closest markers with assigned LOD scores and then normalized by dividing by the highest individual gene’s linkage score. The highest maximum linkage score will be 1, but some genes may have negative linkage scores if they are associated with negative LOD scores. This method therefore filters out these genes, even in the presence of moderate to high scores from other criteria.
When a CANDID user is interested in analyzing one or more loci in the absence of linkage data, a dummy linkage file may be created to focus the analysis on specific intervals. This is done using four dummy markers for each interval. Two represent the boundaries of the interval, and both of these markers are assigned the same arbitrary non-zero LOD score. Additionally, two markers are created just outside the interval and assigned a LOD score of 0. In this way, only the genes in the interval will receive a non-zero linkage score from CANDID, allowing them to be separately analyzed if the user has chosen the option to limit analysis only to genes with LOD scores greater than 0.
Association data and scoring
CANDID can accept and use SNP-based association data from the user. The user supplies a file where each line contains a SNP ID from dbSNP and a p-value for that SNP. CANDID assigns each of these SNPs to their associated genes according to NCBI’s dbSNP database. The best p-value for each gene is subtracted from 1 to yield each gene’s association score. Users will note that genes with more tested SNPs are more likely to have a good p-value, and therefore a good association score, due to multiple tests. It should also be noted that a gene with one SNP and a highly insignificant p-value will always receive a higher association score than a gene with no associated SNPs. To eliminate these problems, the user has the option of setting a p-value threshold, where p-values greater than the threshold are not considered. Using this threshold greatly speeds up the association analysis and also results in the same range of scores, since association scores are normalized to fall between 0 and 1 regardless of whether the threshold is used.
Custom data and scoring
In addition to linkage and association data, CANDID can also accept and utilize other data. Users may provide a two-column custom file, where each line contains an EntrezGene ID and a numeric score, with higher numbers corresponding to greater interest in the gene. This data will be weighted and used like the other CANDID criteria.
Final score determination and ranking
The CANDID user must specify a series of weights corresponding to the eight criteria described above. Criteria with non-zero weights are evaluated, and their scores are multiplied by the user-defined criterion-specific weights. Finally, a gene’s weighted scores are summed across all criteria to produce the final score. Genes are ranked by final score, and this information, along with normalized raw scores and basic information on each gene, is provided in a comma-separated output file available for download from the server. This file can easily be opened in Microsoft Excel or any number of statistical software packages. The user is also provided with a summary file stating the parameters used for the analysis as well as a literature file with further information on the publications scores.
ROC curve calculation and analysis
For all CANDID tests, ranks of causal genes were extracted from CANDID output files and used to create receiver operating characteristic (ROC) curves. For each data point in the curve, the specificity corresponds to the percentage of genes that ranked lower than the causal gene(s), while the sensitivity corresponds to the percentage of the causal genes that achieved at least that level of specificity. For example, a specificity value of 0.91 and a sensitivity value of 0.65 indicates that 65% of the causal genes ranked at or above the 91st percentile in the CANDID output. The area under the curve (AUC) for each ROC is an indicator of the performance of the algorithm; an algorithm that ranked the causal gene(s) first every time would have an AUC of 1, while an algorithm that randomly ranked the causal gene(s) would have an AUC of 0.5.
Analysis of known genes responsible for traits in OMIM
In order to gauge the effectiveness of CANDID and its various criteria in ranking candidate genes, 29 complex traits were selected from the Online Mendelian Inheritance in Man (OMIM) database. First, a set of 154 traits and associated identified causal genes on chromosome 1 was selected, and from that set, 29 traits were chosen that are generally common in the population or known to be influenced by multiple genes. These traits include various cancers, Alzheimer’s disease, obesity, and others. Phenotypic keywords were chosen for each trait by referencing the trait descriptions in OMIM. Additionally, when the trait seemed to affect certain tissues, those tissue codes were identified in order to use the expression criterion. A full list of the 29 traits, their keywords, tissue codes, causal genes, and OMIM identifiers is available as Supplementary Table I. Keywords and tissue codes were selected a priori and were not changed at any point in the analysis.
For each trait, the identified keywords and tissue codes were used in a genomewide CANDID analysis using version 1 of the CANDID databases. Five criteria were scored in these analyses: publications, protein domains, conservation, expression, and protein-protein interactions. To further assess CANDID’s specificity, the 29 traits and their corresponding gene(s) were shuffled 100 times. Additionally, each of the 29 traits was paired with a randomly selected gene 100 times. The AUCs from the analyses using the true causal genes were compared to the AUCs resulting from the shuffled and random gene analyses using the Wilcoxon signed-rank test.
To maximize the specificity and sensitivity of CANDID when using more than one criterion, 11 values were tested for each criterion weight. These values ranged from 0 to 1 by increments of 0.1 and yielded 161,051 possible configurations of weights for the five criteria. Some of these configurations were redundant; a configuration with weights of (0, 0, 0, 0.3, 0.6) would yield identical results to a configuration with weights of (0, 0, 0, 0.1, 0.2), since these weights serve only to rank genes relative to each other. The AUCs of all weight configurations were determined, and the highest AUC was used to select the optimal configuration. This was performed in both a genomewide setting and a locus-limited setting, where a dummy linkage file was used to restrict CANDID’s analysis to only chromosome 1.
To test the resulting optimal weight configuration, 15 additional complex or polygenic traits were selected from the subset of traits in OMIM that are linked to chromosome 2 (Supplementary Table I). As with the chromosome 1 traits, keywords and tissue codes were selected for these traits, and genomewide and chromosome-specific CANDID analyses were performed using the optimal weight configuration obtained from the chromosome 1 analyses. Ranks of causal genes on chromosome 2 were determined, and AUCs were calculated for both the genomewide and chromosome-specific analyses.
Analysis of recently characterized causal genes for complex traits
CANDID was designed for gene discovery purposes, and often, genes found to contain causal variants have no prior published association with the trait of interest. To model a gene discovery effort, gene-trait associations published after November 2006 were identified. The first version of the CANDID databases was compiled prior to the publication of these works, so the evidence from these publications that links the genes to their corresponding traits was not factored into CANDID’s analysis. These publications identified causal variants for complex human traits by using various methods, including studies of promising candidate genes as well as genomewide studies. In several situations, a small cluster of genes was identified, but the causal gene could not be determined due to linkage disequilibrium; in these cases, all genes in the cluster were used in this analysis. A full list of all 56 genes and their associated traits is included in Table I. Keywords describing the ascertained traits were carefully selected from the publications, and tissues were selected for the expression criterion if it was deemed appropriate to do so (Supplementary Table II). Keywords and tissue codes were selected a priori and were not changed at any point in the analysis.
Table I.
Genes with recently identified complex human trait associations
| Reference | Gene | Trait | Rank (genome) |
Rank (locus) |
|---|---|---|---|---|
| Original set of 56 gene-trait associations | ||||
|
| ||||
| [Mullighan, et al. 2007] | PAX5 | acute lymphoblastic leukemia | 2302 | 16 |
|
| ||||
| [Riemenschneider, et al. 2006] | PLAU | Alzheimer’s disease | 115 | 1 |
|
| ||||
| [Rogaeva, et al. 2007] | SORL1 | Alzheimer’s disease | 148 | 2 |
|
| ||||
| [Liu, et al. 2007] | HNT | Alzheimer’s disease (late-onset) | 1094 | 12 |
|
| ||||
| [Liu, et al. 2007] | OPCML | Alzheimer’s disease (late-onset) | 486 | 7 |
|
| ||||
| [Durand, et al. 2007] | SHANK3 | autism spectrum disorders | 3345 | 26 |
|
| ||||
| [Frayling, et al. 2007] | FTO | body mass index | 6935 | 38 |
|
| ||||
| [Seal, et al. 2006] | BRIP1 | breast cancer | 1912 | 21 |
|
| ||||
| [Cox, et al. 2007] | CASP8 | breast cancer | 67 | 1 |
|
| ||||
| [Easton, et al. 2007] | FGFR2 | breast cancer | 5404 | 39 |
|
| ||||
| [Easton, et al. 2007] | LSP1 | breast cancer | 7108 | 55 |
|
| ||||
| [Easton, et al. 2007] | MAP3K1 | breast cancer | 359 | 5 |
|
| ||||
| [Erkko, et al. 2007] | PALB2 | breast cancer | 11251 | 77 |
|
| ||||
| [Easton, et al. 2007] | TOX3 | breast cancer | 10741 | 65 |
|
| ||||
| [Sun, et al. 2007] | CASP8 | cancer (multiple types) | 67 | 1 |
|
| ||||
| [Hata, et al. 2007] | AGTRL1 | cerebral infarction | 3045 | 15 |
|
| ||||
| [Kubo, et al. 2007] | PRKCH | cerebral infarction | 4309 | 27 |
|
| ||||
| [Pare, et al. 2007] | EDN1 | coronary artery disease | 1816 | 2 |
|
| ||||
| [Rioux, et al. 2007] | ATG16L1 | Crohn’s disease | 5657 | 45 |
|
| ||||
| [Rioux, et al. 2007] | FAM92B | Crohn’s disease | 14848 | 119 |
|
| ||||
| [Rioux, et al. 2007] | NCF4 | Crohn’s disease | 3566 | 31 |
|
| ||||
| [Rioux, et al. 2007] | PHOX2B | Crohn’s disease | 3349 | 10 |
|
| ||||
| [Shaw-Smith, et al. 2006] | MAPT | developmental delay, learning disability | 176 | 1 |
|
| ||||
| [Duffy, et al. 2007] | OCA2 | eye color | 621 | 8 |
|
| ||||
| [Chan, et al. 2006] | MSH2 | hereditary nonpolyposis colorectal cancer | 141 | 2 |
|
| ||||
| [Gao, et al. 2007] | CHD7 | idiopathic scoliosis | 3936 | 26 |
|
| ||||
| [Dempfle, et al. 2006] | VDR | idiopathic short stature | 361 | 2 |
|
| ||||
| [Duerr, et al. 2006] | IL23R | inflammatory bowel disease | 946 | 4 |
|
| ||||
| [Lucae, et al. 2006] | P2RX7 | major depressive disorder | 5105 | 31 |
|
| ||||
| [Dieterich, et al. 2007] | AURKC | male infertility | 399 | 3 |
|
| ||||
| [Papassotiropoulos, et al. 2006] | WWC1 | memory performance | 1630 | 16 |
|
| ||||
| [Tarpey, et al. 2006] | AP1S2 | mental retardation | 4944 | 27 |
|
| ||||
| [Bierut, et al. 2007] | DLG4 | nicotine dependence | 4 | 1 |
|
| ||||
| [Bierut, et al. 2007] | GABARAP | nicotine dependence | 1559 | 10 |
|
| ||||
| [Miyamoto, et al. 2007] | GDF5 | osteoarthritis | 20 | 1 |
|
| ||||
| [Tosh, et al. 2006] | MICA | paucibacillary leprosy | 358 | 9 |
|
| ||||
| [Tosh, et al. 2006] | MICB | paucibacillary leprosy | 784 | 32 |
|
| ||||
| [Bogdanova, et al. 2007] | ANXA5 | pregnancy loss | 744 | 3 |
|
| ||||
| [Cargill, et al. 2007] | IL23R | psoriasis | 1767 | 4 |
|
| ||||
| [Chen, et al. 2006] | ACSL6 | schizophrenia | 2361 | 17 |
|
| ||||
| [Chen, et al. 2006] | CDC42SE2 | schizophrenia | 3879 | 29 |
|
| ||||
| [Choudhury, et al. 2007] | FXYD6 | schizophrenia | 4077 | 39 |
|
| ||||
| [Chen, et al. 2006] | RAPGEF6 | schizophrenia | 1691 | 7 |
|
| ||||
| [Graham, et al. 2006] | CD28 | systemic erythematosus lupus | 253 | 5 |
|
| ||||
| [Graham, et al. 2006] | CTLA4 | systemic erythematosus lupus | 233 | 5 |
|
| ||||
| [Graham, et al. 2006] | ICOS | systemic erythematosus lupus | 379 | 9 |
|
| ||||
| [Romeo, et al. 2007] | ANGPTL4 | triglyceride levels | 366 | 4 |
|
| ||||
| [Zeggini, et al. 2007] | CDKAL1 | type 2 diabetes | 6107 | 32 |
|
| ||||
| [Zeggini, et al. 2007] | CDKN2A | type 2 diabetes | 2755 | 9 |
|
| ||||
| [Zeggini, et al. 2007] | CDKN2B | type 2 diabetes | 16521 | 75 |
|
| ||||
| [Zeggini, et al. 2007] | FTO | type 2 diabetes | 7615 | 45 |
|
| ||||
| [Zeggini, et al. 2007] | HHEX | type 2 diabetes | 4338 | 20 |
|
| ||||
| [Zeggini, et al. 2007] | IDE | type 2 diabetes | 129 | 2 |
|
| ||||
| [Zeggini, et al. 2007] | IGF2BP2 | type 2 diabetes | 1403 | 12 |
|
| ||||
| [Zeggini, et al. 2007] | SLC30A8 | type 2 diabetes | 2829 | 18 |
|
| ||||
| [Dewan, et al. 2006] | HTRA1 | wet age-related macular degeneration | 1645 | 20 |
|
| ||||
| Average (± s.e.m.) | 3000+483 | 20+3 | ||
|
| ||||
| Additional 19 gene-trait associations | ||||
|
| ||||
| [Broderick, et al. 2007] | SMAD7 | colorectal cancer | 954 | 11 |
|
| ||||
| [Shen, et al. 2007] | LRP8 | coronary artery disease | 10108 | 42 |
|
| ||||
| [Sulem, et al. 2007] | SLC24A4 | hair and eye color | 16356 | 62 |
|
| ||||
| [Sulem, et al. 2007] | KITLG | hair color | 387 | 2 |
|
| ||||
| [Willer, et al. 2008] | GALNT2 | HDL cholesterol levels | 9698 | 68 |
|
| ||||
| [Willer, et al. 2008] | MMAB | HDL cholesterol levels | 11712 | 95 |
|
| ||||
| [Willer, et al. 2008] | MVK | HDL cholesterol levels | 364 | 4 |
|
| ||||
| [Willer, et al. 2008] | CELSR2 | LDL cholesterol levels | 7940 | 22 |
|
| ||||
| [Willer, et al. 2008] | PSRC1 | LDL cholesterol levels | 14850 | 112 |
|
| ||||
| [Willer, et al. 2008] | SORTl | LDL cholesterol levels | 435 | 6 |
|
| ||||
| [Mio, et al. 2007] | COL11Al | lumbar disc herniation | 170 | 2 |
|
| ||||
| [Stefansson, et al. 2007] | BTBD9 | restless legs syndrome | 4803 | 44 |
|
| ||||
| [Plenge, et al. 2007] | C5 | rheumatoid arthritis | 231 | 5 |
|
| ||||
| [Plenge, et al. 2007] | TRAF1 | rheumatoid arthritis | 389 | 4 |
|
| ||||
| [Stokowski, et al. 2007] | SLC24A5 | skin pigmentation | 1389 | 9 |
|
| ||||
| [Stokowski, et al. 2007] | SLC45A2 | skin pigmentation | 133 | 2 |
|
| ||||
| [Willer, et al. 2008] | ANGPTL3 | triglyceride levels | 187 | 6 |
|
| ||||
| [Willer, et al. 2008] | MLXIPL | triglyceride levels | 273 | 2 |
|
| ||||
| [Willer, et al. 2008] | TRIB1 | triglyceride levels | 14856 | 116 |
|
| ||||
| Average (± s.e.m.) | 5012+1383 | 32+9 | ||
Analysis of these traits was conducted similarly to the OMIM analyses. Each of the five main criteria was evaluated separately and in combination with 161,051 different weight configurations. For each of the criterion-specific analyses, the 56 gene-trait pairs were also shuffled 100 times, and each of the traits was also paired with a randomly selected gene 100 times. The analyses of various weight configurations were conducted in a genomewide setting as well as a locus-limited setting, where dummy linkage files limited the analysis to the 200 genes closest to the true causal gene. The other main difference between the recently identified causal gene analysis and the OMIM analysis is that while genes associated with the same trait were analyzed together in the OMIM analyses, each of these 56 gene-trait pairs was analyzed separately. The optimal weight configuration was determined by selecting the configuration that produced the highest AUC.
To test this resulting set of optimal weights, an additional 19 causal genes and their corresponding traits were selected. These gene-trait associations were also published after the compilation of the first version of the CANDID databases. Once again, relevant keywords were selected for each trait, and tissue codes were selected if applicable (Supplementary Table II). This information was used to run both genomewide and locus-limited CANDID analyses using the optimal weight configuration determined from the analysis of the original 56 gene-trait pairs. Ranks of the causal genes were determined, and AUCs were calculated. To compare CANDID to Endeavour, training sets of genes were determined from OMIM for each trait, and loci including the recently identified gene and 199 surrounding genes were selected and used as input for Endeavour. A full list of this information is in Supplementary Table III.
Databases and computing
CANDID databases are periodically built using Perl scripts implementing the DB_File module (version 1.814). Users can choose which version of the CANDID databases they would like to use. To date, several versions have been constructed. Version 1 was compiled from data downloaded in November 2006, while the data used to construct version 2 was downloaded in June 2007. New database versions will be soon automatically created each month. Both version 1 and version 2 contain a similar number of genes, with 38,697 in version 1 and 38,530 in version 2. In the version 2 databases, 85% of protein coding genes have information for at least one of the five data-independent criteria. Except where specified otherwise, CANDID is described using the current version 2 dataset. On average, a CANDID query returns results in less than three minutes, though run time can increase if there are many literature matches or extensive supplied association data.
Results
Genes associated with complex traits in OMIM
29 common or multigenic traits were selected from OMIM as described in the Methods section and used to analyze the effectiveness of each individual criterion. Receiver operating characteristic (ROC) curves were calculated to determine each criterion’s specificity and sensitivity. These values were generally high and, in most cases, statistically significantly higher than the values determined when the gene-trait pairs were randomized (Supplementary Figure 1).
Different weight configurations were assessed to select the configuration that maximized CANDID’s sensitivity and specificity. One set of redundant configurations proved to be optimal for ranking genes associated with the OMIM traits: the configurations where all weights equaled zero except for the publications weight. For the genomewide analysis, this configuration yielded an AUC of 0.923, while a configuration with equal weights yielded an AUC of 0.895 (Figure 2A). The AUCs were improved when a dummy linkage file was used to limit the analysis to evaluate only genes on chromosome 1. In this case, the AUC for the publications-only analysis was 0.983, compared to an AUC of 0.927 when all criteria were weighted equally (Figure 2B). Using the optimal weight conditions, both shuffling the genes and their traits and pairing the traits with randomly selected genes resulted in significantly lower AUCs: approximately 0.81 when genes were shuffled (P = 8.4 × 10⁻⁹) and 0.52 when genes were randomly selected. Genomewide and chromosome-specific analyses of an additional 15 traits linked to chromosome 2 were performed using the publications-only weight configuration, and results were similar to those from the chromosome 1 traits, with AUCs of 0.969 (genomewide) and 0.971 (chromosome 2 only) (Figure 2).
Figure 2.
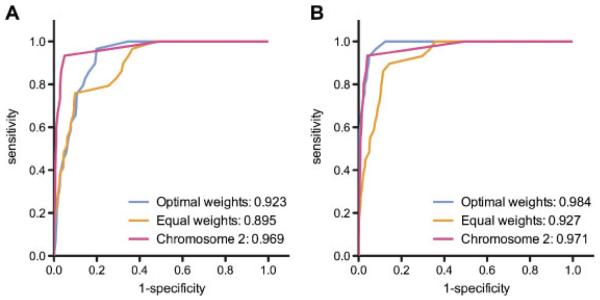
Success in predicting OMIM genes using 5 main criteria. Receiver operating characteristic (ROC) curves were generated for the genomewide (A) and chromosome-specific (B) analyses of traits linked to chromosomes 1 and 2. Analyses of traits linked to chromosome 1 using the optimal weight combination (blue) and equal weights (orange) are shown. Analysis of traits linked to chromosome 2 using the optimal weight combination is shown in pink.
Recently published causal genes for complex traits
Next, CANDID was tested in a gene discovery situation, where genes did not necessarily have any prior publications linking them to the trait. As with the OMIM genes, the effectiveness of each individual criterion in ranking these causal genes was evaluated. Unsurprisingly, when attempting to rank these recently characterized genes, the specificity and sensitivity were slightly lower than when attempting to rank the well-characterized OMIM genes (Supplementary Figure 2). However, in most cases, these values were significantly higher than values determined when the gene-trait pairs were randomized.
The optimal weight configuration for ranking recently characterized genes was determined to be one in which the publications scores are weighted by 1, the expression scores are weighted by 0.2, and the protein-protein interactions scores are weighted by 0.1. The protein domains and conservation scores had weights equal to 0 and were not used in the optimal weight configuration. For the genomewide CANDID analyses, use of the optimal weights improved the AUC to 0.926 compared with 0.878 when all weights were equal (Figure 3A). The optimal weight configuration for the locus-limited analysis was the same as for the genomewide analysis, yielding an AUC of 0.906 compared with an AUC of 0.843 when all weights were equal (Figure 3B). Randomly shuffling the genes and traits resulted in significantly lower AUCs (0.818 for the genomewide analysis, P = 7.2 × 10⁻¹³, and 0.755 for the locus-specific analysis, P = 2.4 × 10⁻¹²), as did randomly selecting genes (0.502 and 0.487, respectively).
Figure 3.
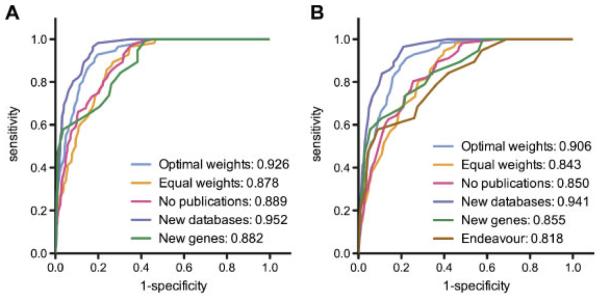
Success in predicting recently published genes using 5 data-independent criteria in (A) genomewide and (B) locus-specific analyses. Receiver operating characteristic (ROC) curves are shown for the optimal weight configuration (blue), equal weights configuration (orange), and optimal weight configuration excluding publications (pink). The purple curves represent the ROC curves produced when optimal weights were used with updated databases from June 2007. Green ROC curves indicate the results from analyses with the optimal weight configuration on the 19 gene-trait pairs not used in the original analysis. The brown ROC curve in (B) represents results from an Endeavour analysis using the 19 gene-trait pairs.
CANDID’s optimal weight configuration depends heavily on publications. Since the publications criterion in turn depends on the keyword selection, one or two keywords were dropped for each trait in the genomewide analysis, and the resulting AUC was not significantly different (0.912 compared to 0.926 with all keywords, data not shown.) It is also possible that novel causal genes of unknown function could be missed using CANDID’s optimal weight configuration. To test this, the optimal weight configuration using all data sources other than publications was determined. This configuration weights protein domains by 0.1, conservation by 0.1, gene expression by 0.3, and protein-protein interactions by 0.9. Though not quite as accurate as the optimal weight configuration, it still has a very high AUC (0.889 for the genomewide analysis and 0.850 for the locus-limited analysis, Figure 3.) When the original optimal configuration of weights was used to repeat the CANDID analyses after CANDID’s publications database was updated to version 2, including the publications describing the 56 gene-trait pairs, the specificity and sensitivity increased, yielding AUCs of 0.952 and 0.941 for the genomewide and locus-specific analyses (Figure 3). Finally, the optimal weight configuration was also quite successful in ranking the 19 causal genes that were not included as part of the original set of 56 gene-trait pairs (genomewide AUC = 0.882, locus-limited AUC = 0.855). When these gene-trait pairs were analyzed with Endeavour in a locus-limited setting, the AUC was lower (0.818, Figure 3B).
Discussion
CANDID is a flexible and easy to use method for identifying and prioritizing candidate genes for complex human traits. CANDID uses a variety of sources, including publications, protein domains, cross-species conservation levels, gene expression levels, and protein-protein interactions to assess and rank all human genes. These five criteria were chosen to reduce or eliminate dependence on the user’s personal knowledge. Though users may optionally contribute their own linkage, association, and other experimental data to CANDID’s prioritization process, prior data is not required. Additionally, CANDID does not require the definition of training or test sets, which may limit the types of traits available for analysis. Compared to other candidate identification algorithms (CIAs), CANDID may the most versatile.
CANDID’s effectiveness was rigorously tested using two types of datasets: genes linked to common or complex traits described in OMIM and genes recently linked to complex traits. The resulting AUCs were quite high compared to AUCs for other gene prioritization programs. Prioritizer, developed by Franke, et al, demonstrated an AUC of 0.90 when the method was used to characterize gene networks, but when used to prioritize known OMIM genes at a given locus, the AUCs appear to be between 0.65-0.70 [Franke, et al. 2006]. Endeavour, probably the most accurate candidate gene prioritizer to date, produced an AUC of 0.866 for known OMIM genes and 0.805 for the same genes when publication data was omitted to avoid bias [Aerts, et al. 2006]. CANDID’s AUCs exceeded these values in both the OMIM gene analysis (genomewide weight-optimized AUC = 0.923, genomewide chromosome 2 analysis AUC = 0.969) and the simulated gene discovery analysis (genomewide weight-optimized AUC = 0.926, genomewide new gene analysis AUC = 0.882). This indicates that if the number of genes to be tested is equal, CANDID should rank true causal genes higher than the other algorithms. Furthermore, Endeavour was used to rank a handful of genes that had been recently linked to complex traits. These analyses were limited to a 200-gene locus, and the publication data used was “rolled back” to one year before the critical publications were published. The average rank of the causal genes was 40 in Endeavour’s analysis; in CANDID’s very similar simulated gene discovery analysis, the average causal gene rank was 20 (Table I) [Aerts, et al. 2006]. In a “head-to-head” comparison of CANDID and Endeavour using 19 gene-trait pairs, Endeavour also had a lower AUC (0.818), despite the fact that it could access databases that were updated after the gene-trait associations were published, while CANDID’s databases were compiled prior to this.
Some limitations do exist to CANDID’s performance. Chief among these is a problem inherent in all of CANDID’s data sources – that the genome is incompletely and unevenly described. As annotation increases, so may the perception of public data sources as complete or infallible. It is worth pointing out that even databases such as dbSNP, which contain millions of entries, fail to provide even, complete coverage. Furthermore, the gaps in coverage may be nonrandom, depending on the database used. For example, users supplying custom data from a genomewide association study may note that genes involved in immune response and sensory perception are located in regions of weak linkage disequilibrium, and as such, may be underrepresented by SNPs on the current generation of SNP chips [Li, et al. 2008; Smith, et al. 2005]. Similarly, the average CANDID user may be concerned with the uneven coverage of the scientific literature, upon which CANDID relies heavily. The high relative weight attributed to the publications criterion may raise questions about CANDID’s ability to rank genes that have yet to be characterized in the scientific literature. The accuracy of a genomewide CANDID analysis excluding the publications criterion was high (AUC = 0.889), though not as high as when publications were included (AUC = 0.926). Additionally, the optimal weight configuration changed significantly when publications were excluded, the main difference being the inclusion of the protein domains and conservation criteria. Users who wish to focus strongly on poorly characterized genes may therefore choose to use the publications-excluded optimal weight configuration. All users should note that increasing the number of data sources used in a CANDID analysis might help to reduce bias against genes that are underrepresented in any one particular data source. Additionally, careful selection of the criteria to be used and an understanding of each criterion’s flaws are important.
The high reliance on certain criteria may raise questions of the effectiveness of other criteria in identifying true causal genes. For example, the optimal weight configuration for gene discovery contained weights of 0 for the protein domains and conservation criteria. These criteria performed significantly better than would be expected of a random prioritization algorithm (Supplementary Figures 1, 2), but they failed to distinguish between the causal gene(s) specific to a given trait and causal genes for other traits. It is interesting to note that, even when using optimal weight configurations, the AUCs resulting from shuffling gene-trait associations were high. Though generally significantly different from the AUCs resulting from the correct gene-trait pairs, these AUCs were higher than expected. This may indicate that CANDID tends to prioritize genes causal for any trait over genes not causal for any traits. One CIA, PROSPECTR, aims to do just this by utilizing sequence features [Adie, et al. 2005]. However, CANDID does not evaluate genes directly at the sequence level. It is possible that causal genes are instead characterized by a number of other factors measured by CANDID, such as a large number of protein-protein interactions, the presence of identified functional domains, extensive cross-species conservation or tissue-specific expression patterns. As more gene-trait associations are published, it may be possible to examine this profile in greater detail.
One of CANDID’s strengths is its ability to conduct genomewide analyses, whereas other CIAs must focus on a specific locus or set of genes. CANDID appears to be equally effective in genomewide and locus-specific settings. In the OMIM gene set, CANDID performed slightly better when limited to the 3,504 genes on chromosome 1, while in the gene discovery setting, CANDID performed slightly worse when limited to a 200-gene locus. Causal genes will therefore be ranked in roughly the same percentile, regardless of how many genes are analyzed. It is therefore suggested that as a practical matter, users who wish to follow up on a smaller number of genes should limit their analyses to one or more loci, if feasible.
Though CANDID has been described here as a method for prioritizing candidate genes for complex human traits, it can easily be used to investigate other traits, including Mendelian human traits. Murine versions of the CANDID databases are in preparation for users who wish to investigate mouse traits. In addition, a batch mode version of CANDID is available upon request for individuals who wish to adapt the CANDID algorithm and databases to high-throughput gene identification and other methods.
The potential applications of CANDID are numerous. A ranked list of candidate genes can be created to select genes for a variety of initial or follow-up studies. If a promising locus is identified, CANDID could be used to prioritize genes within that region for resequencing or SNP-based genotyping. Additionally, results from genomewide CANDID analyses could be used to identify a large set of genes to use in the construction of custom microarrays. Ranked output of candidates could also prove useful in analyzing the large amount of data generated by genomewide association studies; instead of analyzing all SNPs at once, requiring a correction for a large number of tests, smaller batches of SNPs could be analyzed sequentially, based on CANDID’s ranking of their corresponding genes. When used wisely, CANDID has great potential to reduce bias in candidate gene-directed studies and to streamline genomewide studies.
Supplementary Material
Acknowledgments
We thank two anonymous reviewers for their thoughts and advice. We also thank Andrew Van Brunt for his helpful comments on this manuscript and all investigators who have assisted in contributing data to the sources used by CANDID. JEH is supported by a National Defense Science and Engineering Graduate Fellowship and by the Mr. and Mrs. Spencer T. Olin Fellowship for Graduate Women. ATK, HLM and MAP are supported in part by the NIH Pharmacogenetics Research Network (U01 GM063340).
References
- Abecasis GR, Cherny SS, Cookson WO, Cardon LR. Merlin--rapid analysis of dense genetic maps using sparse gene flow trees. Nat Genet. 2002;30(1):97–101. doi: 10.1038/ng786. [DOI] [PubMed] [Google Scholar]
- Adie EA, Adams RR, Evans KL, Porteous DJ, Pickard BS. Speeding disease gene discovery by sequence based candidate prioritization. BMC Bioinformatics. 2005;6:55. doi: 10.1186/1471-2105-6-55. [DOI] [PMC free article] [PubMed] [Google Scholar]
- Adie EA, Adams RR, Evans KL, Porteous DJ, Pickard BS. SUSPECTS: enabling fast and effective prioritization of positional candidates. Bioinformatics. 2006;22(6):773–4. doi: 10.1093/bioinformatics/btk031. [DOI] [PubMed] [Google Scholar]
- Aerts S, Lambrechts D, Maity S, Van Loo P, Coessens B, De Smet F, Tranchevent LC, De Moor B, Marynen P, Hassan B. Gene prioritization through genomic data fusion. Nat Biotechnol. 2006;24(5):537–44. doi: 10.1038/nbt1203. others. [DOI] [PubMed] [Google Scholar]
- Almasy L, Blangero J. Multipoint quantitative-trait linkage analysis in general pedigrees. Am J Hum Genet. 1998;62(5):1198–211. doi: 10.1086/301844. [DOI] [PMC free article] [PubMed] [Google Scholar]
- Ashburner M, Ball CA, Blake JA, Botstein D, Butler H, Cherry JM, Davis AP, Dolinski K, Dwight SS, Eppig JT. Gene ontology: tool for the unification of biology. The Gene Ontology Consortium. Nat Genet. 2000;25(1):25–9. doi: 10.1038/75556. others. [DOI] [PMC free article] [PubMed] [Google Scholar]
- Bierut LJ, Madden PA, Breslau N, Johnson EO, Hatsukami D, Pomerleau OF, Swan GE, Rutter J, Bertelsen S, Fox L. Novel genes identified in a high-density genome wide association study for nicotine dependence. Hum Mol Genet. 2007;16(1):24–35. doi: 10.1093/hmg/ddl441. others. [DOI] [PMC free article] [PubMed] [Google Scholar]
- Bogdanova N, Horst J, Chlystun M, Croucher PJ, Nebel A, Bohring A, Todorova A, Schreiber S, Gerke V, Krawczak M. A common haplotype of the annexin A5 (ANXA5) gene promoter is associated with recurrent pregnancy loss. Hum Mol Genet. 2007;16(5):573–8. doi: 10.1093/hmg/ddm017. others. [DOI] [PubMed] [Google Scholar]
- Broderick P, Carvajal-Carmona L, Pittman AM, Webb E, Howarth K, Rowan A, Lubbe S, Spain S, Sullivan K, Fielding S. A genome-wide association study shows that common alleles of SMAD7 influence colorectal cancer risk. Nat Genet. 2007;39(11):1315–7. doi: 10.1038/ng.2007.18. others. [DOI] [PubMed] [Google Scholar]
- Calvo S, Jain M, Xie X, Sheth SA, Chang B, Goldberger OA, Spinazzola A, Zeviani M, Carr SA, Mootha VK. Systematic identification of human mitochondrial disease genes through integrative genomics. Nat Genet. 2006;38(5):576–82. doi: 10.1038/ng1776. [DOI] [PubMed] [Google Scholar]
- Cargill M, Schrodi SJ, Chang M, Garcia VE, Brandon R, Callis KP, Matsunami N, Ardlie KG, Civello D, Catanese JJ. A large-scale genetic association study confirms IL12B and leads to the identification of IL23R as psoriasis-risk genes. Am J Hum Genet. 2007;80(2):273–90. doi: 10.1086/511051. others. [DOI] [PMC free article] [PubMed] [Google Scholar]
- Chan TL, Yuen ST, Kong CK, Chan YW, Chan AS, Ng WF, Tsui WY, Lo MW, Tam WY, Li VS. Heritable germline epimutation of MSH2 in a family with hereditary nonpolyposis colorectal cancer. Nat Genet. 2006;38(10):1178–83. doi: 10.1038/ng1866. others. [DOI] [PubMed] [Google Scholar]
- Chen X, Wang X, Hossain S, O'Neill FA, Walsh D, Pless L, Chowdari KV, Nimgaonkar VL, Schwab SG, Wildenauer DB. Haplotypes spanning SPEC2, PDZ-GEF2 and ACSL6 genes are associated with schizophrenia. Hum Mol Genet. 2006;15(22):3329–42. doi: 10.1093/hmg/ddl409. others. [DOI] [PubMed] [Google Scholar]
- Choudhury K, McQuillin A, Puri V, Pimm J, Datta S, Thirumalai S, Krasucki R, Lawrence J, Bass NJ, Quested D. A genetic association study of chromosome 11q22-24 in two different samples implicates the FXYD6 gene, encoding phosphohippolin, in susceptibility to schizophrenia. Am J Hum Genet. 2007;80(4):664–72. doi: 10.1086/513475. others. [DOI] [PMC free article] [PubMed] [Google Scholar]
- Cox A, Dunning AM, Garcia-Closas M, Balasubramanian S, Reed MW, Pooley KA, Scollen S, Baynes C, Ponder BA, Chanock S. A common coding variant in CASP8 is associated with breast cancer risk. Nat Genet. 2007;39(3):352–8. doi: 10.1038/ng1981. others. [DOI] [PubMed] [Google Scholar]
- Dempfle A, Wudy SA, Saar K, Hagemann S, Friedel S, Scherag A, Berthold LD, Alzen G, Gortner L, Blum WF. Evidence for involvement of the vitamin D receptor gene in idiopathic short stature via a genome-wide linkage study and subsequent association studies. Hum Mol Genet. 2006;15(18):2772–83. doi: 10.1093/hmg/ddl218. others. [DOI] [PubMed] [Google Scholar]
- Dewan A, Liu M, Hartman S, Zhang SS, Liu DT, Zhao C, Tam PO, Chan WM, Lam DS, Snyder M. HTRA1 promoter polymorphism in wet age-related macular degeneration. Science. 2006;314(5801):989–92. doi: 10.1126/science.1133807. others. [DOI] [PubMed] [Google Scholar]
- Dieterich K, Soto Rifo R, Faure AK, Hennebicq S, Ben Amar B, Zahi M, Perrin J, Martinez D, Sele B, Jouk PS. Homozygous mutation of AURKC yields large-headed polyploid spermatozoa and causes male infertility. Nat Genet. 2007;39(5):661–5. doi: 10.1038/ng2027. others. [DOI] [PubMed] [Google Scholar]
- Dolan ME, Ni L, Camon E, Blake JA. A procedure for assessing GO annotation consistency. Bioinformatics. 2005;21(Suppl 1):i136–43. doi: 10.1093/bioinformatics/bti1019. [DOI] [PubMed] [Google Scholar]
- Duerr RH, Taylor KD, Brant SR, Rioux JD, Silverberg MS, Daly MJ, Steinhart AH, Abraham C, Regueiro M, Griffiths A. A genome-wide association study identifies IL23R as an inflammatory bowel disease gene. Science. 2006;314(5804):1461–3. doi: 10.1126/science.1135245. others. [DOI] [PMC free article] [PubMed] [Google Scholar]
- Duffy DL, Montgomery GW, Chen W, Zhao ZZ, Le L, James MR, Hayward NK, Martin NG, Sturm RA. A three-single-nucleotide polymorphism haplotype in intron 1 of OCA2 explains most human eye-color variation. Am J Hum Genet. 2007;80(2):241–52. doi: 10.1086/510885. [DOI] [PMC free article] [PubMed] [Google Scholar]
- Durand CM, Betancur C, Boeckers TM, Bockmann J, Chaste P, Fauchereau F, Nygren G, Rastam M, Gillberg IC, Anckarsater H. Mutations in the gene encoding the synaptic scaffolding protein SHANK3 are associated with autism spectrum disorders. Nat Genet. 2007;39(1):25–7. doi: 10.1038/ng1933. others. [DOI] [PMC free article] [PubMed] [Google Scholar]
- Easton DF, Pooley KA, Dunning AM, Pharoah PD, Thompson D, Ballinger DG, Struewing JP, Morrison J, Field H, Luben R. Genome-wide association study identifies novel breast cancer susceptibility loci. Nature. 2007;447(7148):1087–93. doi: 10.1038/nature05887. others. [DOI] [PMC free article] [PubMed] [Google Scholar]
- Erkko H, Xia B, Nikkila J, Schleutker J, Syrjakoski K, Mannermaa A, Kallioniemi A, Pylkas K, Karppinen SM, Rapakko K. A recurrent mutation in PALB2 in Finnish cancer families. Nature. 2007;446(7133):316–9. doi: 10.1038/nature05609. others. [DOI] [PubMed] [Google Scholar]
- Franke L, Bakel H, Fokkens L, de Jong ED, Egmont-Petersen M, Wijmenga C. Reconstruction of a functional human gene network, with an application for prioritizing positional candidate genes. Am J Hum Genet. 2006;78(6):1011–25. doi: 10.1086/504300. [DOI] [PMC free article] [PubMed] [Google Scholar]
- Frayling TM, Timpson NJ, Weedon MN, Zeggini E, Freathy RM, Lindgren CM, Perry JR, Elliott KS, Lango H, Rayner NW. A common variant in the FTO gene is associated with body mass index and predisposes to childhood and adult obesity. Science. 2007;316(5826):889–94. doi: 10.1126/science.1141634. others. [DOI] [PMC free article] [PubMed] [Google Scholar]
- Gao X, Gordon D, Zhang D, Browne R, Helms C, Gillum J, Weber S, Devroy S, Swaney S, Dobbs M. CHD7 gene polymorphisms are associated with susceptibility to idiopathic scoliosis. Am J Hum Genet. 2007;80(5):957–65. doi: 10.1086/513571. others. [DOI] [PMC free article] [PubMed] [Google Scholar]
- George RA, Liu JY, Feng LL, Bryson-Richardson RJ, Fatkin D, Wouters MA. Analysis of protein sequence and interaction data for candidate disease gene prediction. Nucleic Acids Res. 2006;34(19):e130. doi: 10.1093/nar/gkl707. [DOI] [PMC free article] [PubMed] [Google Scholar]
- Graham DS, Wong AK, McHugh NJ, Whittaker JC, Vyse TJ. Evidence for unique association signals in SLE at the CD28-CTLA4-ICOS locus in a family-based study. Hum Mol Genet. 2006;15(21):3195–205. doi: 10.1093/hmg/ddl395. [DOI] [PubMed] [Google Scholar]
- Hata J, Matsuda K, Ninomiya T, Yonemoto K, Matsushita T, Ohnishi Y, Saito S, Kitazono T, Ibayashi S, Iida M. Functional SNP in an Sp1-binding site of AGTRL1 gene is associated with susceptibility to brain infarction. Hum Mol Genet. 2007;16(6):630–9. doi: 10.1093/hmg/ddm005. others. [DOI] [PubMed] [Google Scholar]
- Kruglyak L, Daly MJ, Reeve-Daly MP, Lander ES. Parametric and nonparametric linkage analysis: a unified multipoint approach. Am J Hum Genet. 1996;58(6):1347–63. [PMC free article] [PubMed] [Google Scholar]
- Kubo M, Hata J, Ninomiya T, Matsuda K, Yonemoto K, Nakano T, Matsushita T, Yamazaki K, Ohnishi Y, Saito S. A nonsynonymous SNP in PRKCH (protein kinase C eta) increases the risk of cerebral infarction. Nat Genet. 2007;39(2):212–7. doi: 10.1038/ng1945. others. [DOI] [PubMed] [Google Scholar]
- Li M, Li C, Guan W. Evaluation of coverage variation of SNP chips for genome-wide association studies. Eur J Hum Genet. 2008 doi: 10.1038/sj.ejhg.5202007. [DOI] [PubMed] [Google Scholar]
- Liu F, Arias-Vasquez A, Sleegers K, Aulchenko YS, Kayser M, Sanchez-Juan P, Feng BJ, Bertoli-Avella AM, van Swieten J, Axenovich TI. A genomewide screen for late-onset Alzheimer disease in a genetically isolated dutch population. Am J Hum Genet. 2007;81(1):17–31. doi: 10.1086/518720. others. [DOI] [PMC free article] [PubMed] [Google Scholar]
- Lopez-Bigas N, Ouzounis CA. Genome-wide identification of genes likely to be involved in human genetic disease. Nucleic Acids Res. 2004;32(10):3108–14. doi: 10.1093/nar/gkh605. [DOI] [PMC free article] [PubMed] [Google Scholar]
- Lucae S, Salyakina D, Barden N, Harvey M, Gagne B, Labbe M, Binder EB, Uhr M, Paez-Pereda M, Sillaber I. P2RX7, a gene coding for a purinergic ligand-gated ion channel, is associated with major depressive disorder. Hum Mol Genet. 2006;15(16):2438–45. doi: 10.1093/hmg/ddl166. others. [DOI] [PubMed] [Google Scholar]
- Ma X, Lee H, Wang L, Sun F. CGI: a new approach for prioritizing genes by combining gene expression and protein-protein interaction data. Bioinformatics. 2007;23(2):215–21. doi: 10.1093/bioinformatics/btl569. [DOI] [PubMed] [Google Scholar]
- Mio F, Chiba K, Hirose Y, Kawaguchi Y, Mikami Y, Oya T, Mori M, Kamata M, Matsumoto M, Ozaki K. A functional polymorphism in COL11A1, which encodes the alpha 1 chain of type XI collagen, is associated with susceptibility to lumbar disc herniation. Am J Hum Genet. 2007;81(6):1271–7. doi: 10.1086/522377. others. [DOI] [PMC free article] [PubMed] [Google Scholar]
- Miyamoto Y, Mabuchi A, Shi D, Kubo T, Takatori Y, Saito S, Fujioka M, Sudo A, Uchida A, Yamamoto S. A functional polymorphism in the 5' UTR of GDF5 is associated with susceptibility to osteoarthritis. Nat Genet. 2007;39(4):529–33. doi: 10.1038/2005. others. [DOI] [PubMed] [Google Scholar]
- Mootha VK, Lepage P, Miller K, Bunkenborg J, Reich M, Hjerrild M, Delmonte T, Villeneuve A, Sladek R, Xu F. Identification of a gene causing human cytochrome c oxidase deficiency by integrative genomics. Proc Natl Acad Sci U S A. 2003;100(2):605–10. doi: 10.1073/pnas.242716699. others. [DOI] [PMC free article] [PubMed] [Google Scholar]
- Morrison JL, Breitling R, Higham DJ, Gilbert DR. GeneRank: using search engine technology for the analysis of microarray experiments. BMC Bioinformatics. 2005;6:233. doi: 10.1186/1471-2105-6-233. [DOI] [PMC free article] [PubMed] [Google Scholar]
- Mullighan CG, Goorha S, Radtke I, Miller CB, Coustan-Smith E, Dalton JD, Girtman K, Mathew S, Ma J, Pounds SB. Genome-wide analysis of genetic alterations in acute lymphoblastic leukaemia. Nature. 2007;446(7137):758–64. doi: 10.1038/nature05690. others. [DOI] [PubMed] [Google Scholar]
- Niculescu AB, 3rd, Segal DS, Kuczenski R, Barrett T, Hauger RL, Kelsoe JR. Identifying a series of candidate genes for mania and psychosis: a convergent functional genomics approach. Physiol Genomics. 2000;4(1):83–91. doi: 10.1152/physiolgenomics.2000.4.1.83. [DOI] [PubMed] [Google Scholar]
- Oti M, Snel B, Huynen MA, Brunner HG. Predicting disease genes using protein-protein interactions. J Med Genet. 2006;43(8):691–8. doi: 10.1136/jmg.2006.041376. [DOI] [PMC free article] [PubMed] [Google Scholar]
- Papassotiropoulos A, Stephan DA, Huentelman MJ, Hoerndli FJ, Craig DW, Pearson JV, Huynh KD, Brunner F, Corneveaux J, Osborne D. Common Kibra alleles are associated with human memory performance. Science. 2006;314(5798):475–8. doi: 10.1126/science.1129837. others. [DOI] [PubMed] [Google Scholar]
- Pare G, Serre D, Brisson D, Anand SS, Montpetit A, Tremblay G, Engert JC, Hudson TJ, Gaudet D. Genetic analysis of 103 candidate genes for coronary artery disease and associated phenotypes in a founder population reveals a new association between endothelin-1 and high-density lipoprotein cholesterol. Am J Hum Genet. 2007;80(4):673–82. doi: 10.1086/513286. [DOI] [PMC free article] [PubMed] [Google Scholar]
- Perez-Iratxeta C, Bork P, Andrade-Navarro MA. Update of the G2D tool for prioritization of gene candidates to inherited diseases. Nucleic Acids Res. 2007 doi: 10.1093/nar/gkm223. [DOI] [PMC free article] [PubMed] [Google Scholar]
- Perez-Iratxeta C, Wjst M, Bork P, Andrade MA. G2D: a tool for mining genes associated with disease. BMC Genet. 2005;6:45. doi: 10.1186/1471-2156-6-45. [DOI] [PMC free article] [PubMed] [Google Scholar]
- Plenge RM, Seielstad M, Padyukov L, Lee AT, Remmers EF, Ding B, Liew A, Khalili H, Chandrasekaran A, Davies LR. TRAF1-C5 as a risk locus for rheumatoid arthritis--a genomewide study. N Engl J Med. 2007;357(12):1199–209. doi: 10.1056/NEJMoa073491. others. [DOI] [PMC free article] [PubMed] [Google Scholar]
- Riemenschneider M, Konta L, Friedrich P, Schwarz S, Taddei K, Neff F, Padovani A, Kolsch H, Laws SM, Klopp N. A functional polymorphism within plasminogen activator urokinase (PLAU) is associated with Alzheimer's disease. Hum Mol Genet. 2006;15(16):2446–56. doi: 10.1093/hmg/ddl167. others. [DOI] [PubMed] [Google Scholar]
- Rioux JD, Xavier RJ, Taylor KD, Silverberg MS, Goyette P, Huett A, Green T, Kuballa P, Barmada MM, Datta LW. Genome-wide association study identifies new susceptibility loci for Crohn disease and implicates autophagy in disease pathogenesis. Nat Genet. 2007;39(5):596–604. doi: 10.1038/ng2032. others. [DOI] [PMC free article] [PubMed] [Google Scholar]
- Rogaeva E, Meng Y, Lee JH, Gu Y, Kawarai T, Zou F, Katayama T, Baldwin CT, Cheng R, Hasegawa H. The neuronal sortilin-related receptor SORL1 is genetically associated with Alzheimer disease. Nat Genet. 2007;39(2):168–77. doi: 10.1038/ng1943. others. [DOI] [PMC free article] [PubMed] [Google Scholar]
- Romeo S, Pennacchio LA, Fu Y, Boerwinkle E, Tybjaerg-Hansen A, Hobbs HH, Cohen JC. Population-based resequencing of ANGPTL4 uncovers variations that reduce triglycerides and increase HDL. Nat Genet. 2007;39(4):513–6. doi: 10.1038/ng1984. [DOI] [PMC free article] [PubMed] [Google Scholar]
- Rossi S, Masotti D, Nardini C, Bonora E, Romeo G, Macii E, Benini L, Volinia S. TOM: a web-based integrated approach for identification of candidate disease genes. Nucleic Acids Res. 2006;34:W285–92. doi: 10.1093/nar/gkl340. Web Server issue. [DOI] [PMC free article] [PubMed] [Google Scholar]
- Schadt EE, Lamb J, Yang X, Zhu J, Edwards S, Guhathakurta D, Sieberts SK, Monks S, Reitman M, Zhang C. An integrative genomics approach to infer causal associations between gene expression and disease. Nat Genet. 2005;37(7):710–7. doi: 10.1038/ng1589. others. [DOI] [PMC free article] [PubMed] [Google Scholar]
- Seal S, Thompson D, Renwick A, Elliott A, Kelly P, Barfoot R, Chagtai T, Jayatilake H, Ahmed M, Spanova K. Truncating mutations in the Fanconi anemia J gene BRIP1 are low-penetrance breast cancer susceptibility alleles. Nat Genet. 2006;38(11):1239–41. doi: 10.1038/ng1902. others. [DOI] [PubMed] [Google Scholar]
- Shaw-Smith C, Pittman AM, Willatt L, Martin H, Rickman L, Gribble S, Curley R, Cumming S, Dunn C, Kalaitzopoulos D. Microdeletion encompassing MAPT at chromosome 17q21.3 is associated with developmental delay and learning disability. Nat Genet. 2006;38(9):1032–7. doi: 10.1038/ng1858. others. [DOI] [PubMed] [Google Scholar]
- Shen GQ, Li L, Girelli D, Seidelmann SB, Rao S, Fan C, Park JE, Xi Q, Li J, Hu Y. An LRP8 variant is associated with familial and premature coronary artery disease and myocardial infarction. Am J Hum Genet. 2007;81(4):780–91. doi: 10.1086/521581. others. [DOI] [PMC free article] [PubMed] [Google Scholar]
- Smith AV, Thomas DJ, Munro HM, Abecasis GR. Sequence features in regions of weak and strong linkage disequilibrium. Genome Res. 2005;15(11):1519–34. doi: 10.1101/gr.4421405. [DOI] [PMC free article] [PubMed] [Google Scholar]
- Stefansson H, Rye DB, Hicks A, Petursson H, Ingason A, Thorgeirsson TE, Palsson S, Sigmundsson T, Sigurdsson AP, Eiriksdottir I. A genetic risk factor for periodic limb movements in sleep. N Engl J Med. 2007;357(7):639–47. doi: 10.1056/NEJMoa072743. others. [DOI] [PubMed] [Google Scholar]
- Stokowski RP, Pant PV, Dadd T, Fereday A, Hinds DA, Jarman C, Filsell W, Ginger RS, Green MR, van der Ouderaa FJ. A genomewide association study of skin pigmentation in a South Asian population. Am J Hum Genet. 2007;81(6):1119–32. doi: 10.1086/522235. others. [DOI] [PMC free article] [PubMed] [Google Scholar]
- Su AI, Wiltshire T, Batalov S, Lapp H, Ching KA, Block D, Zhang J, Soden R, Hayakawa M, Kreiman G. A gene atlas of the mouse and human protein-encoding transcriptomes. Proc Natl Acad Sci U S A. 2004;101(16):6062–7. doi: 10.1073/pnas.0400782101. others. [DOI] [PMC free article] [PubMed] [Google Scholar]
- Sulem P, Gudbjartsson DF, Stacey SN, Helgason A, Rafnar T, Magnusson KP, Manolescu A, Karason A, Palsson A, Thorleifsson G. Genetic determinants of hair, eye and skin pigmentation in Europeans. Nat Genet. 2007;39(12):1443–52. doi: 10.1038/ng.2007.13. others. [DOI] [PubMed] [Google Scholar]
- Sun T, Gao Y, Tan W, Ma S, Shi Y, Yao J, Guo Y, Yang M, Zhang X, Zhang Q. A six-nucleotide insertion-deletion polymorphism in the CASP8 promoter is associated with susceptibility to multiple cancers. Nat Genet. 2007;39(5):605–13. doi: 10.1038/ng2030. others. [DOI] [PubMed] [Google Scholar]
- Tarpey PS, Stevens C, Teague J, Edkins S, O'Meara S, Avis T, Barthorpe S, Buck G, Butler A, Cole J. Mutations in the gene encoding the Sigma 2 subunit of the adaptor protein 1 complex, AP1S2, cause X-linked mental retardation. Am J Hum Genet. 2006;79(6):1119–24. doi: 10.1086/510137. others. [DOI] [PMC free article] [PubMed] [Google Scholar]
- Tosh K, Ravikumar M, Bell JT, Meisner S, Hill AV, Pitchappan R. Variation in MICA and MICB genes and enhanced susceptibility to paucibacillary leprosy in South India. Hum Mol Genet. 2006;15(19):2880–7. doi: 10.1093/hmg/ddl229. [DOI] [PubMed] [Google Scholar]
- Troyanskaya OG. Putting the 'bio' into bioinformatics. Genome Biol. 2005;6(10):351. doi: 10.1186/gb-2005-6-10-351. [DOI] [PMC free article] [PubMed] [Google Scholar]
- Turner FS, Clutterbuck DR, Semple CA. POCUS: mining genomic sequence annotation to predict disease genes. Genome Biol. 2003;4(11):R75. doi: 10.1186/gb-2003-4-11-r75. [DOI] [PMC free article] [PubMed] [Google Scholar]
- van Driel MA, Cuelenaere K, Kemmeren PP, Leunissen JA, Brunner HG. A new web-based data mining tool for the identification of candidate genes for human genetic disorders. Eur J Hum Genet. 2003;11(1):57–63. doi: 10.1038/sj.ejhg.5200918. [DOI] [PubMed] [Google Scholar]
- Willer CJ, Sanna S, Jackson AU, Scuteri A, Bonnycastle LL, Clarke R, Heath SC, Timpson NJ, Najjar SS, Stringham HM. Newly identified loci that influence lipid concentrations and risk of coronary artery disease. Nat Genet. 2008 doi: 10.1038/ng.76. others. [DOI] [PMC free article] [PubMed] [Google Scholar]
- Zeggini E, Weedon MN, Lindgren CM, Frayling TM, Elliott KS, Lango H, Timpson NJ, Perry JR, Rayner NW, Freathy RM. Replication of genome-wide association signals in UK samples reveals risk loci for type 2 diabetes. Science. 2007;316(5829):1336–41. doi: 10.1126/science.1142364. others. [DOI] [PMC free article] [PubMed] [Google Scholar]
- Zhang P, Zhang J, Sheng H, Russo JJ, Osborne B, Buetow K. Gene functional similarity search tool (GFSST) BMC Bioinformatics. 2006;7:135. doi: 10.1186/1471-2105-7-135. [DOI] [PMC free article] [PubMed] [Google Scholar]
Associated Data
This section collects any data citations, data availability statements, or supplementary materials included in this article.