

Abstract
Aims/Introduction
Maternal undernutrition during pregnancy and/or lactation can alter the offspring's response to environmental challenges, and thus increases the risk of the development of metabolic diseases at a later age. However, whether maternal protein restriction can modulate glucose metabolism in the early life of offspring is less understood. Furthermore, we explored the potential underlying mechanisms that illustrate this phenotype.
Materials and Methods
To test this hypothesis, we examined the offspring of C57BL/6J mice at weaning to determine the effects of feeding their mothers a low-protein diet or normal chow diet throughout pregnancy and lactation. Gene array experiments and quantitative real-time polymerase chain reaction were utilized to explore the altered hepatic genes expression.
Results
The offspring of dams fed a low-protein diet had a lower birthweight and bodyweight, impaired glucose tolerance, decreased insulin sensitivity, and decreased serum cholesterol at weaning. Using gene array experiments, 253 differentially expressed genes were identified in the liver tissues of the offspring between the two groups. Bioinformatic analyses showed that all differentially expressed genes were mapped to 11 pathways. We focused on the ‘peroxisome proliferator-activated receptor signaling pathway,’ because peroxisome proliferator-activated receptors have emerged as central regulators of glucose and lipid homeostasis. Quantitative real-time polymerase chain reaction was utilized for the validation of genes in the pathway.
Conclusions
A maternal low-protein diet during pregnancy and lactation promotes early-onset glucose intolerance in the offspring mice, and the altered hepatic genes expression in peroxisome proliferator-activated receptor signaling pathway could play role in regulating this phenomenon.
Keywords: Early onset, Glucose intolerance, Maternal low-protein diet
Introduction
It is widely acknowledged that gestation is a critical time window, and maternal nutrition is a key determinant for the health of the offspring. The relationship between exposures during the critical periods of early life and lifetime consequences is well established in developmental biology. This concept was first proposed by Barker and Hales in the 1990s1, and is known as the ‘fetal programming hypothesis,’ which states that ‘early adaptations to a nutritional stress/stimulus can permanently change the physiology and metabolism of the organism and continue to be expressed even in the absence of the stimulus/stress that initiated them’2. This hypothesis has been authenticated by a substantial number of epidemiological studies and large-scale clinical cohorts, which have shown that malnutrition during fetal life can significantly impact the predisposition to the development of cardiovascular diseases and metabolic syndrome in adulthood3,4. In our previous study, lower birthweight was an independent risk factor for later diabetes, impaired glucose regulation and an increased presentation of metabolic syndrome components5,6.
In addition to epidemiological studies and clinical cohorts, experimental support for this hypothesis predominately originated from animal models. Abundant animal model studies have shown that a maternal low-protein diet (LPD) increased the risk for intrauterine growth restriction and led to metabolic diseases in the offspring during adulthood, such as hypertriglyceridemia and insulin resistance, impaired glucose tolerance and diabetes. However, these studies were confined to long-term modifications (adulthood or aging) in the offspring of a maternal LPD with varying durations from 1 to 18 months7–9. A recent study showed a maternal LPD had an impact on glucose and lipid metabolism in adult offspring. More precisely, the diet patterns included a maternal LPD throughout gestation and lactation, and the offspring were inversely given a high-fat diet until the age of 22–30 weeks10,11. Thus, the effects of a maternal LPD on the offspring would be interfered by a post-weaning high-fat diet in offspring.
Therefore, whether maternal low-protein feeding can impact glucose metabolism in the early life of offspring is less understood. We hypothesized that a maternal LPD only during pregnancy and lactation might promote an early-onset glucose intolerance and insulin resistance of the offspring at weaning (3 weeks-of-age). Furthermore, the mechanistic link between a maternal LPD and the metabolic diseases of their offspring is not completely understood. Therefore, we explored the underlying mechanisms to illustrate the phenotype without the interference of a long-term effect and the offspring's diet condition post-weaning.
Materials and Methods
Animals
C57BL/6J mice (approximately 8 weeks-of-age) were obtained from the Institute of Laboratory Animal Science, Chinese Academy of Medical Sciences and Peking Union Medical College (Beijing, China; SCXK-2013-0018). The animals were maintained under a 12-h light–dark cycle (lights on at 07.00 h) at a constant temperature of 22 ± 2°C, with standard pellet diet and water available ad libitum. All procedures were approved by the animal care and use committee of the Peking Union Medical College Hospital (Beijing, China; MC-07-6004), and were carried out in compliance with the Guide for the Care and Use of Laboratory Animals, 8th ed., 2011.
Experimental Procedures
All female mice received a normal chow diet (NCD) before mating, and they were allowed to acclimate to their new environment for 1 week. After the week, virgin females were time mated. Females were checked daily for postcopulatory plugs, and the presence of a plug in the morning after mating was considered day 0.5 of pregnancy. Then, the pregnant mice were randomly allocated to a NCD or a LPD. More specifically, the control group received a 200-g protein/kg diet, and the LPD group received an isoenergetic 80-g protein/kg diet throughout gestation and lactation, as described previously12. Nutrient composition of NCD is 20% casein, 20.3% sucrose, 41.5% maize starch, 12% corn oil and 4% cellulose, whereas the composition of LPD is 8% casein, 25.3% sucrose, 48.5 maize starch, 12% corn oil and 4% cellulose. All the food was purchased from Research Diets Inc, New Brunswick, NJ, USA. The mice were fed ad libitum, and their daily food consumption was calculated by weighing the remaining food twice a week. The litter size was standardized to six pups. The pups were weaned at postnatal day 21. At weaning, the mice were anesthetized with chloral hydrate and killed. Blood samples were taken from the intraorbital retrobulbar plexus after a 10-h fast in the anesthetized mice. After clotting, the serum was obtained by centrifugation at 4,000 g for 5 min in a microcentrifuge at room temperature and stored at −80°C. The liver samples were quickly removed, snap frozen in dry ice and stored at −80°C for further analyses. The samples for microscopic evaluation were fixed in paraformaldehyde for hematoxylin–eosin staining. In the experiments, 12 mice per group were analyzed, and the mice were derived from three different dams on average.
Measurement of Birthweight, Bodyweight and Bodylength
The mean litter weights were used to compare the birthweights between the NCD and LPD groups, because the actual number of newborn pups was very large and to minimize the effect of within-litter differences. The bodyweights and bodylengths of the pups were measured from birth to weaning twice per week. The bodylength was calculated by adding the crown–rump length and the tail length. After the mice were anesthetized, the crown–rump length was measured from the tip of the nose to the end of the fur line on the tail. The tail length was measured from the end of the fur growth to the tip of the tail, as described previously13.
Intraperitoneal Glucose Tolerance Tests
Glucose tolerance tests were carried out on the low-protein and control offspring at 3 weeks-of-age. The mice were fasted for 10-h and were weighed. Then, a glucose (2 mg/g bodyweight) load was given intraperitoneally. Before (0 min) and at the indicated time-points (30, 60 and 120 min) after injection, the blood glucose (BG) concentrations were measured in the blood collected by tail tip bleeding with a Contour TS glucometer (Bayer, Beijing, China). The area under the curve (AUC) of the intraperitoneal glucose tolerance test (IPGTT) was calculated by the trapezoid formula: AUC = 0.5 × (BG0 + BG30)/2 + 0.5 × (BG30 + BG60)/2 + 1 × (BG60 + BG120)/2, as previously described14.
Serum and Hepatic Biochemistry Analyses
Serum insulin concentrations were determined using the Mouse Ultrasensitive Insulin ELISA kit from ALPCO Diagnostics (80-INSMSU-E01; Salem, NH, USA). Insulin sensitivity was assessed using the homeostasis model assessment of insulin resistance (HOMA-IR), which was calculated as the fasting insulin concentration (μU/mL) × fasting glucose concentration (mmol/L)/22.515. The serum and hepatic lipid levels were measured using a colorimetric cholesterol quantitation kit (K603-100; Biovision Inc., Mountain View, CA, USA) and a colorimetric triacylglycerol quantitation kit (K622-100; Biovision Inc., Mountain View, CA, USA) according to the manufacturer's protocol16,17.
Histological Examination of the Liver
The liver specimens were fixed in 10% formalin for at least 24 h, and then embedded in paraffin in preparation for sectioning. Serial sections of 7-μm thickness were obtained using a microtome. Deparaffinized and fixed sections were stained with hematoxylin–eosin. Microscopic examinations were carried out on each stained liver section in each group.
Preparation of Total Ribonucleic Acid
Total ribonucleic acid (RNA) was extracted from frozen liver tissues with TRIzol reagent (Life Technologies Inc., Carlsbad, CA, USA) according to the manufacturer's instructions. The quality and concentration of the RNA were determined on a Nanodrop (ND-1000; NanoDrop Products, Wilmington, DE, USA) with RNA concentration >100.0 ng/μL and the ratio of OD260/280 = ∽2.0. The RNA samples were immediately frozen and stored at −80°C for further analyses.
Gene Array Experiments
Gene expression profiles in the liver tissues from the offspring mice were determined by whole genome-wide gene expression array analyses. Because of financial constraints, we could not perform a whole genome array for each biological replicate. Each group contained three biological replicates, which can provide a relatively reliable estimate of the mean gene expression for each group. Then, the samples were processed following Affymetrix recommendations, and the complementary deoxyribonucleid acid (cDNA) was hybridized to the Affymetrix Mouse Gene ST 1.0 array. Both the background correction and normalization were carried out using a probe logarithmic intensity error algorithm. The t-test was used for preprocessing and statistical analyses. The fold change and P-value were used to determine the probe sets that showed significant differential expression between the experimental conditions. Specifically, the probes with a fold change >1.5 and a significant difference (P < 0.05) were chosen for further analyses.
Bioinformatic Analyses of Gene Array Data
Subsequently, the signals of the liver tissues from the LPD and NCD offspring were averaged, and comparisons of the expression pattern changes were carried out between the two groups. The fold changes were calculated based on the average values from each group. Differentially expressed genes were hierarchically clustered using the gplots R package (Wirtschaftsuniversität Wien, Vienna, Austria). According to the instructions of the Affymetrix platform, we established the following two criteria to identify the differentially expressed genes: (i) detection P-value <0.05 in both of the two sample groups; and (ii) fold change >1.5. To identify the biological meaning of the group of genes with changed expression, the subset of genes that met the aforementioned criteria was analyzed with the Gene Ontology classification system and the Kyoto Encyclopedia of Genes and Genomes pathways using the web-based tool, WebGestalt: update 2013 (WEB-based GEne SeT Analyses Toolkit:update2013; http://bioinfo.vanderbilt.edu/webgestalt/). The overrepresentation of genes with altered expression within specific Gene Ontology categories was determined through a hypergeometric test.
Measurement of Messenger RNA Expression Using Real-Time Polymerase Chain Reaction
For validation of the gene array results, four genes from the differentially expressed gene list were selected for quantitative real-time polymerase chain reaction (qRT–PCR) analyses by expanding the quantity samples. Furthermore, the genes expression of the peroxisome proliferator-activated receptor (PPAR) isoforms α, δ and γ were also examined, because PPAR isoforms indeed play important roles in the PPAR pathway, and they are shown to be regulated by a maternal LPD in offspring at later time-points (n = 12 per group). Before PCR, each total RNA was processed with Rnase-free Dnase (Qiagen, New York, NY, USA). RNA was reverse transcribed by 1 μg of total RNA from each sample using the Power cDNA Synthesis kit (A3500; Promega BioSciences LLC, Sunnyvale, CA, USA). The cDNA (2 μL) was amplified with the SYBR® Green PCR Master Mix (RR420A; Takara Bio Inc., Otsu, Japan) in a final volume of 20 μL. We used oligo 7.0 software (Molecular Biology Insights Inc., Cascade, CO, USA) to design the sequences of the primers, which were purchased from Applied Biosystems (Grand Island, NY, USA). The reaction production was accurately measured in the exponential phase of amplification by the ABI prism Vii7 Sequence Detection System (ABI Prism® Vii7; Applied Biosystems, Life Technologies). The reaction conditions consisted of an initial activation step (30 s at 95°C) and a cycling step (denaturation for 5 s at 95°C and annealing for 34 s at 60°C for 40 cycles). All reactions were carried out with three biological replicates, and each analysis consisted of three technical replicates. A melting curve analyses was carried out after each run, and we used agarose gel electrophoresis to confirm the amplicon size and reaction specificity. The sequences of the primers used are listed in Table1. The results were standardized against the reference (housekeeping) β-actin gene, and the relative expression levels were quantified by the  method, with the relative fold changes normalized to the control values18.
Table 1.
Oligonucleotide sequences for the quantitative real-time polymerase chain reaction analyses
| Gene symbol | Forward primer | Reverse primer |
|---|---|---|
| β-actin | TGTTACCAACTGGGACGACA | GGGGTGTTGAAGGTCTCAAA |
| Aqp7 | CTCGTGATAGGCATCCTTGT | AGCCAGCAATGAAAGTGAAC |
| Cpt1b | TATTACCGCATGGAGACATT | TTAGTTGCCCACCATGACTT |
| Lpl | TGCCTGAGTTGTAGAAAGAA | CTTTGTAGGGCATCTGAGAG |
| Cyp7a1 | TTCAAGACCGCACATAAAGC | CGTTGAGAAACATGCGTAGA |
| PPARα | CTGTCCGCCACTTCGAGTC | GATACGCCCAAATGCACCAC |
| PPARΔ | TCACCAGCAGCCTAAAAGCA | CCGGCGAGAAGAAAGGAAGT |
| PPARγ | CGGGCTGAGAAGTCACGTT | TGCGAGTGGTCTTCCATCAC |
Aqp7, aquaporin 7; Cpt1b, carnitine palmitoyltransferase 1b; Lpl, lipoprotein lipase; Cyp7a1, cytochrome P450, family 7, subfamily a, polypeptide 1; PPAR-α, peroxisome proliferator activator receptor alpha; PPAR-Δ, peroxisome proliferator activator receptor delta; PPAR-γ, peroxisome proliferator activator receptor gamma.
Statistical Analysis
The data were expressed as the mean ± standard deviation. Statistical analyses were carried out with Student's t-test between the two groups and two-way anova was used to compare the glucose levels of IPGTT. A P-value <0.05 was considered statistically significant. All statistical analyses were calculated with spss 15.0 (SPSS, Inc., Chicago, IL, USA).
Results
Maternal LPD Altered Birthweight, Bodyweight and Bodylength
The offspring of the dams fed a LPD had a lower birthweight compared with the dams fed a control diet (P < 0.05, Figure1a). After 3 weeks, the bodyweights and bodylengths of the offspring were significantly lower compared with the offspring of dams fed the NCD at weaning (P < 0.001; Figure1b,c). The offspring of the LPD group also showed lower epigonadal white adipose tissue (eWAT) than the NCD group (P < 0.05; Figure1d). During this period, the calorie intake and food consumption of the dams was not significantly different between the LPD and NCD groups (P > 0.05; Figure1e).
Figure 1.

(a) Birthweight, (b) bodyweight, (c) body length, (d) epigonadal white adipose tissue (eWAT) and (e) food intake of the offspring at weaning. All values are the mean ± standard error of the mean (n = 12 mice/group). *P < 0.05 vs normal chow diet (NCD), ***P < 0.001 vs NCD assessed by Student's t-test. LPD, low-protein diet.
Maternal LPD Impaired Glucose Tolerance and Decreased Insulin Sensitivity
The blood glucose levels of the offspring of the dams fed a high-fat diet at weaning were higher at 0 min (P < 0.05), 60 min (P < 0.05) and 120 min (P < 0.05) after intraperitoneal glucose administration compared with the NCD group (Figure2a). The AUC was consistently larger for the LPD group compared with the NCD group (P < 0.05; Figure2b). To determine whether the LPD suppressed insulin sensitivity in the offspring, the levels of fasting blood glucose (FBG) and serum insulin were determined. The FBG was higher for the LPD group (P < 0.05; Figure3a), and there were no significant differences between the two groups (Figure3b). The HOMA-IR was significantly higher in the offspring of the dams fed the LPD compared with the NCD group at weaning (P < 0.05; Figure3c).
Figure 2.
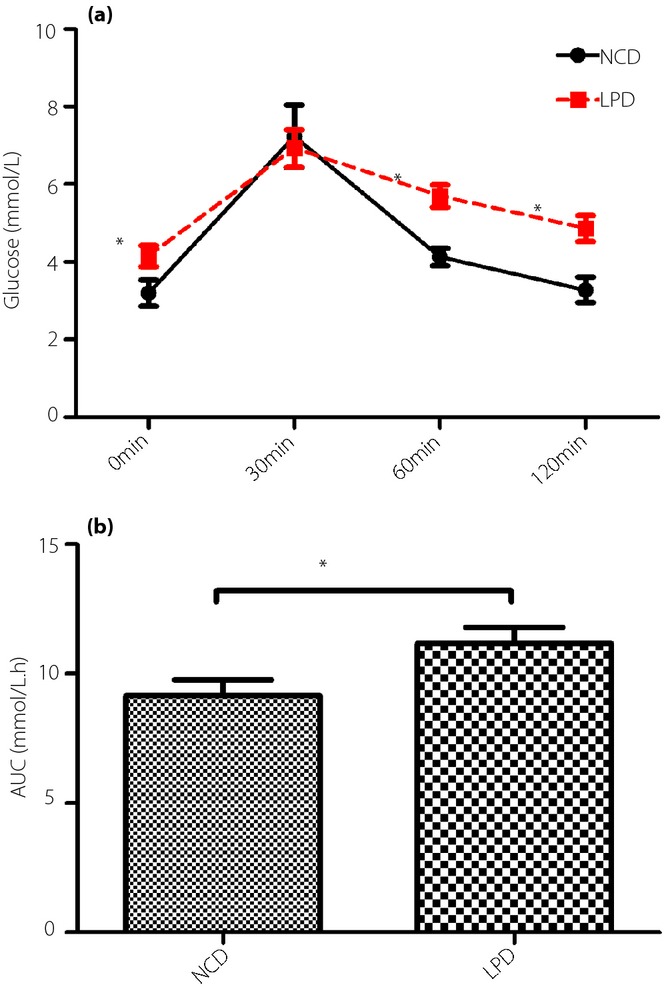
(a) Intraperitoneal glucose tolerance test (IPGTT) and (b) area under the curve (AUC) of the offspring at weaning. All values are the mean ± standard error of the mean (n = 12 mice/group). *P < 0.01 vs normal chow diet (NCD) assessed by Student's t-test and two-way anova. LPD, low-protein diet.
Figure 3.
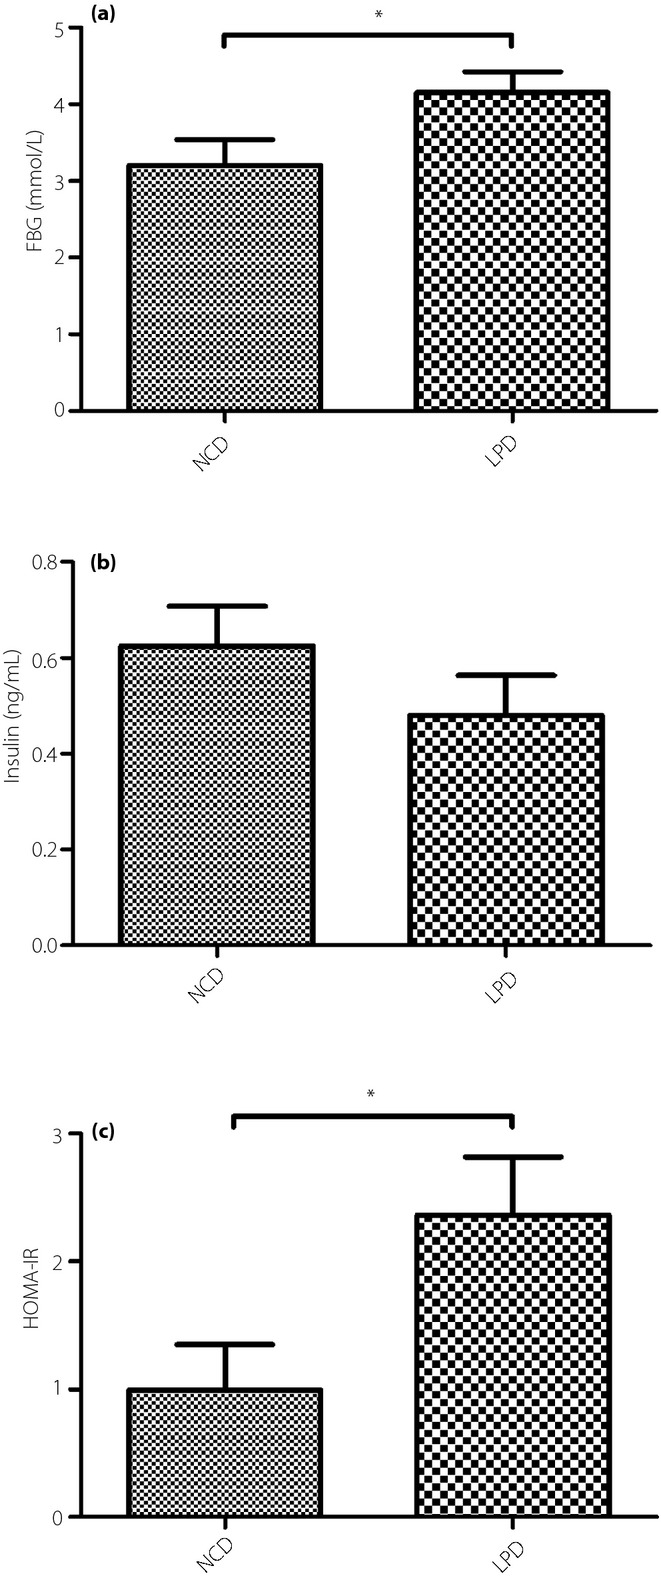
(a) Fasting blood glucose, (b) serum insulin levels (c) and homeostasis model assessment of insulin resistance (HOMA-IR) of the offspring at weaning. All values are the mean ± standard error of the mean (n = 12 mice/group). *P < 0.05 vs normal chow diet (NCD) assessed by Student's t-test. FBG, fasting blood glucose; LPD, low-protein diet.
Maternal LPD Decreased Total Serum Cholesterol Levels
We determined that the total cholesterol was decreased in the offspring of the dams fed the LPD compared with the NCD during pregnancy and lactation (P < 0.05; Figure4a). However, no significant differences in serum triacylglycerol were observed between the two groups (Figure4b). The hepatic cholesterol and triacylglycerol levels showed no significant differences between the two groups (data not shown).
Figure 4.
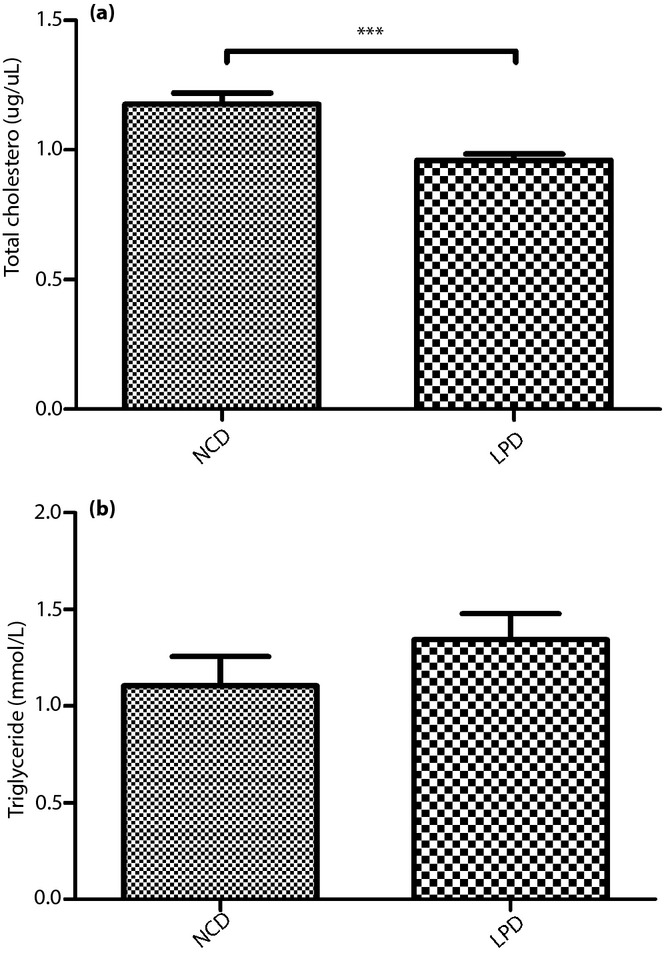
(a) Serum triacylglycerol and (b) total cholesterol levels of the offspring at weaning. All values are the mean ± standard error of the mean (n = 12 mice/group). ***P < 0.001 vs normal chow diet (NCD) assessed by Student's t-test. LPD, low-protein diet.
Maternal LPD Showed no Influence on Liver Histology
Histological examination of the liver tissues showed that the offspring of the dams fed the LPD and the NCD both had normal liver structures at weaning (Figure5).
Figure 5.
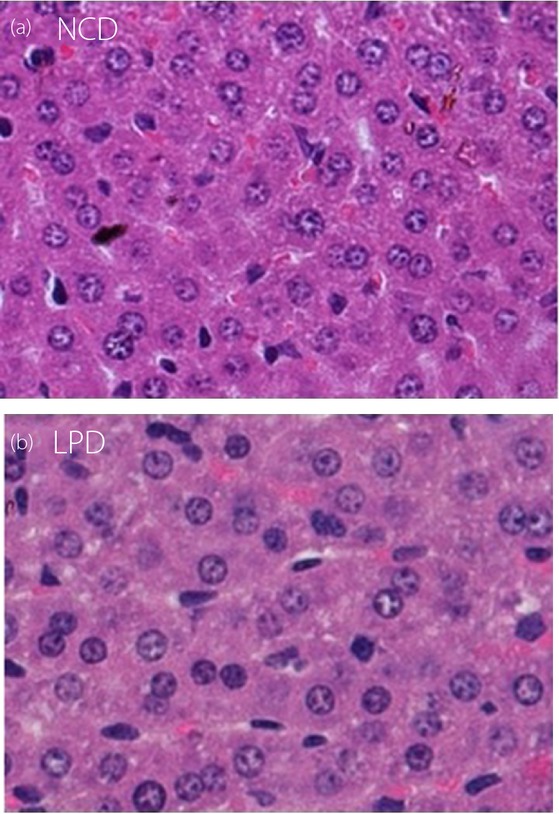
Hematoxylin–eosin staining of liver tissues of the offspring at weaning. Liver histology in offspring at weaning from dams fed (a) normal chow diet (NCD) and (b) low-protein diet (LPD) both had normal liver structure. Original magnification, ×40.
Genes Differentially Regulated by Maternal LPD
A total of 253 genes were differentially expressed between the offspring of the dams fed the LPD and the NCD at weaning. A total of 146 genes (57.7%) were upregulated, and 107 genes (42.8%) were downregulated in the LPD group. Hierarchical clustering based on similarity in gene expression using all differentially expressed genes highlighted the difference in the transcriptional profiles between the LPD and NCD groups (Figure5). WebGestalt analyses of all differentially expressed genes in the LPD group yielded 40 Gene Ontology categories of biological processes (Table2). The WebGestalt annotation tool was used for the identification of the putative Kyoto Encyclopedia of Genes and Genomes pathways. The genes were mapped to 11 pathways (P < 0.05; Table3). The most common type of enriched pathway was related to ‘metabolic pathways’ (P = 1.16E-10). The second and third most abundant pathways were related to the ‘Jak-STAT signaling pathway’ (P = 9.50E-5) and the ‘PPAR signaling pathway’ (P = 0.0036), respectively. Other pathways are shown in Table3. We focused on the ‘PPAR signaling pathway,’ because PPARs have emerged as central regulators of glucose and lipid homeostasis. Four genes in the PPAR signaling pathway, including Aqp7 (aquaporin 7), Cpt1b (carnitine palmitoyltransferase 1b), Lpl (lipoprotein lipase) and Cyp7a1 (cytochrome P450, family 7, subfamily a, polypeptide 1), were significantly differentially expressed on the gene array. The expression ratios are presented as the log2 (fold change; Figure6).
Table 2.
Gene ontology (biological process) of differentially expressed genes between the two groups
| GO classification | GO term | GO ID | C | O | E | R | rawP | adjP |
|---|---|---|---|---|---|---|---|---|
| Biological process | Sterol metabolic process | GO:0016125 | 107 | 12 | 1.07 | 11.2 | 8.29E-10 | 1.06E-06 |
| Cholesterol metabolic process | GO:0008203 | 100 | 11 | 1 | 10.98 | 5.24E-09 | 3.35E-06 | |
| Steroid metabolic process | GO:0008202 | 238 | 14 | 2.38 | 5.87 | 1.40E-07 | 5.96E-05 | |
| Regulation of immune system process | GO:0002682 | 695 | 23 | 6.96 | 3.3 | 5.97E-07 | 0.0002 | |
| Lipid metabolic process | GO:0006629 | 944 | 27 | 9.46 | 2.86 | 1.03E-06 | 0.0003 | |
| Alcohol metabolic process | GO:0006066 | 254 | 13 | 2.54 | 5.11 | 1.89E-06 | 0.0004 | |
| Monocarboxylic acid metabolic process | GO:0032787 | 367 | 15 | 3.68 | 4.08 | 4.94E-06 | 0.0008 | |
| Sterol biosynthetic process | GO:0016126 | 43 | 6 | 0.43 | 13.93 | 4.24E-06 | 0.0008 | |
| Oxidation-reduction process | GO:0055114 | 919 | 25 | 9.21 | 2.72 | 6.38E-06 | 0.0009 | |
| Single-organism biosynthetic process | GO:0044711 | 385 | 15 | 3.86 | 3.89 | 8.76E-06 | 0.0011 | |
| Mitotic cell cycle | GO:0000278 | 542 | 18 | 5.43 | 3.32 | 1.00E-05 | 0.0012 | |
| Oxoacid metabolic process | GO:0043436 | 718 | 21 | 7.19 | 2.92 | 1.25E-05 | 0.0012 | |
| Cytolysis | GO:0019835 | 30 | 5 | 0.3 | 16.64 | 1.12E-05 | 0.0012 | |
| Organic acid metabolic process | GO:0006082 | 732 | 21 | 7.33 | 2.86 | 1.67E-05 | 0.0015 | |
| Carboxylic acid metabolic process | GO:0019752 | 676 | 20 | 6.77 | 2.95 | 1.72E-05 | 0.0015 | |
| Cell cycle | GO:0007049 | 1136 | 27 | 11.38 | 2.37 | 3.00E-05 | 0.0021 | |
| Small molecule biosynthetic process | GO:0044283 | 373 | 14 | 3.74 | 3.75 | 2.64E-05 | 0.0021 | |
| Lipid biosynthetic process | GO:0008610 | 428 | 15 | 4.29 | 3.5 | 3.02E-05 | 0.0021 | |
| Cholesterol biosynthetic process | GO:0006695 | 37 | 5 | 0.37 | 13.49 | 3.25E-05 | 0.0022 | |
| Steroid biosynthetic process | GO:0006694 | 125 | 8 | 1.25 | 6.39 | 3.87E-05 | 0.0025 | |
| Regulation of lipid biosynthetic process | GO:0046890 | 96 | 7 | 0.96 | 7.28 | 5.18E-05 | 0.0031 | |
| Triglyceride metabolic process | GO:0006641 | 69 | 6 | 0.69 | 8.68 | 6.71E-05 | 0.0039 | |
| Small molecule metabolic process | GO:0044281 | 1824 | 36 | 18.27 | 1.97 | 7.08E-05 | 0.0039 | |
| Triglyceride biosynthetic process | GO:0019432 | 23 | 4 | 0.23 | 17.36 | 7.49E-05 | 0.004 | |
| Immune system process | GO:0002376 | 1353 | 29 | 13.55 | 2.14 | 9.52E-05 | 0.0041 | |
| Neutral lipid biosynthetic process | GO:0046460 | 26 | 4 | 0.26 | 15.36 | 0.0001 | 0.0041 | |
| Acylglycerol metabolic process | GO:0006639 | 79 | 6 | 0.79 | 7.58 | 0.0001 | 0.0041 | |
| Complement activation, alternative pathway | GO:0006957 | 10 | 3 | 0.1 | 29.95 | 0.0001 | 0.0041 | |
| Acylglycerol biosynthetic process | GO:0046463 | 26 | 4 | 0.26 | 15.36 | 0.0001 | 0.0041 | |
| Alcohol biosynthetic process | GO:0046165 | 109 | 7 | 1.09 | 6.41 | 0.0001 | 0.0041 | |
| Cellular lipid metabolic process | GO:0044255 | 667 | 18 | 6.68 | 2.69 | 0.0001 | 0.0041 | |
| Neutral lipid metabolic process | GO:0006638 | 81 | 6 | 0.81 | 7.39 | 0.0002 | 0.0075 | |
| Cell cycle phase | GO:0022403 | 617 | 17 | 6.18 | 2.75 | 0.0002 | 0.0075 | |
| Positive regulation of immune system process | GO:0002684 | 440 | 14 | 4.41 | 3.18 | 0.0002 | 0.0075 | |
| Retinoic acid catabolic process | GO:0034653 | 3 | 2 | 0.03 | 66.55 | 0.0003 | 0.0101 | |
| Saturated monocarboxylic acid metabolic process | GO:0032788 | 3 | 2 | 0.03 | 66.55 | 0.0003 | 0.0101 | |
| Unsaturated monocarboxylic acid metabolic process | GO:0032789 | 3 | 2 | 0.03 | 66.55 | 0.0003 | 0.0101 | |
| Diterpenoid catabolic process | GO:0016103 | 3 | 2 | 0.03 | 66.55 | 0.0003 | 0.0101 | |
| Death | GO:0016265 | 1475 | 29 | 14.78 | 1.96 | 0.0004 | 0.0122 | |
| Myeloid leukocyte differentiation | GO:0002573 | 131 | 7 | 1.31 | 5.33 | 0.0004 | 0.0122 |
Fold change >1.5, P < 0.05. adjP, P-value adjusted by the multiple test adjustment; C, the number of reference genes in the category; GO, Gene Ontology, O, the number of genes in the gene set and category; E, the expected number in the category; R, ratio of enrichment; rawP, P-value from hypergeometric test.
Table 3.
Kyoto Encyclopedia of Genes and Genomes pathways with differentially expressed genes between the two groups
| KEGG ID | Pathway name | Gene symbols | C | O | E | R | rawP | adjP |
|---|---|---|---|---|---|---|---|---|
| 01100 | Metabolic pathways | Idi1, Ido2, Chkb, Cyp51, Nsdhl, Cyp2c54, Sds, Nans, Ces3b, Cyp7a1, Asns, Pnliprp1, Sc4 mol, Nnmt, Fdps, Cryl1, Sqle, Ggt6, Cyp2c38, Ces3a, Hsd3b5, Ccbl1, Agpat9, Bdh2, Ldhb, Acss3, Acmsd, Cyp2u1 | 1184 | 28 | 5.4 | 5.18 | 1.78E-12 | 1.16E-10 |
| 04630 | Jak-STAT signaling pathway | Lepr, Socs2, Irf9, Myc, Pim1, Ccnd1, Cish | 153 | 7 | 0.7 | 10 | 7.31E-06 | 9.50E-05 |
| 03320 | PPAR signaling pathway | Cyp7a1, Aqp7, Lpl, Cpt1b | 80 | 4 | 0.4 | 11 | 0.0005 | 0.0036 |
| 00590 | Arachidonic acid metabolism | Cyp2c54, Cyp2c38, Ggt6, Cyp2u1 | 90 | 4 | 0.4 | 9.74 | 0.0008 | 0.0047 |
| 00561 | Glycerolipid metabolism | Agpat9, Lpl, Pnliprp1 | 51 | 3 | 0.2 | 12.9 | 0.0017 | 0.0069 |
| 00564 | Glycerophospholipid metabolism | Agpat9, Chkb, Gpd2 | 80 | 3 | 0.4 | 8.22 | 0.006 | 0.015 |
| 01040 | Biosynthesis of unsaturated fatty acids | Acot4, Acot3 | 25 | 2 | 0.1 | 17.5 | 0.0058 | 0.015 |
| 04950 | Maturity onset diabetes of the young | Hhex, Hes1 | 26 | 2 | 0.1 | 16.9 | 0.0063 | 0.0152 |
| 04975 | Fat digestion and absorption | Pnliprp1, Apoa4 | 45 | 2 | 0.2 | 9.74 | 0.018 | 0.0355 |
| 00591 | Linoleic acid metabolism | Cyp2c54, Cyp2c38 | 46 | 2 | 0.2 | 9.53 | 0.0188 | 0.0359 |
| 00140 | Steroid hormone biosynthesis | Hsd3b5, Cyp7a1 | 55 | 2 | 0.3 | 7.97 | 0.0263 | 0.0442 |
Fold change >1.5, P < 0.05. adjP, P-value adjusted by the multiple test adjustment; C, the number of reference genes in the category; KEGG, Kyoto Encyclopedia of Genes and Genomes; O, the number of genes in the gene set and category; E, the expected number in the category; R, ratio of enrichment; rawP, P-value from hypergeometric test.
Figure 6.
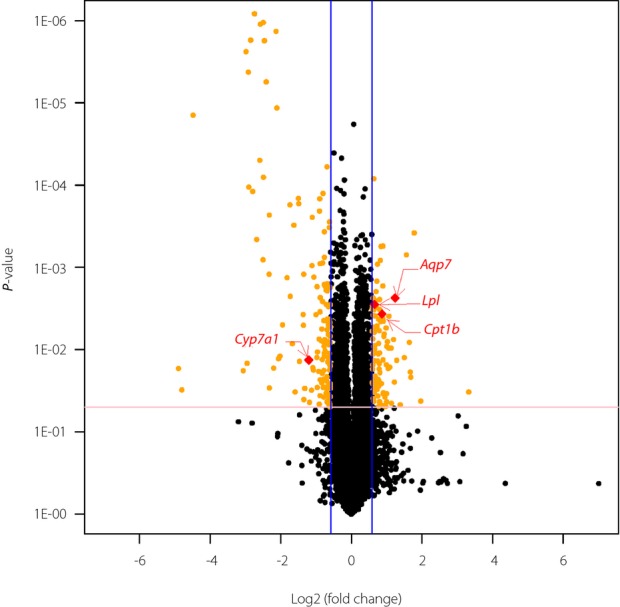
The volcano plot graph of the differentially expressed genes of the offspring from the maternal low-protein diet (LPD) vs normal chow diet (NCD) groups at weaning. The volcano plot graph shows all differentially expressed genes based on the fold change and P-value. The blue lines show that the fold change in the gene expression threshold is 1.5 (log2 fold change = 0.59). The pink line shows that the P-value of the t-test threshold is 0.05. There were four genes located in the peroxisome proliferator-activated receptor signaling pathway. Aqp7, aquaporin 7; Cpt1b, carnitine palmitoyltransferase 1b; Lpl, lipoprotein lipase; Cyp7a1, cytochrome P450, family 7, subfamily a, polypeptide 1.
Hepatic Gene Expression for Validation of Array Analyses
We used qRT–PCR assays to verify a subset of genes included in the array results. Four genes (Aqp7, Cpt1b, Lpl and Cyp7a1) were selected for verification by expanding the quantity samples (n = 12 per group) because of their true positive expression differences in the ‘PPAR signaling pathway,’ which is essential for glucose and lipid metabolism. Aqp7, Cpt1b and Lpl were significantly upregulated, and Cyp7a1 was downregulated in the LPD group. Strong consistency between the array and qRT–PCR results was observed for all four genes, which shows the reliability of our array assays. It was shown that PPAR-γ increased significantly in the LPD group, but PPAR-α was similar between the two groups. The expression of PPAR-δ was very low, which could not even be detected in some samples (Table4).
Table 4.
Fold change of gene expression measured through gene array and validated by quantitative real-time polymerase chain reaction
| Gene symbol | Fold change (gene array) | P-value (gene array) | Fold change (qRT–PCR) | P-value (qRT–PCR) |
|---|---|---|---|---|
| Aqp7 | 2.358 | 0.002353 | 2.6 ± 0.52 | 0.0064* |
| Cpt1b | 1.824 | 0.003674 | 1.7 ± 0.34 | 0.013* |
| Lpl | 1.571 | 0.002817 | 1.6 ± 0.28 | 0.0284* |
| Cyp7a1 | −2.308 | 0.01338 | −2.5 ± 0.16 | 0.026* |
| PPAR-α | 1.12 | 0.2977 | 1.07 ± 0.18 | 0.38 |
| PPAR-γ | 1.403 | 0.062 | 1.48 ± 0.03 | 0.046* |
P < 0.05 vs normal chow diet assessed by Student's t-test. All values are the mean ± standard error of the mean (n = 12 mice/group). Aqp7, aquaporin 7; Cpt1b, carnitine palmitoyltransferase 1b; Lpl, lipoprotein lipase; Cyp7a1, cytochrome P450, family 7, subfamily a, polypeptide 1; PPAR-α, peroxisome proliferator activator receptor alpha; PPAR-γ, peroxisome proliferator activator receptor gamma; qRT–PCR, quantitative real-time polymerase chain reaction.
Discussion
Maternal undernutrition during pregnancy and/or lactation can alter the offspring's responses to environmental challenges, and thus increases the risk of the development of metabolic diseases at a later age19. A systematic review of substantial epidemiological studies and large-scale clinical cohorts showed that birthweight was inversely related to type 2 diabetes risk in most populations studied20,which shows that maternal undernutrition might be more inclined to increase the predisposition to metabolic diseases in adulthood compared with maternal overnutrition. Therefore, studies that examine the effect of maternal undernutrition on offspring are particularly important in light of the increasing awareness of maternal malnutrition, and the concern about the critical periods of gestation and the suckling period.
In the present study, we examined the consequences to the offspring of a maternal LPD regimen during pregnancy and lactation periods in a mouse model. The findings showed that a short-term maternal LPD can contribute to a lower birthweight, lower bodyweight at weaning, impaired glucose tolerance and decreased insulin sensitivity compared with the NCD-fed group. This finding is in contrast with earlier animal experiments, which focused on the consequences for the offspring of long-term maternal LP feeding. However, these studies of the long-term effects of maternal undernutrition were limited to adult rodents8,21. More importantly, studies focused on adults might lose the critical period for early prevention and intervention.
In addition to the body mass and specific markers of glucose metabolism, we also evaluated the lipid metabolism in mice born to mothers given a LPD during pregnancy and lactation. We determined that the total cholesterol was decreased in the offspring of the dams fed LPDs compared with the control group, and there were no significant differences in the serum triacylglycerol between the two groups. The maternal LPD consistently showed no influence on liver histology, and both groups had normal liver structures at weaning. These findings were consistent with a previous study that showed that elevated plasma triglycerides, cholesterol and hepatic steatosis emerged only with aging, but not in the early life of the offspring of the mothers fed a LPD8. Therefore, a maternal LPD regimen throughout pregnancy and lactation can promote early-onset impaired glucose homeostasis, but does not induce aberrant lipid metabolism in the offspring mice. Most studies have shown that a maternal LPD led to both aberrant glucose and lipid metabolism, such as obesity, hypertriglyceridemia, hepatic steatosis, insulin resistance, impaired glucose tolerance and diabetes, in the aging offspring8. Our present study provided the possibility that the occurrence of abnormal glucose metabolism occurs before aberrant lipid metabolism.
In our gene array experiments, the WebGestalt and Kyoto Encyclopedia of Genes and Genomes pathway analyses showed that all differentially expressed genes between the two groups were mapped to 11 pathways. The third most significant pathway was the ‘PPAR signaling pathway,’ and the four differentially expressed genes in this pathway were further validated by qRT–PCR. Furthermore, PPAR isoforms α, δ and γ were also examined, because they are the critical genes in the PPAR signaling pathway. The present study shows for the first time that a maternal LPD restricted to the pregnancy and lactation periods can promote early-onset glucose intolerance in the offspring through the PPAR signaling pathway. In our study, it was shown that PPAR-γ increased significantly in the LPD group. Similarly, one study showed that prenatal exposure to a LPD programs disordered regulation of lipid metabolism and elevated PPAR-γ in the aging rat8. A previous study in rats also showed that a maternal LPD leads to alterations in PPAR gene expression (PPAR-α and PPAR-γ) in the offspring at 18 months-of-age8. Another study showed that hepatic PPAR-α gene expression was significantly higher later in the life of the offspring22. However, these studies only reflected a long-term effect during the life. Therefore, our study shows that PPAR-α and PPAR-γ might play a significant role in the glucose and lipid metabolism in the early life stage of the offspring.
The PPARs are members of the nuclear receptor superfamily of the ligand-inducible transcription factors, which exist in three isoforms, including PPAR-α, PPAR-β/δ and PPAR-γ23. PPARs have emerged as major regulators of carbohydrate and lipid metabolism24. Recently, they have been considered central regulators of glucose and lipid homeostasis, and molecular targets for drugs to treat hypertriglyceridemia and type 2 diabetes mellitus25. Thiazolidinediones (PPAR-γ agonists) are potent insulin sensitizers that are highly effective oral medications for type 2 diabetes26. A recent study showed that maternal diet-induced obesity contributes to metabolism disorders, and bezafibrate (a pan-PPAR agonist) can ameliorate these hepatic metabolic abnormalities27. These findings show that the PPAR signaling pathway could be of vital importance in regulating glucose homeostasis. Furthermore, the PPARs and their ligands have been proposed for the treatment of dyslipidemia, impaired glucose tolerance and type 2 diabetes mellitus25.
In conclusion, our data suggest that a maternal LPD during pregnancy and lactation predisposes the offspring to the development of glucose intolerance and decreased insulin sensitivity in early life. Furthermore, the altered hepatic genes expression in the PPAR signaling pathway could play role in regulating this phenomenon. More importantly, these findings might be utilized as convincing evidence of the early intervention and prevention of some metabolic diseases during the early stage of life. Ultimately, selective and potent PPAR agonists might be useful agents to treat metabolic disorders based on a better understanding of the physiology of the PPAR signaling pathway and the molecular networks.
Acknowledgments
This project was supported by the National Key Program of Clinical Science and the National Natural Science Foundation of China (NSFC), project number 81170736; and National Natural Science Foundation for Young Scholars of China, project number 81300649 The authors declare no conflict of interest.
References
- Hales CN, Barker DJP, Clark PMS, et al. Fetal and infant growth and impaired glucose-tolerance at age 64. BMJ. 1991;303:1019–1022. doi: 10.1136/bmj.303.6809.1019. [DOI] [PMC free article] [PubMed] [Google Scholar]
- Lucas A, Fewtrell MS, Cole TJ. Fetal origins of adult disease-the hypothesis revisited. BMJ. 1999;319:245–249. doi: 10.1136/bmj.319.7204.245. [DOI] [PMC free article] [PubMed] [Google Scholar]
- Painter RC, Roseboom TJ, Bleker OP. Prenatal exposure to the Dutch famine and disease in later life: an overview. Reprod Toxicol. 2005;20:345–352. doi: 10.1016/j.reprotox.2005.04.005. [DOI] [PubMed] [Google Scholar]
- Curhan GC, Willett WC, Rimm EB, et al. Birth weight and adult hypertension, diabetes mellitus, and obesity in US men. Circulation. 1996;94:3246–3250. doi: 10.1161/01.cir.94.12.3246. [DOI] [PubMed] [Google Scholar]
- Xiao X, Zhang ZX, Li WH, et al. Low birth weight is associated with components of the metabolic syndrome. Metab, Clin Exp. 2010;59:1282–1286. doi: 10.1016/j.metabol.2009.12.001. [DOI] [PMC free article] [PubMed] [Google Scholar]
- Xiao X, Zhang ZX, Cohen HJ, et al. Evidence of a relationship between infant birth weight and later diabetes and impaired glucose regulation in a Chinese population. Diabetes Care. 2008;31:483–487. doi: 10.2337/dc07-1130. [DOI] [PubMed] [Google Scholar]
- Jousse C, Parry L, Lambert-Langlais S, et al. Perinatal undernutrition affects the methylation and expression of the leptin gene in adults: implication for the understanding of metabolic syndrome. FASEB J. 2011;25:3271–3278. doi: 10.1096/fj.11-181792. [DOI] [PubMed] [Google Scholar]
- Erhuma A, Salter AM, Sculley DV, et al. Prenatal exposure to a low-protein diet programs disordered regulation of lipid metabolism in the aging rat. Am J Physiol Endocrinol Metab. 2007;292:E1702–E1714. doi: 10.1152/ajpendo.00605.2006. [DOI] [PMC free article] [PubMed] [Google Scholar]
- Watkins AJ, Ursell E, Panton R, et al. Adaptive responses by mouse early embryos to maternal diet protect fetal growth but predispose to adult onset disease. Biol Reprod. 2008;78:299–306. doi: 10.1095/biolreprod.107.064220. [DOI] [PubMed] [Google Scholar]
- van Straten EM, Bloks VW, van Dijk TH, et al. Sex-dependent programming of glucose and fatty acid metabolism in mouse offspring by maternal protein restriction. Gend Med. 2012;9:166–179. doi: 10.1016/j.genm.2012.01.004. e13. [DOI] [PubMed] [Google Scholar]
- Sellayah D, Dib L, Anthony FW, et al. Effect of maternal protein restriction during pregnancy and postweaning high-fat feeding on diet-induced thermogenesis in adult mouse offspring. Eur J Nutr. 2014;53:1523–1531. doi: 10.1007/s00394-014-0657-4. [DOI] [PubMed] [Google Scholar]
- Fernandez-Twinn DS, Ozanne SE, Ekizoglou S, et al. The maternal endocrine environment in the low-protein model of intra-uterine growth restriction. Br J Nutr. 2003;90:815–822. doi: 10.1079/bjn2003967. [DOI] [PubMed] [Google Scholar]
- Lin SY, Craythorn RG, O'Connor AE, et al. Female infertility and disrupted angiogenesis are actions of specific follistatin isoforms. Mol Endocrinol. 2008;22:415–429. doi: 10.1210/me.2006-0529. [DOI] [PMC free article] [PubMed] [Google Scholar]
- Purves RD. Optimum numerical integration methods for estimation of area-under-the-curve (AUC) and area-under-the-moment-curve (AUMC) J Pharmacokinet Biopharm. 1992;20:211–226. doi: 10.1007/BF01062525. [DOI] [PubMed] [Google Scholar]
- Matthews DR, Hosker JP, Rudenski AS, et al. Homeostasis model assessment: insulin resistance and beta-cell function from fasting plasma glucose and insulin concentrations in man. Diabetologia. 1985;28:412–419. doi: 10.1007/BF00280883. [DOI] [PubMed] [Google Scholar]
- Yu YH, Wang PH, Cheng WT, et al. Porcine peroxisome proliferator-activated receptor delta mediates the lipolytic effects of dietary fish oil to reduce body fat deposition. J Anim Sci. 2010;88:2009–2018. doi: 10.2527/jas.2009-2597. [DOI] [PubMed] [Google Scholar]
- Johnson KJ, McDowell EN, Viereck MP, et al. Species-specific dibutyl phthalate fetal testis endocrine disruption correlates with inhibition of SREBP2-dependent gene expression pathways. Toxicol Sci. 2011;120:460–474. doi: 10.1093/toxsci/kfr020. [DOI] [PMC free article] [PubMed] [Google Scholar]
- Livak KJ, Schmittgen TD. Analysis of relative gene expression data using real-time quantitative PCR and the 2(-Delta Delta C(T)) Method. Methods. 2001;25:402–408. doi: 10.1006/meth.2001.1262. [DOI] [PubMed] [Google Scholar]
- Langley-Evans SC. Intrauterine programming of hypertension in the rat: nutrient interactions. Comp Biochem Physiol A Physiol. 1996;114:327–333. doi: 10.1016/0300-9629(96)00018-7. [DOI] [PubMed] [Google Scholar]
- Whincup PH, Kaye SJ, Owen CG, et al. Birth weight and risk of type 2 diabetes: a systematic review. JAMA. 2008;300:2886–2897. doi: 10.1001/jama.2008.886. [DOI] [PubMed] [Google Scholar]
- Watkins AJ, Sinclair KD. Paternal low protein diet affects adult offspring cardiovascular and metabolic function in mice. Am J Physiol Heart Circ Physiol. 2014;306:H1444–1452. doi: 10.1152/ajpheart.00981.2013. [DOI] [PubMed] [Google Scholar]
- Burdge GC, Slater-Jefferies J, Torrens C, et al. Dietary protein restriction of pregnant rats in the F0 generation induces altered methylation of hepatic gene promoters in the adult male offspring in the F1 and F2 generations. Br J Nutr. 2007;97:435–439. doi: 10.1017/S0007114507352392. [DOI] [PMC free article] [PubMed] [Google Scholar]
- Feige JN, Gelman L, Michalik L, et al. From molecular action to physiological outputs: peroxisome proliferator-activated receptors are nuclear receptors at the crossroads of key cellular functions. Prog Lipid Res. 2006;45:120–159. doi: 10.1016/j.plipres.2005.12.002. [DOI] [PubMed] [Google Scholar]
- Christodoulides C, Vidal-Puig A. PPARs and adipocyte function. Mol Cell Endocrinol. 2010;318:61–68. doi: 10.1016/j.mce.2009.09.014. [DOI] [PubMed] [Google Scholar]
- Grygiel-Gorniak B. Peroxisome proliferator-activated receptors and their ligands: nutritional and clinical implications – a review. Nutr J. 2014;13:17. doi: 10.1186/1475-2891-13-17. [DOI] [PMC free article] [PubMed] [Google Scholar]
- Krishnaswami A, Ravi-Kumar S, Lewis JM. Thiazolidinediones: a 2010 perspective. Perm J. 2010;14:64–72. doi: 10.7812/tpp/09-052. [DOI] [PMC free article] [PubMed] [Google Scholar]
- Magliano DC, Bargut TC, de Carvalho SN, et al. Peroxisome proliferator-activated receptors-alpha and gamma are targets to treat offspring from maternal diet-induced obesity in mice. PLoS ONE. 2013;8:e64258. doi: 10.1371/journal.pone.0064258. [DOI] [PMC free article] [PubMed] [Google Scholar]