

Abstract
Aims/Introduction
Microalbuminuria is positively related to metabolic syndrome (MetS). Our aim was to investigate whether urinary albumin-to-creatinine ratio (UACR) within the normal range is independently associated with MetS in Chinese community-based patients with type 2 diabetes.
Materials and Methods
A total of 514 participants (206 males and 308 females; mean age 66 years) with UACR less than 3.5 mg/mmol were enrolled from two downtown areas of Shanghai. The participants were stratified into quartiles according to UACR levels. The prevalence of MetS was assessed and compared among the four groups by binary logistic regression.
Results
Compared with participants with UACRs in the first quartile, the other quartiles had a higher prevalence of MetS (65.9%, 74.4% and 81.3%, respectively, P = 0.001) after adjustment for sex and age. After adjusting for potential confounders, participants in the second to the fourth quartile group had a 1.36-, 1.84- and 2.73-fold risk of MetS, respectively, relative to those in the lowest quartile. Furthermore, UACR, whether as quartile groups or as a continuous variable, is an independent predictor of MetS after fully adjusting for other variables.
Conclusions
These results suggest that UACR even within the normal range is independently associated with MetS in Chinese community-based patients with type 2 diabetes mellitus.
Keywords: Metabolic syndrome, Type 2 diabetes mellitus, Urinary-to-albumin creatinine ratio
Introduction
Microalbuminuira, usually used to evaluate chronic kidney disease and diabetic nephropathy, has been recognized as a major risk factor for cardiovascular morbidity and mortality in recent decades1,2. Recently, several studies have reported that albuminuria, even below the microalbuminuria threshold, was independently correlated with cardiovascular events2,3, but some scholars argued that the prognostic significance of normoalbuminura on cardiovascular dieases was lost after adjustment for traditional risk factors4,5, which has made the association of normoalbuminura with cardiovascular diseases become a controversial issue.
Metabolic syndrome (MetS), a disorder of energy utilization and storage, is an independent risk factor of cardiovascular diseases6. The relationship of microalbuninuria with MetS has been investigated in several studies7–9. Recent studies showed that albuminuria within the normal range is positively associated with MetS and several of its related components in hypertensive individuals and diabetic patients10,11. However, the data regarding this association in Chinese individuals is extremely limited.
Therefore, in the present study, we investigated the relationship between albuminuria below the microalbuminuria threshold with MetS in a Chinese community-based population of type 2 diabetes mellitus patients to further verify that the association between albuminuria within the normal range and MetS is a common phenomenon in other populations.
Materials and Methods
Study Participants
We used the data from our previous study, and the study details have been well-described12. In brief, 1,039 Chinese patients diagnosed with type 2 diabetes mellitus were recruited from a random sample of 20 residential areas in two downtown areas of Shanghai, China, between February and July 2004. After excluding those who did not have a physical and laboratory examination (21 participants), two of three UACR tests greater than 3.5 mg/mmol (492 participants) and suffered from kidney disease or other diseases contributing to proteinuria (12 participants), 514 individuals (206 males and 308 females), between the ages of 32 and 88 years (mean age 66 ± 11 years), were enrolled into our present analysis. The study was carried out with pre-approval from the institution review board of the HuaShan Hospital, and all the participants provided written informed consent.
Physical Examination and Laboratory Testing
The physical and laboratory examinations used in the present study have been described previously13. The glomerular filtration rate (eGFR) was assessed by the simplified Modification of Diet in Renal Disease formula: 186.3 × (serum creatinine)−1.154× (age)−0.203 (×0.742 if female)14. The homeostasis model assessment of insulin resistance (HOMA-IR) was calculated as follows: (fasting plasma glucose [mmol/L] × fasting serum insulin [mU/L]) × 22.515. Normoalbuminuria was defined as two of three UACR measurements less than 3.5 mg/mmol within a period of 3 months16.
Definition of MetS
MetS was defined according to the updated National Cholesterol Education Program Adult Treatment Panel III criteria for Asian-Americans17, by the presence of ≥3 items of the following components: (i) waist circumferences ≥90 cm for men or ≥80 cm for women; (ii) triglycerides ≥1.7 mm/L or specific treatment for lipid abnormality; (iii) high-density lipoprotein cholesterol level <1.03 mmol/L for men or <1.30 mmol/L for women or special treatment for lipid abnormality; (iv) blood pressure ≥130/85 mmHg or a history of hypertension; or (v) fasting plasma glucose (FPG) ≥5.6 mmol/L or previously diagnosed type 2 diabetes mellitus.
Statistical Analyses
SPSS 15.0 software (SPSS, Chicago, IL, USA) was used for all statistical analyses. Normally distributed variables were given as the mean ± standard deviation, and one-way ANOVA with least significant difference was utilized to compare differences among the four groups. Skewed variables were expressed as the median (interquartile range), and the Kruskal–Wallis test was applied to examine differences in the four groups. Categorical variables were represented as absolute numbers (percentages) by the χ2-test. Binary logistic regression analysis was carried out to explore the relationship between UACR and MetS. P < 0.05 (two-sided) was considered to be statistically significant.
Results
Participant Characteristics According to UACR Quartiles
The patients were divided into four groups according to the cut-off points of the UACR quartiles. From the lowest quartile to the highest quartile, the range of UACR was ≤1.08, 1.08–1.53, 1.53–2.16 and >2.16 mg/mmol. Table1 shows the basal clinical and laboratory characteristics for both sexes combined based on UACR quartile groups. Age, body mass index, the history of hypertension, systolic blood pressure and diastolic blood pressure gradually increased with the increment of UACR quartiles (all P < 0.05) even after adjustment of age and sex. Significant differences in high-density lipoprotein cholesterol and eGFR were also noticed among UACR quartiles (all P < 0.05). Nevertheless, there was no significance among the four groups for other metabolic risk factors after adjusting age and sex.
Table 1.
Clinical characteristics of the participants
| Variables | 1st Quartile (n = 128) | 2nd Quartile (n = 129) | 3rd Quartile (n = 129) | 4th Quartile (n = 128) | P-value | P-value* |
|---|---|---|---|---|---|---|
| UACR range (mg/mmol) | ≤1.08 | 1.08–1.53 | 1.53–2.16 | >2.16 | ||
| AGE (years) | 62 ± 11 | 65 ± 10 | 67 ± 11 | 68 ± 9 | <0.001 | <0.001 |
| Male, n (%) | 55 (43.0) | 58 (45.0) | 44 (34.1) | 49 (38.3) | 0.282 | 0.282 |
| Duration of diabetes (years)† | 5 (2–9) | 6 (3–10) | 5 (2–10) | 7 (3–11) | 0.019 | 0.260 |
| The history of diabetes, n (%) | 59 (46.1) | 53 (41.1) | 51 (39.5) | 52 (40.6) | 0.719 | 0.973 |
| Self-reported CVD, n (%) | 26 (20.3) | 21 (16.3) | 30 (23.3) | 25 (19.5) | 0.572 | 0.583 |
| Smoking, n (%) | 30 (23.4) | 31 (24.0) | 31 (24.0) | 19 (14.8) | 0.203 | 0.090 |
| Alcohol, n (%) | 10 (7.8) | 20 (15.5) | 17 (13.2) | 18 (14.1) | 0.270 | 0.165 |
| BMI (kg/m2) | 24.09 ± 2.91 | 24.70 ± 3.09 | 24.84 ± 3.39 | 25.06 ± 3.12 | 0.081 | 0.014 |
| Waist circumference (cm)† | 82 (77–88) | 84 (78–90) | 86.6 (78.5–93) | 84 (78–91.8) | 0.026 | 0.060 |
| Hypertension, n (%) | 67 (52.3) | 70 (54.3) | 72 (55.8) | 99 (77.3) | <0.001 | <0.001 |
| SBP (mmHg)† | 130 (115–142) | 140 (120–153) | 140 (130–150) | 140 (132–160) | <0.001 | <0.001 |
| DBP (mmHg)† | 80 (70–90) | 80 (75–90) | 80 (70–90) | 84 (80–90) | <0.001 | <0.001 |
| FPG (mmol/L) | 8.16 ± 2.90 | 8.51 ± 3.24 | 8.77 ± 3.30 | 8.35 ± 2.61 | 0.443 | 0.397 |
| 2 h PPG (mmol/L) | 13.82 ± 5.73 | 13.96 ± 5.40 | 14.17 ± 5.37 | 14.52 ± 5.07 | 0.752 | 0.163 |
| HbA1c (%) | 6.9 ± 1.6 | 7.1 ± 1.7 | 7.1 ± 1.6 | 6.9 ± 1.2 | 0.756 | 0.673 |
| HOMA-IR† | 3.20 (2.07–5.96) | 4.16 (2.39–7.37) | 4.92 (2.58–7.85) | 4.08 (2.43–6.80) | 0.048 | 0.488 |
| Scr (μmol/L) | 66.51 ± 14.72 | 67.07 ± 14.61 | 66.01 ± 16.53 | 65.09 ± 15.37 | 0.762 | 0.376 |
| eGFR (mL/min/1.73 m2) | 98.95 ± 26.57 | 102.36 ± 25.36 | 98.98 ± 26.70 | 101.70 ± 23.54 | 0.594 | 0.026 |
| TC (mmol/L)† | 5.04 ± 0.85 | 5.43 ± 1.03 | 5.19 ± 0.95 | 5.10 ± 1.01 | 0.007 | 0.676 |
| TG (mmol/L) | 1.50 (1.02–2.12) | 1.62 (1.21–2.45) | 1.49 (1.03–1.95) | 1.65 (1.04–2.08) | 0.473 | 0.419 |
| HDL-C (mmol/L)† | 1.2 (1.0–1.5) | 1.2 (1.0–1.5) | 1.2 (1.0–1.55) | 1.2 (1.0–1.4) | 0.449 | 0.046 |
| LDL-C (mmol/L) | 2.87 ± 0.64 | 3.14 ± 0.76 | 2.98 ± 0.78 | 2.90 ± 0.81 | 0.019 | 0.652 |
2 h PPG, 2 h postprandial plasma glucose; BMI, body mass index; DBP, diastolic blood pressure; FPG, fasting plasma glucose; HbA1c, glycated hemoglobin; HDL-C, high-density lipoprotein cholesterol; HOMA-IR, homeostatic model assessment of insulin resistance; LDL-C, low-density lipoprotein cholesterol; SBP, systolic blood pressure; Scr, serum creatinine; Self-reported CVD, self-reported cardiovascular diseases (including stroke and coronary heart disease); TC, total cholesterol; TG, triglyceride; UACR, urine albumin-to-creatinine ratio.
Values are presented as mean ± standard deviation, median with interquartile range or percentages.
P-value: The P-values were not adjusted for age and sex for the trend.
P-value: The *P-values were adjusted by sex and age for the trend
Non-normal distribution of continuous variables.
Prevalence of MetS Among UACR Quartiles
The prevalence of MetS among the quartiles of UACR is shown in Figure1. The prevalence of MetS was different, and successively 57.8%, 65.9%, 74.4% and 81.3% across the quartiles of UACR after adjustments for age and sex (P for trend = 0.001; Figure1a). Strikingly, participants in the third and the highest quartiles showed a significantly higher incidence of MetS vs those in the lowest quartile (P = 0.008 and <0.001, respectively).
Figure 1.
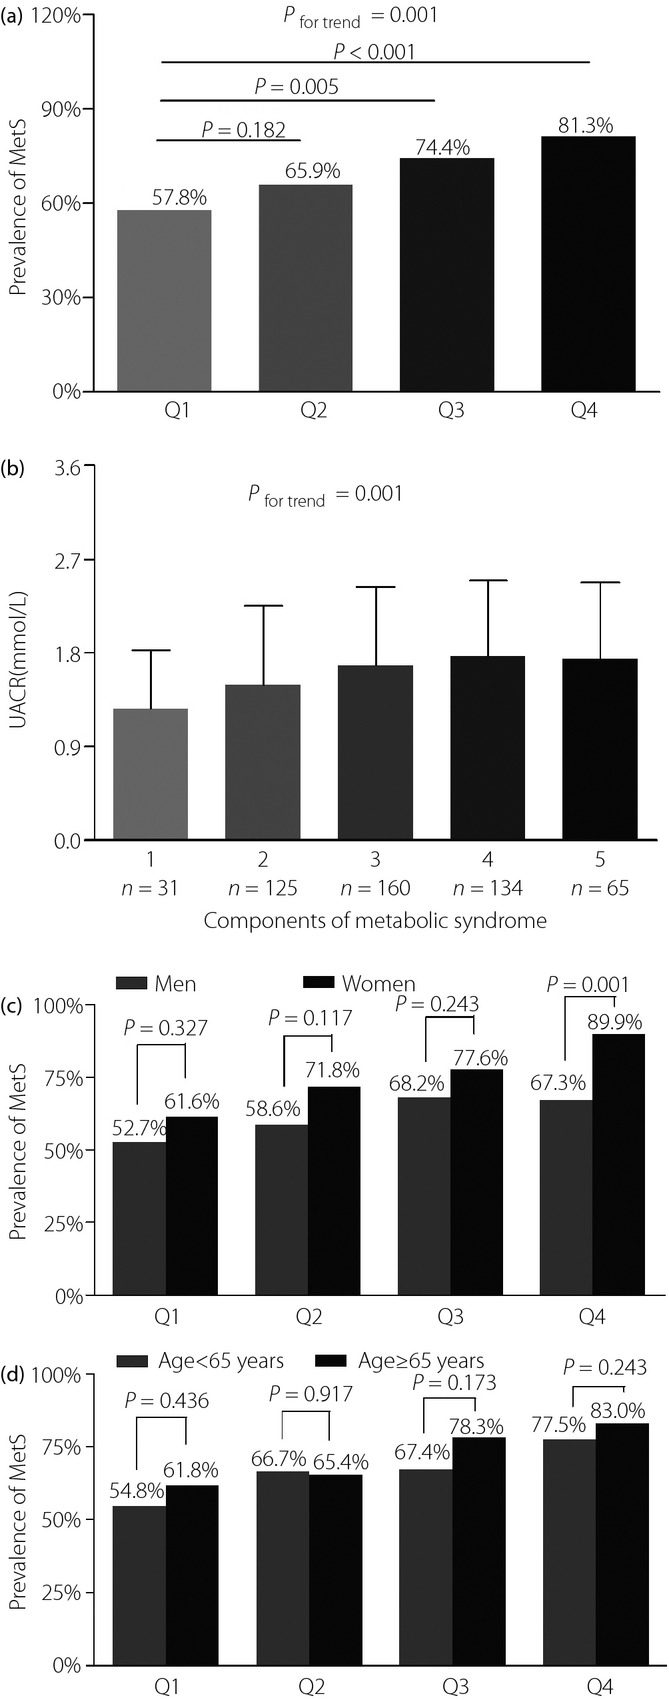
(a) Comparison of the prevalence of metabolic syndrome (MetS) among urinary albumin-to-creatinine ratio (UACR) quartiles. The P-value for four group comparisons was 0.001. (b) Differential UACR level among participants with MetS-related components. P = 0.001 for trend of elevated UACR level with increasing number of MetS-related components. (c) Comparison of the prevalence of MetS stratified by sex among three groups after adjusting for age. The P-value for four group comparisons in men and women was 0.336 and 0.005, respectively. (d) Comparison of the prevalence of MetS stratified by age among the four groups after adjusting for sex. The P-value for the four group comparisons in middle-aged people and old-aged people was 0.131 and 0.014.
The prevalence of MetS was further studied in each quartile group of UACR divided by age or sex. As shown in Figure1c, the prevalence of MetS had a significant sex-related difference in the fourth UACR quartile, rather than the other three quartiles after adjustment for age. In contrast, no remarkable differences were observed between middle-aged (age <65 years) and old-aged (age ≥65 years) patients in each quartile group after adjusting for sex (Figure1d).
Association Between UACR and MetS
Table2 shows the association of UACR according to quartiles and as a continuous variable with MetS. A significant association was shown between the increase of UACR quartiles and MetS after controlling for age, sex, smoking, drinking, duration of diabetes and family history of diabetes (P = 0.001 and P = 0.001, respectively; model I and model II). In model III and model IV, the increased UACR quartiles still remained as a significant predictor for MetS even after controlling other clinical indicators (P = 0.002 and P = 0.008, respectively). Furthermore, compared with the participants in the first UACR quartile, those in the other three quartiles had successively a 1.36-, 1.84- and 2.73-fold risk of MetS after adjustment for various risk factors. Likewise, the UACR value within the normal range was also independently related to MetS from model I to model IV.
Table 2.
Association of urinary albumin-to-creatinine ratio according to quartile groups and as a continuous variable with metabolic syndrome by binary logistic regression
| Quartile groups for UACR, OR (95%CI) | P for trend | UACR as a continuous variable | P-value | |||||
|---|---|---|---|---|---|---|---|---|
| Q1 | Q2 | Q3 | Q4 | OR | 95% CI | |||
| Model I | 1 | 1.44 (0.86–2.40) | 2.03 (1.19–3.47) | 3.14 (1.77–5.57) | 0.001 | 1.717 | 1.303–2.262 | <0.001 |
| Model II | 1 | 1.52 (0.91–2.56) | 2.06 (1.20–3.54) | 3.34 (1.87–5.97) | <0.001 | 1.728 | 1.309–2.282 | <0.001 |
| Model III | 1 | 1.48 (0.88–2.50) | 2.00 (1.15–3.45) | 2.99 (1.67–5.36) | 0.002 | 1.650 | 1.246–2.186 | <0.001 |
| Model IV | 1 | 1.36 (0.80–2.32) | 1.84 (1.05–3.21) | 2.73 (1.50–4.94) | 0.007 | 1.164 | 1.083–1.250 | 0.008 |
CI, confidence interval; OR, odds ratio; UACR, urinary albumin-to-creatinine ratio.
Analyzed using binary logistic regression analysis. Model I, adjusted for age and sex. Model II, adjusted for age, sex, smoking, alcohol, duration of diabetes and family history of diabetes. Model III, adjusted for age, sex, smoking, alcohol, duration of diabetes, family history of diabetes, estimated glomerular filtration rate, glycated hemoglobin and homeostatic model assessment of insulin resistance. Model IV, adjusted for age, sex, smoking, alcohol, duration of diabetes, family history of diabetes, estimated glomerular filtration rate, glycated hemoglobin, homeostatic model assessment of insulin resistance, body mass index and low-density lipoprotein cholesterol.
When all the patients were grouped according to the number of MetS components, a trend in increasing UACR level accompanying increased numbers of MetS-related components was observed (Figure1b). The mean values of UACR for those with one to five components were 1.26, 1.49, 1.68, 1.77 and 1.75 mmol/L, respectively, after adjustment for age, sex, alcohol drinking, smoking, duration of diabetes, self-reported cardiovascular diseases and a family history of diabetes.
Discussion
Our current study found that higher normal UACR was remarkably associated with MetS in Chinese community-based patients with type 2 diabetes mellitus. Furthermore, the normal range of UACR, whether as quartile groups or as a continuous variable, remained a significant predictor of MetS after adjusting for a variety of lifestyle and biochemical risk factors.
A positive relationship of microalbuminuria with the increased incidence of MetS has been well elucidated in hypertensive subjects, type 2 diabetic patients and the general population7–9, but it was not until recently that the association of albuminuria within the normal range with MetS was paid much attention. The Randomized Olmesartan and Diabetes Microalbuminuria Prevention study10 showed that subjects with MetS had remarkably higher albumin excretion rates than subjects without MetS in normoalbuminuric type 2 diabetic patients. Patel et al.18 have also reported that UACR >7 mg/g cold be useful as an associated sign of the presence of MetS in women with polycystic ovary syndrome. Furthermore, significantly higher-normal albuminuria levels were observed by Vyssoulis et al.11 as the number of MetS components rose in 6,650 patients with essential hypertension.
Early identification and prevention is of great magnitude for MetS because of its contribution to the development and progression of cardiovascular diseases19,20. Therefore, we investigated the association between UACR below the microalbuminuria threshold and MetS in community-based patients with type 2 diabetes.
The 69.8% prevalence of MetS in our Chinese community-based patients with type 2 diabetes mellitus was very close to those reported in South Indian (73.3%) and Nepalese (71%) type 2 diabetic patients21,22. In agreement with the present results, Vyssoulis et al.11 and Oh et al.23 also showed that elevated urine albumin excretion within the normal range can reflect an increasing prevalence of MetS in patients with essential hypertension and in the healthy Korean men, respectively. In the present study, women showed a higher prevalence of MetS than men in each UACR quartile, and a significant difference between men and women was shown in the highest UACR quartile. This can be explained by the fact that men did exercise more frequently than women, were prone to a greater intensity level of sports, and being physically active was associated with a lower odds ratio of MetS relative to physically inactive subjects24,25. In addition, higher body mass index, and systolic and diastolic blood pressure might be larger contributors to the significant difference in the fourth UACR quartile rather than the other quartiles26. Different peak incidence in different samples, such as the fourth to fifth decade for a highly endogamous population27 and the seventh decade for Omani adults28, accounted for no sex-adjusted statistical significance between middle-aged and old-aged patients in each UACR quartile, although the prevalence of MetS generally increased with age29.
Consistent with the data from the Shanghai JiaDing study30, we found that the odds ratio of MetS increased steadily across UACR quartiles in patients with type 2 diabetes mellitus. In addition, we found that as a continuous variable, elevated UACR value even below the microalbuminuria threshold was significantly associated with MetS. To our knowledge, this is the first time that the relationship between UACR in the normal range and MetS has been comprehensively investigated based on UACR analyzed by quartiles and as a continuous variable.
The present study had clinical significance, as we found that higher UACR even below the microalbuminuria threshold was remarkably related to MetS, which suggested that UACR might be an important risk factor of MetS, although the relationship of microalbuminuria and MetS has been investigated in several studies7–9. The common underlying mechanisms including renin–angiotensin system activation, resultant oxidant stress, and inflammation between albuminuria and MetS could strongly explain why albuminuria, even within the normal range, remains a strongly independent indicator for MetS31,32. Indeed, the present study also showed that subjects in the higher UACR quartile group had higher levels of systolic blood pressure and diastolic blood pressure, closely associated with renin–angiotensin system activation, compared with subjects in the lower UACR quartile group.
Our findings provide further evidence to support the assumption that UACR, even in the normal range, could predict the occurrence of MetS. However, as a cross-sectional study, there were several limitations we recognized in the present study. First, the number of participants in our study was relatively small. Hence, prospective studies are required in a larger sample to further clarify the relationship between low-grade albuminuria and MetS. Second, we did not investigate medications of the participants, and therefore, we could not eliminate the possible effect of medications for the present findings. Third, the samples we studied in our article were diabetic patients, thus the prevalence of MetS among this sample was indeed higher than that among the general population. In addition, the definition of MetS in diabetic patients was also a little artificial. However, according to the definition of MetS, not all patients with diabetes suffered from MetS, whereas some other patients presented isolated diabetes17. Finally, the higher UACR quartile had a higher percentage of more MetS components, but we tackled with this bias by adjusting relative clinical indicators, such as age, sex, smoking, alcohol, duration of diabetes, family history of diabetes, eGFR, glycated hemoglobin, HOMA-IR, body mass index and low-density lipoprotein. In addition, the fact that higher prevalence could be related to more components in the fourth quartile had also truly reflected the relationship of UACR and MetS. Our data (Table2) also showed that higher UACR was associated with the prevalence of MetS, which suggested that UACR not only exhibited the prevalence of MetS, but also the severity of MetS, if the number of MetS components was used to estimate the severity of MetS.
In conclusion, we found that low-grade albuminuria has a strongly positive correlation with MetS even after controlling for a variety of lifestyle and biochemical risk factors in Chinese community-based patients with type 2 diabetes mellitus. The present results suggested that a UACR in the normal range is a novel marker for MetS. In clinical practice, diabetic patients can make lifestyle modifications and early medical interventions against MetS through early screening the UACR.
Acknowledgments
This work was supported by grants from the National Natural Science Foundation of China (81170759) and Key Discipline of Public Health of Shanghai (Epidemiology) (12GWZX0104). The authors declare no conflict of interest.
References
- Sulikowska B, Manitius J. Proteinuria as a predictor of risk of cardiovascular disease: a new insight. Pol Arch Med Wewn. 2007;117:411–414. [PubMed] [Google Scholar]
- Ninomiya T, Perkovic V, de Galan BE, et al. Albuminuria and kidney function independently predict cardiovascular and renal outcomes in diabetes. J Am Soc Nephrol. 2009;20:1813–1821. doi: 10.1681/ASN.2008121270. [DOI] [PMC free article] [PubMed] [Google Scholar]
- Sung JK, Kim JY, Youn YJ, et al. Urine albumin creatinine ratio is associated with carotid atherosclerosis in a community based cohort: atherosclerosis risk of rural area in Korean general population study. J Cardiovasc Ultrasound. 2010;18:134–138. doi: 10.4250/jcu.2010.18.4.134. [DOI] [PMC free article] [PubMed] [Google Scholar]
- Ishimura E, Taniwaki H, Tsuchida T, et al. Urinary albumin excretion associated with arterial wall stiffness rather than thickness in type 2 diabetic patients. J Nephrol. 2007;20:204–211. [PubMed] [Google Scholar]
- Ito H, Komatsu Y, Mifune M, et al. The estimated GFR, but not the stage of diabetic nephropathy graded by the urinary albumin excretion, is associated with the carotid intima-media thickness in patients with type 2 diabetes mellitus: a cross-sectional study. Cardiovasc Diabetol. 2010;9:18. doi: 10.1186/1475-2840-9-18. [DOI] [PMC free article] [PubMed] [Google Scholar]
- Cabre JJ, Martin F, Costa B, et al. Metabolic syndrome as a cardiovascular disease risk factor: patients evaluated in primary care. BMC Public Health. 2008;8:251. doi: 10.1186/1471-2458-8-251. [DOI] [PMC free article] [PubMed] [Google Scholar]
- Hao Z, Konta T, Takasaki S, et al. The association between microalbuminuria and metabolic syndrome in the general population in Japan: the Takahata study. Intern Med. 2007;46:341–346. doi: 10.2169/internalmedicine.46.6056. [DOI] [PubMed] [Google Scholar]
- Leoncini G, Viazzi F, Agabiti RE, et al. Metabolic syndrome and chronic kidney disease in high-risk Italian hypertensive patients: the I-DEMAND study. J Nephrol. 2012;25:63–74. doi: 10.5301/JN.2011.7752. [DOI] [PubMed] [Google Scholar]
- Esteghamati A, Rashidi A, Khalilzadeh O, et al. Metabolic syndrome is independently associated with microalbuminuria in type 2 diabetes. Acta Diabetol. 2010;47:125–130. doi: 10.1007/s00592-009-0131-6. [DOI] [PubMed] [Google Scholar]
- Ritz E, Viberti GC, Ruilope LM, et al. Determinants of urinary albumin excretion within the normal range in patients with type 2 diabetes: the Randomised Olmesartan and Diabetes Microalbuminuria Prevention (ROADMAP) study. Diabetologia. 2010;53:49–57. doi: 10.1007/s00125-009-1577-3. [DOI] [PMC free article] [PubMed] [Google Scholar]
- Vyssoulis G, Karpanou E, Spanos P, et al. Urine albumin excretion, within normal range, reflects increasing prevalence of metabolic syndrome in patients with essential hypertension. J Clin Hypertens (Greenwich) 2010;12:597–602. doi: 10.1111/j.1751-7176.2010.00306.x. [DOI] [PMC free article] [PubMed] [Google Scholar]
- Lu B, Wen J, Song XY, et al. High prevalence of albuminuria in population-based patients diagnosed with type 2 diabetes in the Shanghai downtown. Diabetes Res Clin Pract. 2007;75:184–192. doi: 10.1016/j.diabres.2006.06.024. [DOI] [PubMed] [Google Scholar]
- Li MF, Tu YF, Li LX, et al. Low-grade albuminuria is associated with early but not late carotid atherosclerotic lesions in community-based patients with type 2 diabetes. Cardiovasc Diabetol. 2013;12:110. doi: 10.1186/1475-2840-12-110. [DOI] [PMC free article] [PubMed] [Google Scholar]
- National Kidney F. K/DOQI clinical practice guidelines for chronic kidney disease: evaluation, classification, and stratification. Am J Kidney Dis. 2002;39:S1–S266. [PubMed] [Google Scholar]
- Matthews DR, Hosker JP, Rudenski AS, et al. Homeostasis model assessment: insulin resistance and beta-cell function from fasting plasma glucose and insulin concentrations in man. Diabetologia. 1985;28:412–419. doi: 10.1007/BF00280883. [DOI] [PubMed] [Google Scholar]
- Molitch ME, DeFronzo RA, Franz MJ, et al. Nephropathy in diabetes. Diabetes Care. 2004;27(Suppl 1):S79–S83. doi: 10.2337/diacare.27.2007.s79. [DOI] [PubMed] [Google Scholar]
- Liu J, Grundy SM, Wang W, et al. Ethnic-specific criteria for the metabolic syndrome: evidence from China. Diabetes Care. 2006;29:1414–1416. doi: 10.2337/dc06-0481. [DOI] [PubMed] [Google Scholar]
- Patel AA, Bloomgarden ZT, Futterweit W. Premicroalbuminuria in women with polycystic ovary syndrome: a metabolic risk marker. Endocr Pract. 2008;14:193–200. doi: 10.4158/EP.14.2.193. [DOI] [PubMed] [Google Scholar]
- Lakka HM, Laaksonen DE, Lakka TA, et al. The metabolic syndrome and total and cardiovascular disease mortality in middle-aged men. JAMA. 2002;288:2709–2716. doi: 10.1001/jama.288.21.2709. [DOI] [PubMed] [Google Scholar]
- Mottillo S, Filion KB, Genest J, et al. The metabolic syndrome and cardiovascular risk a systematic review and meta-analysis. J Am Coll Cardiol. 2010;56:1113–1132. doi: 10.1016/j.jacc.2010.05.034. [DOI] [PubMed] [Google Scholar]
- Raman R, Gupta A, Pal SS, et al. Prevalence of metabolic syndrome and its influence on microvascular complications in the Indian population with type 2 diabetes mellitus. Sankara Nethralaya diabetic retinopathy epidemiology and molecular genetic study (SN-DREAMS, report 14) Diabetol Metab Syndr. 2010;2:67. doi: 10.1186/1758-5996-2-67. [DOI] [PMC free article] [PubMed] [Google Scholar]
- Bhattarai SKS, Sapkota S. Prevalence of metabolic syndrome in type 2 diabetes mellitus patients using NCEP/ATP III and IDF criteria in Nepal. Nepal J Med Sci. 2012;1:78–83. [Google Scholar]
- Oh CM, Park SK, Kim HS, et al. High-normal albuminuria predicts metabolic syndrome in middle-aged Korean men: A prospective cohort study. Maturitas. 2013;77:149–154. doi: 10.1016/j.maturitas.2013.10.013. [DOI] [PubMed] [Google Scholar]
- Cutler D, Glaeser E, Shapiro J. Why have Americans become more obese? J Econ Perspect. 2003;17:93–118. [Google Scholar]
- Zhu S, St-Onge MP, Heshka S, et al. Lifestyle behaviors associated with lower risk of having the metabolic syndrome. Metabolism. 2004;53:1503–1511. doi: 10.1016/j.metabol.2004.04.017. [DOI] [PubMed] [Google Scholar]
- Dallongeville J, Cottel D, Arveiler D, et al. The association of metabolic disorders with the metabolic syndrome is different in men and women. Ann Nutr Metab. 2004;48:43–50. doi: 10.1159/000075304. [DOI] [PubMed] [Google Scholar]
- Bener A, Mohammad AG, Ismail AN, et al. Gender and age-related differences in patients with the metabolic syndrome in a highly endogamous population. Bosn J Basic Med Sci. 2010;10:210–217. doi: 10.17305/bjbms.2010.2687. [DOI] [PMC free article] [PubMed] [Google Scholar]
- Al-Lawati JA, Mohammed AJ, Al-Hinai HQ, et al. Prevalence of the metabolic syndrome among Omani adults. Diabetes Care. 2003;26:1781–1785. doi: 10.2337/diacare.26.6.1781. [DOI] [PubMed] [Google Scholar]
- Ford ES, Giles WH, Mokdad AH. Increasing prevalence of the metabolic syndrome among U.S. Adults. Diabetes Care. 2004;27:2444–2449. doi: 10.2337/diacare.27.10.2444. [DOI] [PubMed] [Google Scholar]
- Zhang J, Chen Y, Xu Y, et al. Low-grade albuminuria is associated with metabolic syndrome and its components in middle-aged and elderly Chinese population. PLoS One. 2013;8:e65597. doi: 10.1371/journal.pone.0065597. [DOI] [PMC free article] [PubMed] [Google Scholar]
- Gobal F, Deshmukh A, Shah S, et al. Triad of metabolic syndrome, chronic kidney disease, and coronary heart disease with a focus on microalbuminuria death by overeating. J Am Coll Cardiol. 2011;57:2303–2308. doi: 10.1016/j.jacc.2011.02.027. [DOI] [PubMed] [Google Scholar]
- Dzau VJ, Safar ME. Large conduit arteries in hypertension: role of the vascular renin-angiotensin system. Circulation. 1988;77:947–954. doi: 10.1161/01.cir.77.5.947. [DOI] [PubMed] [Google Scholar]