

Abstract
Aims/Introduction
Many studies have been carried out to examine the association between sugar-sweetened beverages and the incident of type 2 diabetes, but results are mixed. The aim of the present study was to estimate the association between sugar-sweetened beverage intake and the risk of type 2 diabetes.
Materials and Methods
PubMed, Springer Link and Elsevier databases were searched up to July 2014. Prospective studies published on the association between sugar-sweetened beverage intake and the risk of type 2 diabetes were included. The pooled relative risks (RRs) and 95% confidence intervals (CIs) for highest versus lowest category of sugar-sweetened beverages were estimated using a random-effects model.
Results
The pooled effect estimate of sugar-sweetened beverage intake was 1.30 (95% confidence interval [CI] 1.21–1.39) for type 2 diabetes; stratified by geographic region of the studies, the pooled effect estimates were 1.34 (95% CI 0.74–2.43), 1.30 (95% CI 1.20–1.40), 1.29 (95% CI 1.09–1.53) in Asia, the USA and Europe,respectively; the pooled effect estimates were 1.26 (95% CI 1.16–1.36) with adjusting body mass index and 1.38 (95% CI 1.23–1.56) without adjusting body mass index.
Conclusions
Our findings suggested that sugar-sweetened beverage intake was associated with an increased risk of type 2 diabetes, and the association was attenuated by adjustment for body mass index. Specifically, the associations were also found to be significantly positive in the USA and Europe.
Keywords: Meta-analysis, Sugar-sweetened beverages, Type 2 diabetes
Introduction
Type 2 diabetes mellitus (T2DM), with the rapid increased prevalence worldwide and substantial economic burden, has become a global public health concern1,2. Consequently, it is of great importance to identify related factors to reduce the risk of developing type 2 diabetes. Sugar-sweetened beverages (SSBs), which include the full spectrum of soft drinks, fruit drinks, energy and vitamin water drinks, are popular in Europe and the USA3–5. In recent years, a rapid increase in consumption of these beverages has also been seen in Asian countries, such as India and China6,7. In 2006, Malik et al.8 reported that SSBs are positively associated with weight gain and obesity, the well-established risk factors for type 2 diabetes. A number of prospective cohort studies further showed that consumption of SSBs is significantly associated with an increased risk for type 2 diabetes9–15. In addition, two recent meta-analysis studies carried out by Malik et al.8 and Greenwood et al.16, respectively, both found that individuals with higher intake of SSBs have a greater risk of developing type 2 diabetes. However, some studies included in the former meta-analysis study reported results for all soft drinks combined10,17, without distinguishing between the sugar-sweetened and the artificially-sweetened soft drinks. In addition, the SSBs estimated in the two meta-analysis studies both included fruit juice, which has been reported to be different from SSBs and a healthier drink. Therefore, we carried out the present meta-analysis study to update the evidence of the association between intake of SSBs and the risk of type 2 diabetes with studies excluding artificially-sweetened soft drinks and fruit juice from the SSBs spectrum.
Materials and Methods
Literature Search
Studies that reported on the association of SSBs intake and type 2 diabetes risk were collected. The literature databases including PubMed, Springer Link and Elsevier were searched. The main search terms included ‘sugar-sweetened beverage,’ ‘sugar-sweetened drink,’ ‘soft drink,’ ‘soda,’ ‘soda-pop,’ ‘carbonated drink,’ ‘sugar with beverage,’ ‘type 2 diabetes’ and ‘T2DM.’ Reference lists of articles were reviewed to identify any additional articles. The literature search was limited to the English language. The literature search was updated in July 2014. This systematic review was planned, carried out and reported in adherence to standards of quality for reporting meta-analysis18.
Eligibility Criteria
We selected articles that: (i) examined the association between intake of SSBs and risk of type 2 diabetes; (ii) were original epidemiological studies with prospective design; (iii) reported the relative risks (RRs) or hazard ratios (HRs) with 95% confidence intervals (CIs) for highest versus lowest category of SSBs intake or raw data to calculate these; (iv) reported results with distinguishing sugar and artificial sweeteners; and (v) excluded fruit juice (sugar-sweetened fruit juice and 100% fruit juice) from the SSBs spectrum.
Data Extraction
Relevant information was extracted from eligible studies by the same two authors, with discrepancies resolved by discussion, which included the first author's last name, year of publication, location where the study was carried out, follow-up duration of each study, the age and sex of participants included in studies, exposure assessment methods, diagnosis of type 2 diabetes, RRs or HRs with 95% CI for highest versus lowest category of SSBs intake, adjustment for potential confounders, and study quality. Study quality was assessed by the nine-star Newcastle–Ottawa Scale19, a validated technique for assessing the quality of observational and non-randomized studies. This scale assessed the selection of the study sample (for case–control or cohort studies, maximum of four points), the comparability of the sample groups (maximum of two points) and the ascertainment of outcome (for cohort studies, maximum of three points).
Statistical Analysis
Statistical analysis was carried out with stata version 11.0 software (StataCorp LP, College Station, TX, USA) using command ‘meta’. Heterogeneity was assessed using the Cochran's Q-test20 and the I221. If there was significant heterogeneity (P < 0.05 or I2 > 25%), a random-effects model would be used to assign the weight of each study according to the DerSimonian–Laird method22. If there was evidence of no heterogeneity, we used a fixed-effects model with effect estimates that were given equal weight to the inverse variance of the study. In the main analysis examining the association between intake of SSBs and the risk of type 2 diabetes, a sensitivity analysis was carried out. To explore the sources of heterogeneity, we also carried out the subgroup analysis based on the geographic region of studies and whether the effects of SSBs on type 2 diabetes were adjusted by body mass index (BMI). We tested for publication bias by means of Egger's regression asymmetry test23 and Begg's rank correlation test24 (P < 0.05) with Begg's funnel plot.
Results
Study Characteristics
The detailed steps of our literature selection are shown in Figure1. Briefly, we identified eight studies published between 2004 and 2014 for this meta-analysis. The main information extracted from the studies is shown in Table1. As shown, five prospective studies were carried out in the USA, two in Europe and one in Asia. All studies provided effect estimates with associated 95% CIs. The SSBs exposure information was collected by a diet history questionnaire (DHQ) in one study and a food frequency questionnaire (FFQ) in the other seven studies. Type 2 diabetes was diagnosed mainly by self-report, registry data and laboratory test. The duration of follow up ranged from 5 to 24 years. The quality score of studies ranged from seven stars to eight stars according to the nine-star Newcastle–Ottawa Scale.
Figure 1.
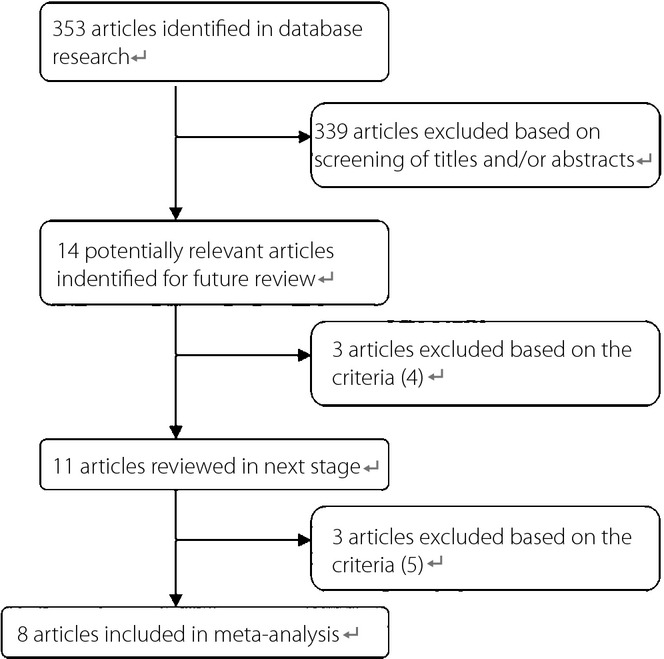
Process of study selection
Table 1.
Characteristics of the studies included in meta-analysis
| Study ID | Location | Follow-up years | Case/total | Age (years) | Sex | Exposure assessment | Diagnosis of type 2 diabetes | RR (95% CI) for highest vs lowest intakes | Adjustment for potential confounders | Study quality |
|---|---|---|---|---|---|---|---|---|---|---|
| Sakurai et al. 201427 | Japan | 7 | 170/2037 | 35–55 | Men | DHQ | Confirmed by annual medical examinations | ≥1 serving/day vs rare or never: 1.34 (0.72–2.36), P for trend: 0.424 | Age, BMI, family history of diabetes, smoking, alcohol drinking, habitual exercise, presence of hypertension, presence of dyslipidemia, receiving the diet treatment for chronic disease, total energy intake, total fiber intake, diet soda, fruit juice vegetable juice, coffee consumption. | 7 |
| Bhupathiraju et al. 201312 | USA | 24 in NHS study and 22 in HPFS study | 7370/74749 in NHS study; 2865/39059 in HPFS study | 30–55, 40–75 in NHS and HPFS study | Men and women | FFQ | Confirmed self-report by questionnaire | NHS study: ≥1 serving/day vs <1 serving/month 1.20 (1.01–1.42), P for trend: 0.05. HPFS study: ≥1 serving/day vs <1 serving/month 1.37 (1.08–1.74) | Age, BMI, family history of diabetes, smoking status, alcohol use, postmenopausal hormone use, physical exercise, Alternate Healthy Eating Index, depending on the model, presence of hypertension, presence of dyslipidemia, total energy intake, adherence to a low-calorie diet, weight gain and weight loss. | 7 |
| Fagherazzi et al. 201313 | France | 14 | 1369/66118 | 53±7 | Women | FFQ | Confirmed by health insurance records and questionnaire | 359 mL/week vs non-consumers: 1.30 (1.02–1.66), P for trend: 0.0206 | Years of education, smoking status, physical activity, hypertension, hypercholesterolemia, use of hormone replacement therapy, family history of diabetes, antidiabetic drugs, alcohol intake, omega-3 fatty acid intake, carbohydrate intake, coffee, fruit and vegetables, and processed-meat consumption, dietary pattern, energy intake, BMI. | 7 |
| The InterAct consortium 201314 | Europe | 6.9 | 11684/15374 | Mean age 55.6 | Men and women | FFQ | Confirmed self-report or registry data | ≥1 glass/day vs <1 glass/month: 1.29 (1.02–1.63), P for trend: 0.013 | Sex, education level, physical activity, smoking status, alcohol consumption, juices, artificially sweetened soft drinks, energy intake, BMI. | 7 |
| de Koning et al. 201115 | USA | 20 | 2680/40389 | 40–75 | Men | FFQ | Confirmed self-report by questionnaire | 4.5 servings/week to 7.5 servings/day vs never: 1.24 (1.09–1.40), P for trend: <0.01 | Multivitamins, family history, high triglycerides, high blood pressure, diuretics, pre-enrolment weight change, dieting, total energy, BMI. | 8 |
| Nettleton et al. 200925 | USA | 5 | 413/5011 | 45–84 | Men and women | FFQ | Self-report, fasting glucose >126 mg/dL or use of hypoglycemic medicine | ≥1 serving/day vs rare or never: 1.40 (1.06–1.84), P for trend: 0.01 | Age, study site, sex, race, energy intake, education, physical activity, smoking status, pack-years, and weekly or more supplement use, waist circumference. | 7 |
| Palmer et al. 200826 | USA | 10 | 2713/43960 | 21–69 | Women | FFQ | Confirmed self-report by a random sample | ≥2 drinks/day vs <1 drink/month: 1.24 (1.06–1.45), P for trend: 0.0002 | Age, family history of diabetes, physical activity, cigarette smoking, years of education, sweetened fruit drinks, orange or grapefruit juice, intake of red meat, processed of meat, cereal fiber, coffee and glycemic index. | 7 |
| Schulze et al. 200411 | USA | 8 | 741/91249 | 24–44 | Women | FFQ | Confirmed self-report by questionnaire | ≥1 drink/day vs <1 drink/month: 1.83 (1.42–2.36), P for trend: <0.01 | Age, alcohol intake, physical activity, family history of diabetes, smoking, postmenopausal hormone use, oral contraceptive use, intake of cereal fiber, magnesium, trans-fat, ratio of polyunsaturated to saturated fat, consumption of sugar. | 7 |
BMI, body mass index; DHQ, diet history questionnaire; FFQ, food frequency questionnaire; HPFS, Health Professionals Follow-Up Stedy; NHS, Nurses' Health Study.
Association Between Intake of SSBs and Risk of Developing Type 2 Diabetes
A total of 286,697 participants, including 29,264 cases affected by type 2 diabetes, were included in this meta-analysis. The pooled results showed that individuals with a higher intake of SSBs had a greater risk of developing type 2 diabetes (RR 1.30, 95% CI 1.21–1.39). A formal test for heterogeneity gave a significant result (I2 = 12.9%) and a fixed-effects model was therefore used (Figure2).
Figure 2.
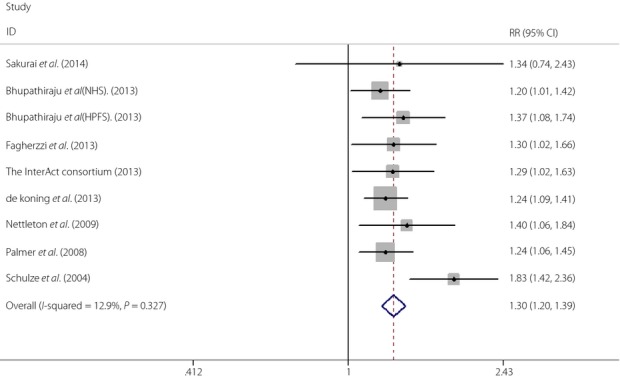
Relative risk (RR) for type 2 diabetes for highest versus lowest intake of sugar-sweetened beverages. CI, confidence interval.
When the subgroup analysis based on the geographic region of studies was carried out, we found that the effects of SSBs intake on type 2 diabetes risk were 1.34 (95% CI 0.742.43), 1.30 (95% CI 1.20–1.40), 1.29 (95% CI 1.09–1.53) in Asia, the USA and Europe. respectively (Figure3). To determine whether the association between SSBs intake and type 2 diabetes risk was modified by BMI, we carried out another subgroup analysis. We found that the effects of SSBs intake on type 2 diabetes were 1.26 (95% CI 1.16–1.36) with adjusting BMI and 1.38 (95% CI 1.23–1.56) without adjusting BMI (Figure4)
Figure 3.
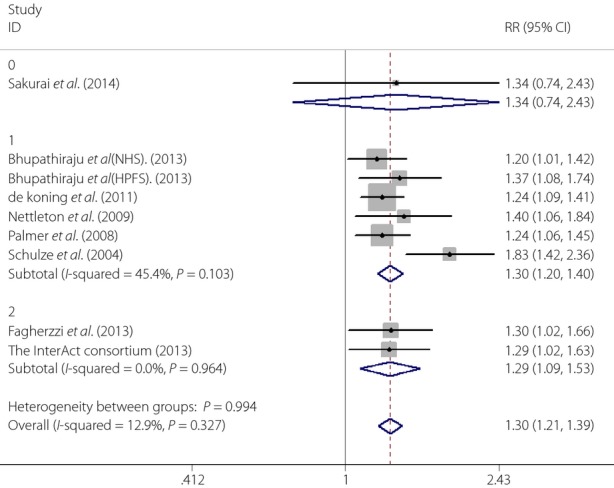
The results of subgroup analysis by geographic region of studies (0, Asia; 1, the USA; 2, Europe). CI, confidence interval; RR, relative risk.
Figure 4.
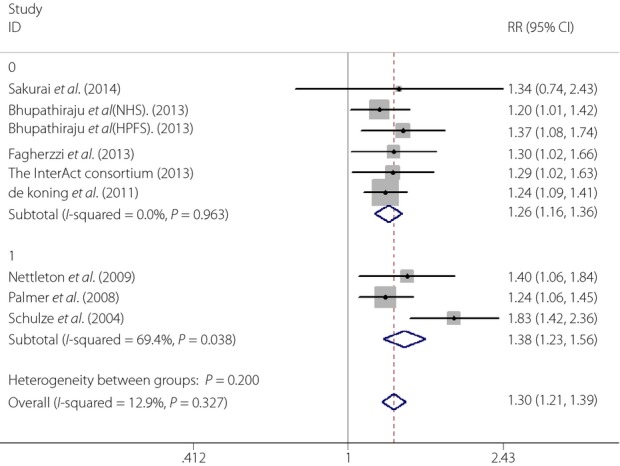
The effects of sugar-sweetened beverages on type 2 diabetes with or without adjusting body mass index (0,Yes; 1, No). CI, confidence interval; RR, relative risk.
The sensitivity analysis result showed that the study by Schulze et al. substantially influenced the RR for type 2 diabetes. After excluding the study, the RR was 1.26 (95% CI 1.18–1.35), and there was no significant study heterogeneity (Q = 1.59, P = 0.98, I2 = 0%).
As for the estimation of publication bias, neither Egger's regression asymmetry test (P = 0.166) nor Begg's rank correlation test (P = 0.309) gave a statistically significant result.
Discussion
In the present study, with stricter eligibility criteria, our meta-analysis results provided updated evidence that a greater intake of SSBs was positively associated with a 30% higher risk of developing type 2 diabetes. In 2010, Malik et al.8 carried out a meta-analysis study and reported a similar, but lower increased, risk (26%) of developing type 2 diabetes for individuals in the highest quantile of SSBs intake than non-consumers8. However, some studies included in the meta-analysis reported results without differentiating sugar-sweetened and artificially sweetened soft drinks, and Greenwood et al.16 showed that the effect of artificially-sweetened soft drinks on type 2 diabetes was lower than that of sugar-sweetened soft drinks.
To explore the sources of heterogeneity, we carried out subgroup analysis based on the geographic region of studies (Asia, the USA and Europe), in which significant positive associations were observed in the USA and Europe. Although a relatively small number of studies were included in the subgroup, it was meaningful to show that higher SSBs intake was associated with greater type 2 diabetes risk in the USA and Europe considering the high intake frequency and portion size4.
Meanwhile, we also carried out subgroup analysis based on whether the estimated effects of SSBs on type 2 diabetes were adjusted by BMI in each study. Many previous studies showed that the effects of SSBs intake on the risk of diabetes were lower or even not significant after adjustment for BMI8,10,28. The present findings showed a significant positive, but lower, risk of SSBs intake for type 2 diabetes with adjusting BMI (RR 1.26, 95% CI 1.16–1.36), which was consistent with previous studies. The mechanisms by which SSBs intake might result in the risk of developing type 2 diabetes were complicated and still remained unclear. Based on our findings, we proposed that other mechanisms except BMI might explain the association of SSBs intake with the risk of type 2 diabetes and hope more research will focus on this issue.
The present study had several strengths. First, compared with previous similar meta-analysis, we used new, stricter eligibility criteria, which were thought to examine the association between SSBs intake and risk of type 2 diabetes more precisely. In addition, the large sample size, prospective study design and long follow-up duration were also strengths of the present study.
A few limitations should be considered. First, our meta-analysis was limited to studies published in English. However, we found no evidence of publication bias. Second, type 2 diabetes was diagnosed mainly by self-report, which might underestimate the number of people affected by type 2 diabetes.
Third, we estimated the effects on type 2 diabetes only with highest versus lowest intake of SSBs, and did not determine a dose–response association without the same units. Fourth, as the lowest category of SSBs intake was under one serving/month in all selected articles, it was better to unite the lowest category.
The present study showed that SSBs intake was associated with the risk of developing type 2 diabetes. Considering the rapid increase in consumption of SSBs across the globe, our findings have important public health implications. Although the specific mechanisms were confused, we suggested that individuals should limit the intake of SSBs to prevent the development of type 2 diabetes.
Acknowledgments
The study was sponsored by ‘Clinical Medicine Research Special Fund of Chinese Medical Association’ (grant number: 13040530438). The authors declare no conflict of interest.
References
- Whiting DR, Guariguata L, Weil C, et al. IDF diabetes atlas: global estimates of the prevalence of diabetes for 2011 and 2030. Diabetes Res Clin Pract. 2011;94:311–321. doi: 10.1016/j.diabres.2011.10.029. [DOI] [PubMed] [Google Scholar]
- Guariguata L. By the numbers: new estimates from the IDF Diabetes Atlas Update for 2012. Diabetes Res Clin Pract. 2012;98:524–525. doi: 10.1016/j.diabres.2012.11.006. [DOI] [PubMed] [Google Scholar]
- Duffey KJ, Popkin BM. Shifts in patterns and consumption of beverages between 1965 and 2002. Obesity (Silver Spring) 2007;15:2739–2747. doi: 10.1038/oby.2007.326. [DOI] [PubMed] [Google Scholar]
- Nielsen SJ, Popkin BM. Change in beverage intake between 1977 and 2001. Am J Prev Med. 2004;27:205–210. doi: 10.1016/j.amepre.2004.05.005. [DOI] [PubMed] [Google Scholar]
- Bates B, Lennox A, Prentice A, et al. National Diet and Nutrition Survey. Headline results from years 1, 2 and 3 (combined) of the Rolling Programme (2008/09–2010/11) London: Department of Health, Food Standards Agency; 2012. [Google Scholar]
- Zenith International. Report on Global Soft Drinks. Bath, UK: Zenith International, Ltd; 2008. [Google Scholar]
- Bray GA. The Battle of the Bulge. Pittsburgh, PA: Dorrance Publishing; 2007. [Google Scholar]
- Malik VS, Popkin BM, Bray GA, et al. Sugar-sweetened beverages and risk of metabolic syndrome and type 2 diabetes. Diabetes Care. 2010;33:2477–2483. doi: 10.2337/dc10-1079. [DOI] [PMC free article] [PubMed] [Google Scholar]
- Eshak ES, Iso H, Mizoue T, et al. Soft drink, 100% fruit juice, and vegetable juice intakes and risk of diabetes mellitus. Clin Nutr. 2013;32:300–308. doi: 10.1016/j.clnu.2012.08.003. [DOI] [PubMed] [Google Scholar]
- Odegaard AO, Koh WP, Arakawa K, et al. Soft drink and juice consumption and risk of physician-diagnosed incident type 2 diabetes. Am J Epidemiol. 2010;717:701–708. doi: 10.1093/aje/kwp452. [DOI] [PMC free article] [PubMed] [Google Scholar]
- Schulze MB, Manson JE, Ludwig DS, et al. Sugar-sweetened beverages, weight gain, and incidence of type 2 diabetes in young and middle-aged women. JAMA. 2004;292:927–934. doi: 10.1001/jama.292.8.927. [DOI] [PubMed] [Google Scholar]
- Bhupathiraju SN, Pan A, Malik VS, et al. Caffeinated and caffeine-free beverages and risk of type 2 diabetes. Am J Clin Nutr. 2013;97:155–166. doi: 10.3945/ajcn.112.048603. [DOI] [PMC free article] [PubMed] [Google Scholar]
- Fagherazzi G, Vilier A, Saes Sartorelli D, et al. Consumption of artificially and sugar-sweetened beverages and incident type 2 diabetes in the Etude Epide miologique aupres des femmes de la Mutuelle Gene′ rale de l'Education Nationale–European Prospective Investigation into Cancer and Nutrition cohort. Am J Clin Nutr. 2013;97:517–523. doi: 10.3945/ajcn.112.050997. [DOI] [PubMed] [Google Scholar]
- InterAct Consortium. Romaguera D, Norat T, Wark PA, Vergnaud AC, Schulze MB, et al. Consumption of sweet beverages and type 2 diabetes incidence in European adults: results from EPIC-InterAct. Diabetologia. 2013;56:1520–1530. doi: 10.1007/s00125-013-2899-8. [DOI] [PubMed] [Google Scholar]
- de Koning L, Malik VS, Rimm EB, et al. Sugar-sweetened and artificially sweetened beverage consumption and risk of type 2 diabetes in men. Am J Clin Nutr. 2011;93:1321–1327. doi: 10.3945/ajcn.110.007922. [DOI] [PMC free article] [PubMed] [Google Scholar]
- Greenwood DC, Threapleton DE, Evans CE, et al. Association between sugar-sweetened and artificially sweetened soft drinks and type 2 diabetes: systematic review and dose–response meta-analysis of prospective studies. Br J Nutr. 2014;16:1–10. doi: 10.1017/S0007114514001329. [DOI] [PubMed] [Google Scholar]
- Montonen J, Järvinen R, Knekt P, et al. Consumption of sweetened beverages and intakes of fructose and glucose predict type 2 diabetes occurrence. J Nutr. 2007;137:1447–1454. doi: 10.1093/jn/137.6.1447. [DOI] [PubMed] [Google Scholar]
- Stroup DF, Berilin JA, Morton SC, et al. Meta-analysis of observational studies in epidemiology: a proposal for reporting. Meta-analysis Of Observational Studies in Epidemiology (MOOSE) group. JAMA. 2000;283:2008–2012. doi: 10.1001/jama.283.15.2008. [DOI] [PubMed] [Google Scholar]
- Wells GA, Shea B, O'Connell D, et al. 2000. The Newcastle-Ottawa Scale (NOS) for assessing the quality of nonrandomised studies in meta-analyses. 3rd Symposium on Systematic Reviews: Beyond the Basics, Oxford, UK, July 3–5. Available at: http://www.ohri.ca/programs/clinical_epidemiology/oxford.htm (Accessed July 12, 2014)
- Cochran WG. The combination of estimates from different experiments. Biometrics. 1954;10:101–129. [Google Scholar]
- Higgins JP, Thompson SG. Quantifying heterogeneity in a meta-analysis. Stat Med. 2002;21:1539–1558. doi: 10.1002/sim.1186. [DOI] [PubMed] [Google Scholar]
- Der Simonian R, Laird N. Meta-analysis in clinical trials. Control Clin Trials. 1996;7:177–188. doi: 10.1016/0197-2456(86)90046-2. [DOI] [PubMed] [Google Scholar]
- Egger M, Davey Smith G, Schneider M, et al. Bias in meta-analysis detected by a simple, graphical test. BMJ. 1997;315:629–634. doi: 10.1136/bmj.315.7109.629. [DOI] [PMC free article] [PubMed] [Google Scholar]
- Begg CB, Mazumdar M. Operating characteristics of a rank correlation test for publication bias. Biometrics. 1994;50:1088–1101. [PubMed] [Google Scholar]
- Nettleton JA, Lutsey PL, Wang Y, et al. Diet soda intake and risk of incident metabolic syndrome and type 2 diabetes in the multi-ethnic study of atherosclerosis (MESA) Diabetes Care. 2009;32:688–694. doi: 10.2337/dc08-1799. [DOI] [PMC free article] [PubMed] [Google Scholar]
- Palmer JR, Boggs DA, Krishnan S, et al. Sugar-sweetened beverages and incidence of type 2 diabetes mellitus in African American women. Arch Intern Med. 2008;168:1487–1492. doi: 10.1001/archinte.168.14.1487. [DOI] [PMC free article] [PubMed] [Google Scholar]
- Sakurai M, Nakamura K, Miura K, et al. Sugar-sweetened beverage and diet soda consumption and the 7-year risk for type 2 diabetes mellitus in middle-aged Japanese men. Eur J Nutr. 2014;53:251–258. doi: 10.1007/s00394-013-0523-9. [DOI] [PubMed] [Google Scholar]
- Paynter NP, Yeh HC, Voutilainen S, et al. Coffee and sweetened beverage consumption and the risk of type 2 diabetes mellitus: the atherosclerosis risk in communities study. Am J Epidemiol. 2006;164:1075–1084. doi: 10.1093/aje/kwj323. [DOI] [PubMed] [Google Scholar]