Abstract
DNA-based aptamers are commonly used recognition elements in biosensors for a range of target molecules. Here, the development of a wavelength-shifting optical module for a DNA-based adenosine-binding aptamer is described. It applies the combination of two photostable cyanine-styryl dyes as covalent modifications. This energy-transfer pair is postsynthetically attached to oligonucleotides via a copper(I)-catalyzed azide–alkyne cycloaddition by two structurally different approaches: 1) as nucleotide modifications at the 2′-position of uridines and 2) as nucleotide substitutions using (S)-amino-1,2-propanediol as acyclic linker between the phosphodiester bridges. Both dyes exhibit a remarkable photostability. A library of DNA aptamers consisting of different combinations of the two dyes in diagonal orientations were evaluated by their emission color contrast as readout. Further optimization led to aptasensors with improved fluorescent readout as compared with previously reported aptasensors. This approach described is synthetically facile using simple propargylated phosphoramidites as DNA building blocks. As such, this approach could be applied for other dyes and other chemical/biological applications.
Keywords: aptasensors, cycloaddition, dyes, energy transfer, oligonucleotides
DNA- and RNA-based aptamers are broadly applied recognition elements for biosensing and have been selected for a wide range of target molecules, including protein parts, signaling peptides and small molecules as cellular components.1 The major advantages of aptamers1 include the relatively easy synthetic access, stability under standard conditions, lack of immunogenicity, rapid tissue penetration and the possibility for synthetic modifications by the building block strategy or postsynthesis modifications.2 Aptamers also have significant potential as cellular molecular probes, although real-time imaging of small cellular components3 in living cells is actually accomplished with genetically encoded sensors combining fluorescent proteins with ligand binding protein domains.4 In contrast, the RNA aptamer called “spinach” allows the construction of aptasensors following a modular approach.5 This means that an optical module that carries the fluorophore is connected to a recognition module, the effective aptamer. The detection by a single fluorescence color, however, always bears the risk of giving a false-positive or false-negative readout due to nonspecific effects.
Recently, our concept of DNA and RNA “traffic lights”, firstly based on a dye combination of thiazole orange and thiazole red that were both placed as base substitutions into DNA, was described in the literature.6, 7, 8 A fluorescence color contrast (red/green) of up to 20:1 was achieved together with a large wavelength shift of 140 nm between excitation and emission. Moreover, dyes with significantly enhanced photostability9 can be combined as 2′-modifications in a diagonal arrangement similar to the previous base substitutions in DNA and yield derivatives with remarkable wavelength-shifting fluorescent properties.10
Representatively, we published an example of an aptasensor for adenosine based on our fluorescent DNA base substitutions thiazole orange and thiazole red.8 Herein, we follow the concept of a modular approach and present the development of a wavelength-shifting optical module for an adenosine-binding DNA-based aptamer. The design centers on the combination of two of our photostable cyanine dyes 1 and 2 as covalent DNA modifications (Figure 1). The combination of both dyes close or even in the stem of double helical DNA should allow an efficient energy transfer that changes the emission color. In comparison with our previously published aptasensor,8 1) the photostability is significantly enhanced by the choice of dyes, and 2) the preparation of the modified oligonucleotides is facilitated by postsynthesis modification methodology, as well as 3) the color contrast could be further improved.
Figure 1.

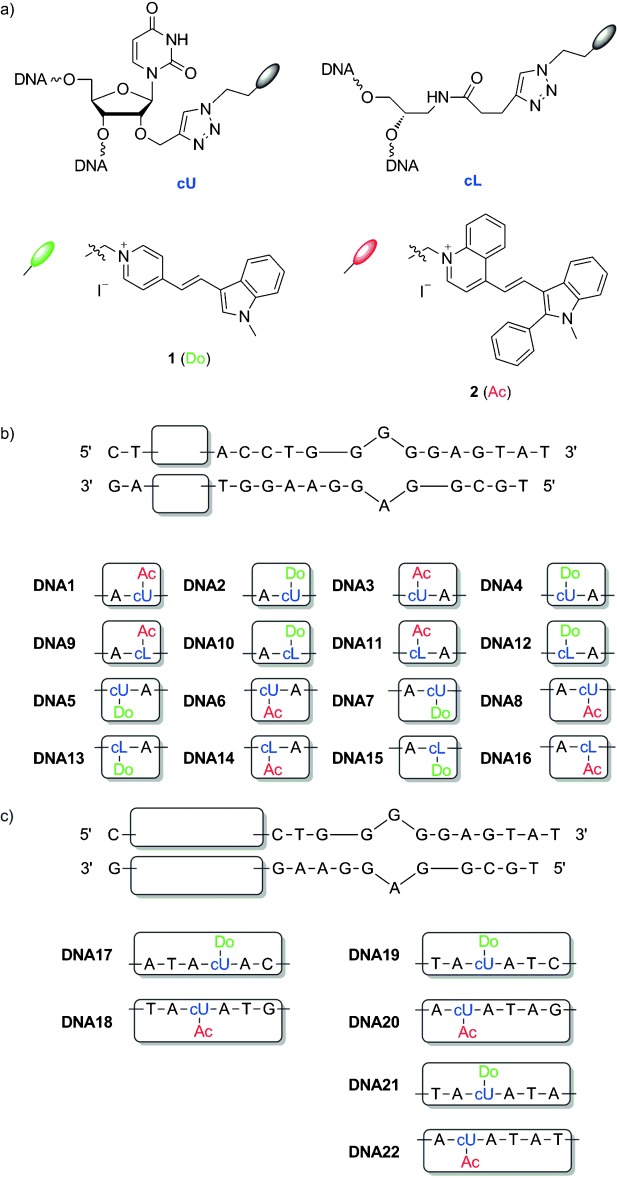
a) Structures of building blocks cU and cL, and dyes 1 and 2; b) sequences of library DNA1–DNA16; c) sequences of DNA17–DNA22.
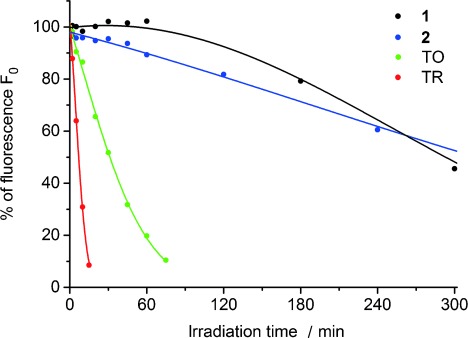
The recognition module (Figure 1) is derived from a 27-mer aptamer sequence for adenosine-binding reported by Patel et al.11 In order to obtain the fluorescence readout by hybridization, it is cut between nucleotide 14 and 15 to yield a split aptamer.12 The optical module is attached to the left side of the recognition module and bears dye 1 as a green emitter and energy donor and dye 2 as a red emitter and energy acceptor. The photostabilities of both dyes in the presence of double-stranded DNA (random sequence, see Supporting Information) under irradiation with a xenon lamp (75 W, 305 nm cut-off filter) were compared with the fluorescence half-lives (t1/2) (Figure 2). Compared with thiazole orange (t1/2=32 min)10 and thiazole red (t1/2=7 min),10 both the green-emitting dye (1) and the red-emitting dye (2) showed significantly improved photostability with t1/2 values of 293 min and 317 min, respectively.
Figure 2.

Photostabilities of dyes 1 and 2, thiazole orange (TO) and thiazole red (TR) determined by measuring the loss of fluorescence intensity in the presence of DNA (10 μm dye, 2.5 μm DNA, 10 mm NaPi buffer, 250 mm NaCl, 5 % EtOH).
Both dyes were postsynthetically attached to the oligonucleotides to avoid the time-consuming synthesis of the corresponding phosphoramidites.13 The dyes were coupled by two structurally different approaches (Figure 1): 1) as a nucleotide modification at the 2′-position of uridine (DNA1–DNA8; DNA17–DNA22), and 2) as a nucleotide substitution using (S)-amino-1,2-propanediol as an acyclic linker between the phosphodiester bridges (DNA9–DNA16).14 Previously, we have shown that the concept of wavelength-shifting DNA probes (DNA “traffic lights”) work for both structural scenarios;6, 9 it was expected that the diversity of possible chromophore interactions would be enhanced if both types of dye attachments are combined in one DNA library.
The single-stranded oligonucleotides DNA1–DNA22 were synthesized according to our published protocols using the copper(I)-catalyzed cycloaddition between the propargyl groups as part of the oligonucleotides and azide-modified dyes. The synthesis of the azide of dye 1 has previously been published;10 the preparation of the azide of dye 2 is described in the Supporting Information. Based on the right-handed helicity of the double-stranded DNA, variations of the diagonal orientation of the two dyes in the optical module was achieved by combining one of the oligonucleotides, DNA1–DNA4 and DNA9–DNA12, with one of the complementary counterparts, DNA5–DNA8 and DNA13–DNA16.
We carefully analyzed the optical data of all prepared double-stranded combinations of DNA1–DNA16 of the library, each in the absence and presence of 1 mm adenosine (2.5 μm duplex DNA; see Supporting Information). The absorption spectra of all prepared duplexes show clearly the presence of both chromophores by signals for 1 at 470 nm and for 2 at 550 nm (see Supporting Information). The extinction of both dyes 1 and 2 as covalent labels varies, and the alterations are more pronounced for 1. This clearly affects the fluorescence readout (see below). Upon selective excitation of dye 1, the fluorescence intensities were measured at wavelengths typical of dyes, that is 535 nm (I535) and 610 nm (I610). The most promising candidates were identified based on the requirement that the red/green ratio in the presence of adenosine as a target must be at least one to obtain a detectable readout (Table 1).
Table 1.
Optical properties of selected DNA double-strand aptamers from the library.[a]
| DNA | A470/A550[b] | A470/A550[c] | I610/I535[b] | I610/I535[c] | F[d] | ΦF Do[b,e] | ΦF Do[c,e] | ΦF Ac[b,e] | ΦF Ac[c,e] | ΦF Ac[b,f] | ΦF Ac[c,f] | E[c,g] |
|---|---|---|---|---|---|---|---|---|---|---|---|---|
| DNA1-5 | 0.99 | 1.26 | 0.32 | 1.35 | 4.2 | 0.094 | 0.034 | 0.107 | 0.147 | 0.257 | 0.215 | 0.68 |
| DNA2-6 | 0.88 | 1.06 | 0.34 | 2.66 | 7.7 | 0.085 | 0.035 | 0.093 | 0.148 | 0.227 | 0.215 | 0.69 |
| DNA2-14 | 0.86 | 1.18 | 0.28 | 1.22 | 4.4 | 0.102 | 0.034 | 0.113 | 0.105 | 0.244 | 0.192 | 0.55 |
| DNA4-8 | 0.80 | 0.97 | 0.26 | 1.09 | 4.2 | 0.111 | 0.032 | 0.107 | 0.069 | 0.211 | 0.159 | 0.43 |
| DNA9-5 | 1.08 | 1.27 | 0.28 | 1.67[h, i] | 8.5[i] | 0.118 | 0.080 | 0.100 | 0.135 | 0.186 | 0.181 | 0.75 |
| DNA9-13 | 1.13 | 1.38 | 0.23 | 1.10[i,j] | 7.2[i] | 0.165 | 0.113 | 0.092 | 0.115 | 0.186 | 0.163 | 0.71 |
| DNA10-6 | 0.95 | 1.10 | 0.32 | 1.40 | 4.3 | 0.159 | 0.049 | 0.104 | 0.145 | 0.222 | 0.206 | 0.70 |
| DNA11-15 | 0.96 | 1.26 | 0.32 | 1.31 | 4.1 | 0.108 | 0.063 | 0.091 | 0.100 | 0.195 | 0.161 | 0.62 |
| DNA17-18 | 0.62 | 0.63 | 0.70 | 3.80 | 5.4 | 0.092 | 0.082 | 0.149 | 0.166 | 0.252 | 0.253 | 0.66 |
| DNA19-20 | 1.03 | 0.86 | 0.60 | 7.69 | 12.7 | 0.107 | 0.021 | 0.136 | 0.186 | 0.242 | 0.224 | 0.83 |
| DNA21-22 | 0.94 | 1.11 | 0.38 | 2.28 | 6.0 | 0.095 | 0.033 | 0.115 | 0.169 | 0.257 | 0.246 | 0.69 |
[a] Conditions: 2.5 μm duplex in 10 mm NaPi buffer, 250 mm NaCl, pH 7, 20 °C; [b] In the absence of adenosine as a target. [c] In the presence of 1 mm adenosine as a target. [d] Enhancement factor (F): I610/I535 (1 mm adenosine) vs I610/I535 (no adenosine). [e] Excitation at 435 nm. [f] Excitation at 542 nm. [g] ΦF Ac (excited at 435 nm)/ΦF Ac (excited at 542 nm). [h] 2.07 at 10 °C. [i] I625 and I535. [j] 1.47 at 10 °C.
Additionally, the ratio of I610/I535 in the absence of the target must be low. Thus, the enhancement factor (F) was applied in order to evaluate the fluorescence readouts of the different double stranded aptamers.15 F represents the fluorescence ratio I610/I535 in the presence versus the fluorescence ratio I610/I535 in the absence of adenosine as a target. Based on this analysis, there are at least three remarkable candidates for further optimization with F values ranging from 7.7 for DNA2-6 over 7.2 for DNA9-13 to 8.5 for DNA9-5 (Table 1; see also the Supporting Information).
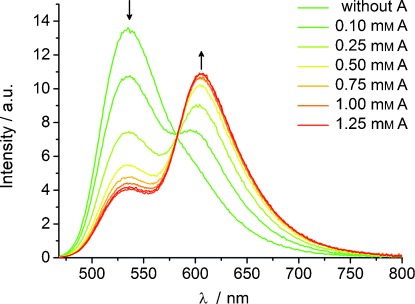
Figure 3 shows the titration of aptamer DNA2–6 with increasing amount of adenosine as a representative example. In comparison, the other two aptamers, DNA9-13 and DNA9-5, exhibit a significantly enhanced quenching of the green fluorescence at 535 nm compared with the increase in the red fluorescence at 610 nm. This effect enhances F but is less useful since the strong green fluorescence in the absence of the target (adenosine) overlays significantly with the red fluorescence in the presence of the target. Hence, aptamer DNA2-6 was chosen as a starting point for further optimization.
Figure 3.

Titration of DNA2-6 (2.5 μm duplex in 10 mm NaPi buffer, 250 mm NaCl, pH 7, λexc=435 nm) with varying amounts of adenosine (A).
There are two critical effects that need more detailed assessment as the basis for improvements:
Split aptamers rely on annealing of two complementary probe oligonucleotides, which yields the cavity for target binding; this is a temperature-dependent process. Accordingly, representative measurements with DNA9-5 and DNA9-13 at lower temperatures (10 °C) showed increased red/green contrasts of 1.47 and 2.07, respectively.
As described in previous publications,6, 8, 10, 16 excitonic interactions between two dyes could interfere with energy-transfer efficiency. If excitonically coupled dimers of 1 and 2 were excited, they cannot undergo efficient energy transfer, since this requires the selective excitation of the uncoupled energy donor (1) in proximity to the uncoupled and unexcited acceptor (2). Excitonically coupled dyes mainly show fluorescence quenching, in very few cases an excimer-like fluorescence. We know from the absorption of the single-modified oligonucleotides that the typical (uncoupled) extinction ratio at 470 nm and 550 nm (A470nm/A550nm) is below 1.0. Hence, ratios greater than 1.0 indicate excitonic interactions that persist in the presence of a target and drop energy-transfer efficiency and thereby lower the color contrast I610/I535. Although the partial overlay of the fluorescence of dye 1 with that of dye 2 as an acceptor in the range between 580 and 700 nm additionally influence the ratio I610/I535, the dependence between excitonic interactions and fluorescence readout can be derived from the optical analysis of nearly all duplexes presented herein (see the Supporting Information).
If this interpretation is correct, energy-transfer efficiencies might be improved by extending the optical module of the aptamers by an additional base pair. A longer “stem” might enhance chromophore–DNA interactions and thereby interfere with undesired chromophore–chromophore interactions. Accordingly, the sequence of DNA2-6 was extended by a base pair on the “left” side (DNA17-18) and on the “right” side of the diagonal chromophore pair (DNA19-20). Aptamer DNA17-18 exhibits less excitonic interactions in the absence and presence of the target (A470/A550=0.62). Accordingly, an emission color contrast I610/I535 ratio of 3.8 and an F value of 5.4 is obtained (Table 1). DNA19-20 in particular exhibits in the presence of adenosine less excitonic interactions (A470/A550=0.86), which increases the emission color contrast to I610/I535 ratio to 7.7 and the F value to 12.7.
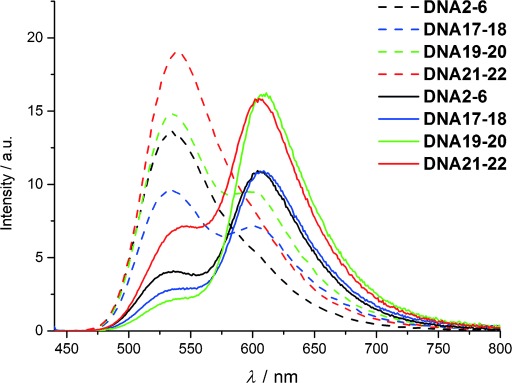
On the other hand, both split aptamers, DNA17-18 and DNA19-20, show a small amount of red fluorescence that indicates annealing of a smaller portion of oligonucleotides occurs already in the absence of adenosine (Figure 4), hence, DNA21-22 was synthesized. The sequence is identical to DNA19-20 except for one G–C pair that has been replaced by an A–T pair in the optical module in order to weaken the stability of the double strand in the absence of adenosine. As desired, no hybridization is observable by the red fluorescence of dye 2 in this duplex, but the addition of adenosine as a target yields only moderate color contrast, with an I610/I535 ratio of 2.28 due to increased excitonic interactions (A470/A550=1.11). The small shifts of the fluorescence maximum are caused by the differences in the sequences as the interactions of dyes 1 and 2 depend on the neighboring bases. Representatively, the specific binding was controlled using DNA19-20 (see the Supporting Information). There was absolutely no fluorescence change observable in the presence of guanosine as the wrong target.
Figure 4.

Fluorescence spectra of duplexes DNA1–2, DNA17–18, DNA19–20 and DNA21–22 in the absence (dashed lines) and presence (solid lines) of adenosine (A) at 1 mm, 2.5 μm duplex in 10 mm NaPi buffer, 250 mm NaCl, pH 7, 20 °C, λexc=435 nm.
In conclusion, we presented the development of a wavelength-shifting optical module for an adenosine-sensitive DNA aptamer probe. It follows our concept of in-stem labelling with fluorophores in order to force the two fluorophores into close proximity by the surrounding DNA architecture (DNA “traffic lights”). The double labelling combines two of our photostable cyanine dyes, 1 and 2, as covalent DNA modifications to an energy-transfer pair. In comparison with our previously published aptasensor for adenosine,8 1) the photostability is significantly enhanced by the choice of dyes 1 and 2, 2) the preparation of the modified oligonucleotides is facilitated by the application of click-type postsynthesis modification methodology, and 3) the color contrast could be further enhanced to allow a more precise fluorescence readout. The dyes were incorporated into oligonucleotides by two structurally different approaches: 1) as a nucleotide modification at the 2′-position of uridine and 2) as a nucleotide substitution using (S)-amino-1,2-propanediol as an acyclic linker between the phosphodiester bridges. Different combinations and diagonal orientations were evaluated. From this library, one aptasensor was identified (DNA2-6) with a red/green color contrast of 2.7 and an enhancement factor of 6.4. Further optimization led to aptasensors with improved fluorescent readout (DNA19-20: I610/I535=7.7 and F=12.7), especially compared with our previous aptasensor.8 Since this approach is synthetically very easy and relies on simple propargylated phosphoramidites as DNA building blocks, it has the potential to be applied for other dyes and for other chemical/biological applications.
Experimental Section
For details of the synthesis and characterization of dyes 1 and 2, as well as the preparation and purification of DNA1–22, see the Supporting Information available on the WWW under http://dx.doi.org/10.1002/open.201402137.
Acknowledgments
Financial support by the Karlsruhe Institute of Technology (KIT), Germany and the Deutsche Forschungsgemeinschaft (DFG) through grant Wa 1386/17–1 and DFG Graduiertenkolleg (GRK) 2039 is gratefully acknowledged.
Supporting Information
As a service to our authors and readers, this journal provides supporting information supplied by the authors. Such materials are peer reviewed and may be re-organized for online delivery, but are not copy-edited or typeset. Technical support issues arising from supporting information (other than missing files) should be addressed to the authors.
Supplementary
References
- 1a.Famulok M, Mayer G. Acc. Chem. Res. 2011;44:1349–1358. doi: 10.1021/ar2000293. [DOI] [PubMed] [Google Scholar]
- 1b.Juskowiak B. Anal. Bioanal. Chem. 2011;399:3157–3176. doi: 10.1007/s00216-010-4304-5. [DOI] [PMC free article] [PubMed] [Google Scholar]
- 1c.Tan W, Donovan MJ, Jiang J. Chem. Rev. 2013;113:2842–2862. doi: 10.1021/cr300468w. [DOI] [PMC free article] [PubMed] [Google Scholar]
- 2.Tolle F, Mayer G. Chem. Sci. 2013;4:60–67. [Google Scholar]
- 3.McKeague M, DeRosa MC. J. Nucleic Acids. 2012;2012:748913. doi: 10.1155/2012/748913. [DOI] [PMC free article] [PubMed] [Google Scholar]
- 4a.Fehr M, Okumoto S, Deuschle K, Lager I, Looger LL, Persson J, Kozhukh L, Lalonde S, Frommer WB. Biochem. Soc. Trans. 2005;33:287–290. doi: 10.1042/BST0330287. [DOI] [PubMed] [Google Scholar]
- 4b.Cho EJ, Lee J-W, Ellington AD. Annu. Rev. Anal. Chem. 2009;2:241–264. doi: 10.1146/annurev.anchem.1.031207.112851. [DOI] [PubMed] [Google Scholar]
- 5a.Paige JS, Nguyen-Duc T, Song W, Jaffrey SR. Science. 2012;335:1194. doi: 10.1126/science.1218298. [DOI] [PMC free article] [PubMed] [Google Scholar]
- 5b.Strack RL, Jaffrey SR. Curr. Opin. Chem. Biol. 2013;17:651–655. doi: 10.1016/j.cbpa.2013.05.014. [DOI] [PMC free article] [PubMed] [Google Scholar]
- 5c.Strack RL, Song W, Jaffrey SR. Nature Protoc. 2014;9:146–155. doi: 10.1038/nprot.2014.001. [DOI] [PMC free article] [PubMed] [Google Scholar]
- 6.Holzhauser C, Wagenknecht H-A. J. Org. Chem. 2013;78:7373–7379. doi: 10.1021/jo4010102. [DOI] [PubMed] [Google Scholar]
- 7a.Holzhauser C, Berndl S, Menacher F, Breunig M, Göpferich A, Wagenknecht H-A. Eur. J. Org. Chem. 2010:1239–1248. [Google Scholar]
- 7b.Holzhauser C, Wagenknecht H-A. Angew. Chem. Int. Ed. 2011;50:7268–7272. doi: 10.1002/anie.201101968. [DOI] [PubMed] [Google Scholar]; Angew. Chem. 2011;123 [Google Scholar]
- 7c.Holzhauser C, Liebl R, Goepferich A, Wagenknecht H-A, Breunig M. ACS Chem. Biol. 2013;8:890–894. doi: 10.1021/cb3006616. [DOI] [PubMed] [Google Scholar]
- 8.Holzhauser C, Wagenknecht H-A. ChemBioChem. 2012;13:1136–1138. doi: 10.1002/cbic.201200117. [DOI] [PubMed] [Google Scholar]
- 9.Bohländer PR, Wagenknecht H-A. Org. Biomol. Chem. 2013;11:7458–7462. doi: 10.1039/c3ob41717d. [DOI] [PubMed] [Google Scholar]
- 10.Bohländer PR, Wagenknecht H-A. Eur. J. Org. Chem. 2014:7547–7551. [Google Scholar]
- 11.Lin CH, Patel DJ. Chem. Biol. 1997;4:817–832. doi: 10.1016/s1074-5521(97)90115-0. [DOI] [PubMed] [Google Scholar]
- 12.Sharma AK, Kent AD, Heemstra JM. Anal. Chem. 2012;84:6104–6109. doi: 10.1021/ac300997q. [DOI] [PubMed] [Google Scholar]
- 13.Schmucker W, Wagenknecht H-A. Synlett. 2012;23:2435–2448. [Google Scholar]
- 14.Berndl S, Herzig N, Kele P, Lachmann D, Li X, Wolfbeis OS, Wagenknecht H-A. Bioconjugate Chem. 2009;20:558–564. doi: 10.1021/bc8004864. [DOI] [PubMed] [Google Scholar]
- 15a.Zhang P, Beck T, Tan W. Angew. Chem. Int. Ed. 2001;40:402–405. doi: 10.1002/1521-3773(20010119)40:2<402::AID-ANIE402>3.0.CO;2-I. [DOI] [PubMed] [Google Scholar]; Angew. Chem. 2001;113 [Google Scholar]
- 15b.Jockusch S, Martí AA, Turro NJ, Li Z, Ju J, Stevens N, Akins DL. Photochem. Photobiol. Sci. 2006;5:493–498. doi: 10.1039/b600213g. [DOI] [PubMed] [Google Scholar]
- 16.Holzhauser C, Rubner MM, Wagenknecht H-A. Photochem. Photobiol. Sci. 2013;12:722–724. doi: 10.1039/c2pp25366f. [DOI] [PubMed] [Google Scholar]
Associated Data
This section collects any data citations, data availability statements, or supplementary materials included in this article.
Supplementary Materials
Supplementary


