Abstract
CeO2 nanoparticles have been proven to be competent photocatalysts for environmental applications because of their strong redox ability, nontoxicity, long-term stability, and low cost. We have synthesized CeO2 nanoparticles via solution combustion method using ceric ammonium nitrate as an oxidizer and ethylenediaminetetraacetic acid (EDTA) as fuel at 450 °C. These nanoparticles exhibit good photocatalytic degradation and antibacterial activity. The obtained product was characterized by various techniques. X-ray diffraction data confirms a cerianite structure: a cubic phase CeO2 having crystallite size of 35 nm. The infrared spectrum shows a strong band below 700 cm−1 due to the Ce−O−Ce stretching vibrations. The UV/Vis spectrum shows maximum absorption at 302 nm. The photoluminescence spectrum shows characteristic peaks of CeO2 nanoparticles. Scanning electron microscopy (SEM) images clearly show the presence of a porous network with a lot of voids. From transmission electron microscopy (TEM) images, it is clear that the particles are almost spherical, and the average size of the nanoparticles is found to be 42 nm. CeO2 nanoparticles exhibit photocatalytic activity against trypan blue at pH 10 in UV light, and the reaction follows pseudo first-order kinetics. Finally, CeO2 nanoparticles also reduce CrVI to CrIII and show antibacterial activity against Pseudomonas aeruginosa.
Keywords: antibacterial, cerium oxide, nanoparticles, photocatalysis, solution combustion
Introduction
CeO2 nanoparticles are interesting due to their wide variety of applications in polishing agents, sunscreens, solid electrolytes, solar cells, fuel cells, phosphorescent/luminescent materials, photocatalysis, sensors, oxygen pumps, and metallurgy.1 These applications take advantage of ceriums high thermodynamic affinity for oxygen and sulfur, its potential redox chemistry involving CeIII/CeIV and the unique and useful absorption/excitation energy bands associated with its electronic structure.2 Cerium is a lanthanide series rare earth element and exists as a free metal or oscillates between the CeIII and CeIV oxidation states. Nanoceria (cerium oxide nanoparticles) also hop between CeIII and CeIV valence states and they contain oxygen vacancies that allow the nanoparticles to act as regenerative catalysts.3
Dyes from textile, paper, and other industries are prime examples of environmental contaminants. Nowadays, the presence of pollutant organic dyes in wastewater has become a serious problem.4, 5 Among these dyes, trypan blue is one of the most widely used dye in these industries. Trypan blue, an azo dye reported as a carcinogen,6 creates several environmental problems by releasing highly toxic molecules into bodies of water. It has a highly stable complex structure. Thus, there is a need for an efficient and economical method for the degradation of such highly photostable compounds.[7, 8, 9] Various techniques available for the complete removal of toxic dyes present in wastewater can be subdivided into four main groups: 1) physical techniques, 2) chemical/photocatalytic degradation of dyes, 3) electrochemical techniques, and 4) biological processes.10 Among these methods, photocatalytic degradation of dyes using UV light is one of the most prominent techniques because the reactions are carried out under ambient conditions that are cost-effective and simple.11, 12 Various photocatalysts like TiO2, ZnO, WO3, CeO2, and ZrO2 nanoparticles are used for degradation of organic dyes.13, 14 Out of these catalysts, CeO2 nanoparticles have been proven to be competent photocatalysts for environmental applications because of their strong redox ability, nontoxicity, long-term stability, and low cost.15 Various methods available to prepare CeO2 nanoparticles include hydrothermal, solvothermal, coprecipitation, sol-gel, solution combustion, and sonochemical methods.16, 17 Solution combustion synthesis has an edge over other methods as it is considered simple, instantaneous, single-step, and energy saving.18 Here we report the synthesis of CeO2 nanoparticles using ceric ammonium nitrate as an oxidizer and ethylenediaminetetraacetic acid (EDTA) as a fuel for the first time. EDTA is used as fuel because it is nontoxic, cheap, and rich in carbon, nitrogen, hydrogen, and oxygen which are released as their corresponding oxides during combustion. The release of these gases leads to the formation of highly porous CeO2 nanoparticles with a greater surface area. This paper focuses on the applications of these CeO2 nanoparticles in the photodegradation of trypan blue, antimicrobial activity, and reduction of CrVI to CrIII.
Results and Discussion
X-ray diffraction
Figure 1 a shows the X-ray diffraction (XRD) pattern of CeO2 nanoparticles synthesized by solution combustion method. XRD was used to check the purity and crystallinity of the nanocrystals. All the diffraction peaks of CeO2 are indexed to cerianite-(Ce): syn structure with cubic phase, lattice points a=b=c=5.41134 Å, space group: Fm-3m (no. 225) and Joint Committee on Powder Diffraction Standards (JCPDS) no. 34-394. The crystallite size calculated from the most intense peaks (2θ=28.5 °) by the Scherrer formula was found to be 35 nm.
Figure 1.
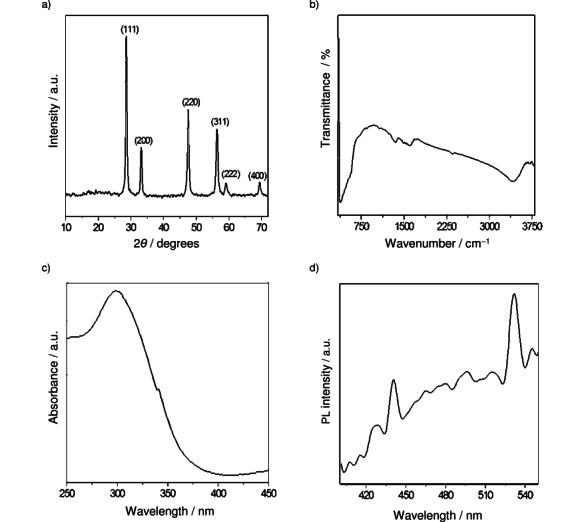
Characterization of CeO2 nanoparticles prepared via solution combustion method. a) Powder XRD pattern; b) FTIR spectrum; c) UV/Vis spectrum; d) Phospholuminescence (PL) spectrum.
Fourier transform infrared (FTIR) and UV/Vis spectroscopy
The FTIR spectrum (Figure 1 b) shows a band at ∼3480 cm−1 which can be indexed to water molecules. The bands from 1200–2000 cm−1 are due to organic moieties. The spectrum exhibits strong bands below 700 cm−1 due to the Ce−O−Ce stretching vibrations.
The UV/Vis spectrum of CeO2 nanoparticles (Figure 1 c) shows a maximum absorption at 302 nm corresponding to the band gap of 4.1 eV, which was blue shifted compared to that of bulk material. The optical properties are strongly dependent on the particle size. The origin of blue shift may be due to size effects.19
Photoluminescence (PL) study
Figure 1 d shows the PL spectrum of CeO2 nanoparticles with an excitation wavelength of 350 nm. It mainly consists of five emission bands: a strong blue emission band at 426 nm (2.9 eV), a strong blue band at 441 nm (2.8 eV), a blue band at 466 nm (2.7 eV), a strong blue-green band at 481 nm (2.6 eV), and a green band at 532 nm (2.33 eV). Our results are consistent with that reported for CeO2 in literature.20 Strong emission peaks at 414 nm and 422 nm are observed for CeO2 nanoparticles. Maensiri et al.21 reported a blue band at approximately 443 nm, along with a green band at 529 nm. The blue shift of the PL peak depends on the size of CeO2 nanoparticles. This phenomenon has been explained by charge transitions from the 4f band to the valence band of the CeO2 nanoparticles.22 In addition, it is well known that the band gap energy between the 4f band, and the valence band of CeO2 nanoparticles varies from 3.0 to 3.38 eV. It depends on the particle size of CeO2 nanoparticles and it can be determined from the calculation of the electronic structure of CeO2.23 Therefore, the emission in our CeO2 samples could be due to the transition from the Ce 4f band to the O 2p band (valence band) in CeO2. The broad PL band ranging from 410 to 540 nm could be the result of defects, including oxygen vacancies in the crystal with electronic energy levels below the 4f band.24 This is confirmed by the enhanced absorption tail below 3 eV in nonstoichiometric CeO2 that was previously observed and attributed to the presence of oxygen vacancies.25
Scanning electron microscopy (SEM) and transmission electron microscopy (TEM)
Figures 2 a–b show the SEM images of CeO2 nanoparticles synthesized by the solution combustion method. This type of porous network with lot of voids is typical of combustion-synthesized powders due to escaping gases. The TEM image (Figure 2 c) shows that the particles are almost spherical in shape, and the average nanoparticle size is found to be 42 nm. This result resembles the crystallite size calculated using Scherers formula.
Figure 2.

Microscopy images of CeO2 nanoparticles prepared via solution combustion method. a) SEM image (Scale bar: 20 μm); b) SEM image (Scale bar: 10 μm.); c) TEM image.
Surface area and pore diameter
Figure 3 shows the N2 adsorption–desorption isotherms along with the Barret–Joyner—Halenda (BJH) pore size distribution plot of CeO2 nanoparticles, and it exhibits a typical IUPAC type IV pattern with the presence of a hysteresis loop. The Brunauer–Emmett–Teller (BET) surface area analysis was found to be 163.5 m2 g−1 which is higher than the reported values. Ching and co-workers synthesized CeO2 nanoparticles through the self-assembly of functionalized nanoparticles in a liquid-crystal phase and reported a surface area of 125 m2 g−1.26 Pan and co-workers explained that the BET surface area greatly influences the catalytic activity. They have also reported the BET surface area of CeO2 nanorods, nanoparticles, and nanotubes as 52.5, 37.2, and 80.1 m2 g−1 respectively.27 Fang and co-workers reported the BET surface area of bulk CeO2 (5.67 m2 g−1), CeO2 nanoparticles (30.33 m2 g−1), and CeO2 nanotubes (83.15 m2 g−1).28 Based on the BJH equation, the main pore size of our CeO2 nanoparticles is 2.9 nm, as given in the inset of Figure 3.
Figure 3.
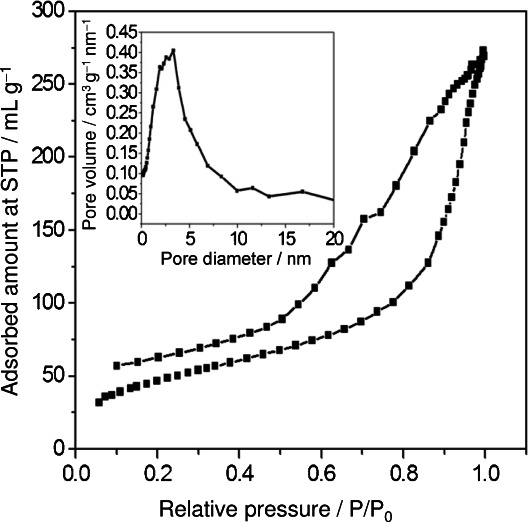
N2 gas adsorption–desorption isotherm of CeO2 nanoparticles. Figure insert: pore diameter of CeO2 nanoparticles prepared via solution combustion method.
Photocatalytic Activity of CeO2 nanoparticles in UV light
Effect of dye concentration
Figure 4 a shows the effect of dye concentration on the photocatalytic activity of CeO2 nanoparticles. The experimental concentration range of trypan blue was 5–25 mg L−1. Catalytic load was maintained at 0.4 g and pH 10. As the dye concentration increases, the time taken for complete degradation of the dye also increases. When the dye concentration is smaller, many active sites in the photocatalyst lie vacant; hence the slurry remains almost clear, enabling light penetration. Light penetration helps in photodegradation. With an increase in the dye concentration, the active sites get occupied by the dye molecules, and this trend continues until all the sites are fully filled which occurs at a specified optimum concentration. Beyond this concentration, the slurry gets turbid, preventing light penetration resulting in decreased degradation.
Figure 4.
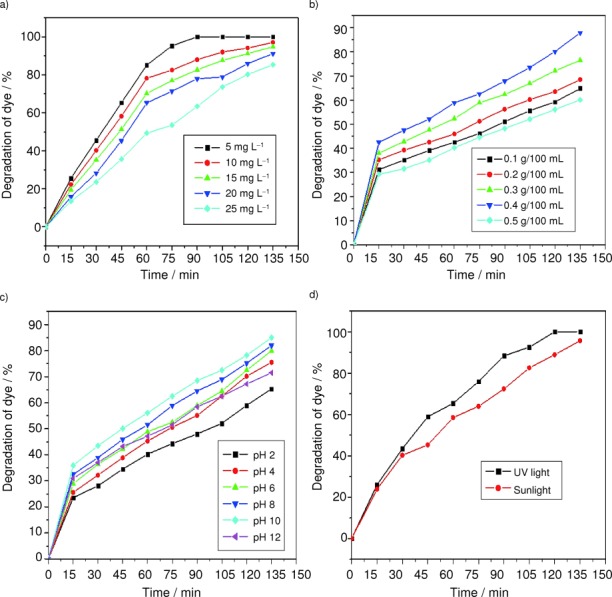
Effect of a) dye concentration, b) catalytic load, c) pH, and d) light source on the photocatalytic activity of CeO2 nanoparticles.
Effect of catalyst load
The effect of catalyst load on the photocatalytic degradation of the dye is as shown in Figure 4 b. In order to determine the optimal dosage of the catalyst; the catalytic load was varied from 0.1 to 0.5 g/100 mL. The optimal load was found to be 0.4 g/100 mL. Above the optimal load, the turbidity of the slurry increases, light penetration decreases, and thus the availability of hydroxides and superoxides becomes minimal; hence, photocatalytic activity also decreases.
Effect of pH
Figure 4 c shows the effect of pH on the photocatalytic degradation of trypan blue. From the figure, it is clear that the photocatalytic process strongly depends on the pH of the dye solution.29 The pH of the solution is adjusted by the addition of either 0.1 m NaOH or 0.1 m H2SO4. The degradation efficiency is higher in basic than in acidic conditions. This observation agrees well with the reported studies.30 The variation of pH alters the surface properties of CeO2, and, in turn, the dissociation of the dye molecules. At pH 10, perhydroxyl radicals (HO2.) are formed, leading to the formation of hydrogen peroxide which gives rise to a number of hydroxyl radicals (HO.).30 The highest photocatalytic degradation observed in the case of CeO2 is at pH 10.
The mechanism of formation of possible radicals is as given below:
| 1 |
| 2 |
| 3 |
| 4 |
| 5 |
| 6 |
| 7 |
| 8 |
| 9 |
| 10 |
Effect of light source on photocatalytic activity
Figure 4 d shows the effect of light sources on photocatalytic degradation. Two different light sources are used, namely, sunlight and UV light. From the figure, it is clear that photocatalytic degradation of the dye is greater in UV light than in sunlight. This is due to the fact that UV light has a higher intensity (lower wavelength or higher energy), so it can easily penetrate the slurry, resulting in the formation of more radicals which in turn increases the rate of photocatalytic degradation of the azo dye.
Effect of recyclability of CeO2 for photocatalytic degradation
Figure 5 shows the effect of recyclability of CeO2 in the photocatalytic degradation of trypan blue. One of todays key industrial wastewater treatment strategies focuses on the development of green technologies. CeO2 recycling can be seen as a good practice for sustainable industrial waste treatment. Consequently, it is necessary to demonstrate whether the catalyst can be reused after rounds of photocatalytic treatment. The nanoparticles were recycled for consecutive use in the trypan blue degradation process, which was repeated up to three times. The photocatalytic reaction was carried out at a constant dye concentration (5 mg L−1) and catalytic load (0.4 g/100 mL of CeO2). These studies indicate that the rate of photodegradation of CeO2 in the first cycle is higher than the subsequent cycles; this could be due to the aggregation and sedimentation of the dye around CeO2 resulting in decreased activity.31
Figure 5.
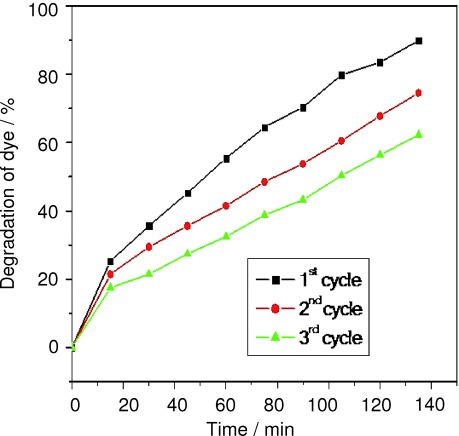
Effect of recyclability of CeO2 on photocatalytic activity.
Comparative study of photocatalytic degradation using bulkCeO2 and nanoparticles
Comparative studies related to the photocatalytic degradation of trypan blue using our prepared CeO2 nanoparticles and commercially procured bulk CeO2 are shown in Figure 6. The photocatalytic reaction was carried out at a constant dye concentration (2 mg L−1) and catalytic load (0.2 g/100 mL of CeO2). From this experiment, it is clear that the photocatalytic activity shown by our CeO2 nanoparticles is much better than for bulk CeO2. This is because size and surface area play major roles in photocatalytic activity.26
Figure 6.
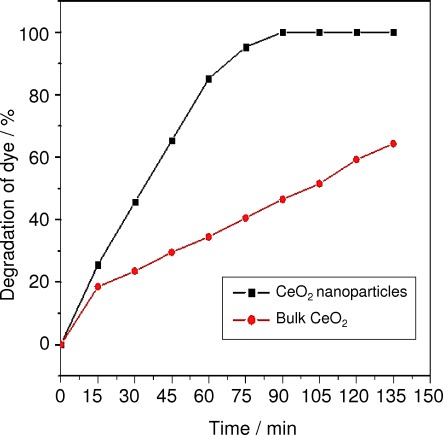
Comparison of the photocatalytic degradation of trypan blue by CeO2 nanoparticles and bulk CeO2.
Kinetics of photocatalytic degradation
The plot of 1+log(optical density (O.D.)) versus irradiation time is a straight line, as shown in Figure 7. This suggests that the bleaching of dye by CeO2 follows a pseudo first-order rate law. The rate constant was found to be 3.52×10⁻⁵ s-1 and was calculated as follows: K (rate constant)=2.303×slope, with the following conditions: dye concentration=10 mg L−1, catalytic dosage=0.4 g/100 mL, pH 10. The data obtained for the kinetics experiment are shown in Table 1.
Figure 7.
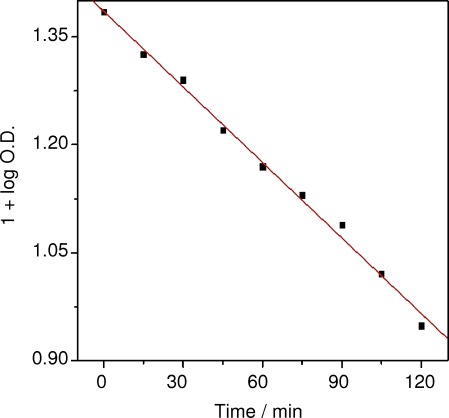
Kinetics of the photocatalytic degradation of trypan blue by CeO2 nanoparticles.
Table 1.
Kinetics of trypan blue dye degradation by CeO2.[a]
| Time [min] | O.D. | 1+log(O.D.) |
|---|---|---|
| 0 | 2.43 | 1.39 |
| 15 | 2.12 | 1.33 |
| 30 | 1.95 | 1.29 |
| 45 | 1.69 | 1.22 |
| 60 | 1.48 | 1.17 |
| 75 | 1.35 | 1.13 |
| 90 | 1.23 | 1.09 |
| 105 | 1.05 | 1.03 |
| 120 | 0.89 | 0.95 |
[a] Dye concentration=10 mg L−1, catalytic dosage=0.4 g/100 mL, pH 10. Measurement of optical density of dye solution at 592 nm.
Reduction of CrVI to CrIII using CeO2 nanoparticles
Compared to CrIII, CrVI is more toxic, leads to adverse effects in the human system, and may cause cancer.32 It cannot be directly decomposed by microbes in the environment.33 The removal of CrVI from the environment via chemical or physical adsorption has been previously reported.34 The transformation of CrVI to CrIII decreases its toxicity.35 Here we report the photocatalytic degradation of K2Cr2O7 (1×10⁻³ m, pH 3.5) by CeO2 nanoparticles (0.2 g) upon treatment with UV light for 105 min. Degradation was monitored by measuring the samples absorbance at 372 nm and 273 nm, which decreases gradually, indicating the successful reduction of CrVI to CrIII as shown in Figure 8.
Figure 8.
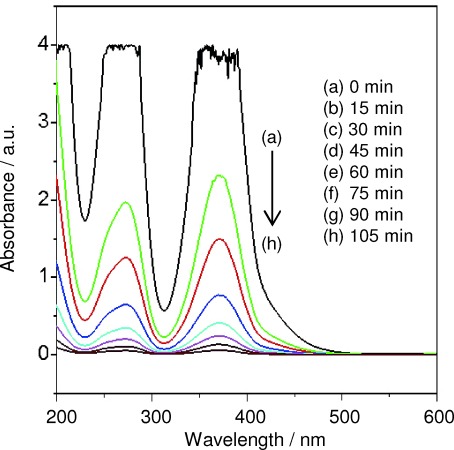
Photochemical reduction of CrVI to CrIII using CeO2 nanoparticles.
The possible mechanism of the reduction of CrVI to CrIII using CeO2 nanoparticles is shown below.
| 11 |
| 12 |
| 13 |
| 14 |
| 15 |
Detection of hydroxyl radicals
Hydroxyl radicals (HO.) have been proven to be the major active species during the photocatalytic degradation reaction. The amount of HO. can be detected by photoluminescence (PL). The rate of formation of HO. during the photocatalytic degradation reaction could be detected by using a simple, rapid, sensitive PL technique by using coumarin as a standard probe. Coumarin reacts with HO. to produce highly fluorescent 7-hydroxycoumarin at a signal of ∼495 nm as shown in Figure 9. In this method, catalyst (0.1 g) was dispersed in coumarin taken (50 mL of 10−3 m) in a borosil trough. Before irradiation the solution was allowed to attain adsorption–desorption equilibrium. This solution was irradiated with UV light with an intensity of 125 Wm−2.36 Every 15 min, aliquots were drawn, and the PL intensity was measured at 456 nm. The intensity increased linearly with the irradiation time which indicates that the formation of HO. at the surface of CeO2 was proportional to the irradiation time.37
Figure 9.
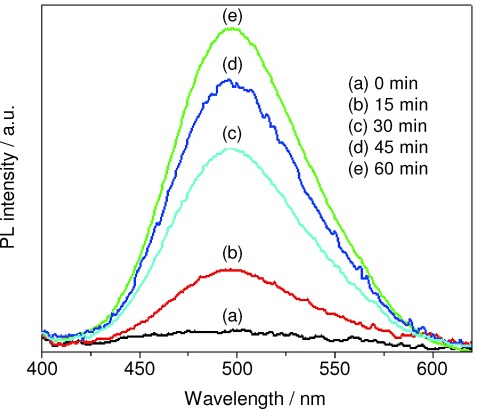
Phospholuminescence (PL) spectra for the detection of hydroxyl radicals.
Antibacterial activity of CeO2 nanoparticles
Agar well diffusion method
The stock solution of CeO2 nanoparticles was prepared by dispersing 2000 μg L−1 in sterile water and making further dilutions. Ciprofloxacin (500 μg L−1 in sterile water) was used as positive control and only sterile water was used as negative control.
CeO2 nanoparticles were screened using the agar well diffusion method on two different bacterial pathogens: Pseudomonas aeruginosa and Staphylococcus aureus. We maintained the positive standards concentration at 10 μg/50 mL, while varying that of CeO2 nanoparticles from 500 μg/50 mL to 1000 μg/50 mL for both bacterial pathogens. The obtained experimental data (Table 2) clearly show that, as the concentration of CeO2 nanoparticles increases, the zone of inhibition also increases in the case of P. aeruginosa. The other bacterial pathogen, S. aureus, did not show a zone of inhibition due to the incomplete dissolution of the compound (Figure 10).
Table 2.
Antibacterial activity of CeO2 nanoparticles towards P. aeruginosa and S. aureus.
| Zone of inhibition (diameter) [mm] | |||
|---|---|---|---|
| Group | Treatment | P. aeruginosa | S. aureus |
| I | Ciprofloxacin (10 μg/50 μL) | 14.17±0.17 | 13.17±0.44 |
| II | CeO2 (500 μg/50 μL) | 3.33±0.33[**] | Not seen |
| III | CeO2 (750 μg/50 μL) | 3.57±0.17[*] | Not seen |
| IV | CeO2 (1000 μg/50 μL) | 4.50±0.29[**] | Not seen |
Values represent the mean ±S.E. for n=3 replicates. [*] p<0.05, [**] p<0.01 as compared with the control group.
Figure 10.

Antibacterial activity of CeO2 nanoparticles using the agar well diffusion method. A) P. aeruginosa with CeO2 (500, 750, and 1000 μg per 50 μL in well), s: Ciprofloxacin (standard, positive control), c: water (negative control); B) S. aureus with CeO2 (500, 750, and 1000 μg per 50 μL in well).
Broth dilution method
In the broth dilution method it is clear that CeO2 nanoparticles show antibacterial activity towards P. aeruginosa (Figure 11). The nanoparticles did not show any activity towards S. aureus when they were incubated for 24 h. A possible mechanism is that the nanoparticles facilitate the formation of free radicals that interact with bacteria, resulting in the degradation of the bacterial cell wall and eventual extermination.38
Figure 11.
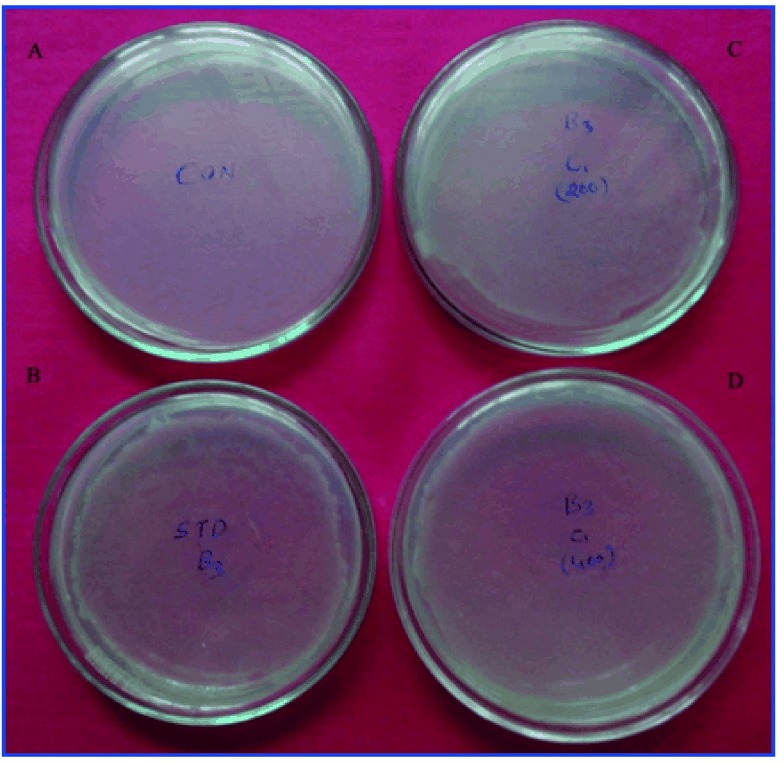
Antibacterial activity of CeO2 nanoparticles using the broth dilution method. P. aeruginosa treated with A) water (negative control); B) Ciprofloxacin (positive control); C) 200 μg mL−1 CeO2; D) 400 μg mL−1 CeO2 nanoparticles.
Conclusions
This paper reports the synthesis and characterization of CeO2 nanoparticles via solution combustion method using EDTA as a fuel for the first time. XRD experiments confirm that the obtained product is cerianite, cubic phase CeO2 with crystallite size 35 nm. FTIR spectrum shows a strong band below 700 cm−1 due to the Ce−O−Ce stretching vibration. The UV/Vis spectrum shows a maximum absorption band at 302 nm. The PL spectrum shows characteristic peaks of CeO2 nanoparticles. SEM images clearly show a porous network with lots of voids, while TEM images indicate spherical particles; the size of the nanoparticles are found to be 42 nm. BET surface area and pore diameter are found to be 163.5 m2 g−1 and 2.9 nm respectively. We have observed that CeO2 nanoparticles show significant photocatalytic activity leading to the degradation of trypan blue which follows pseudo first-order kinetics. CeO2 nanoparticles exhibit antibacterial activity against P. aeruginosa in both agar well diffusion and broth dilution methods, and it also actively reduces CrVI to CrIII in UV light at pH 3.5.
Experimental Section
4.1. Materials. All the chemicals used for synthesis were of analytical grade. Chemicals like (NH4)2Ce(NO3)6 and EDTA disodium salt were purchased from Merck, India and were used without further purification. Distilled water was used throughout the experiments.
4.2. Preparation of CeO2 nanoparticles. (NH4)2Ce(NO3)6 and EDTA disodium salt was used as an oxidizer and fuel respectively. To remove the Na+ ions, EDTA disodium salt (10 mL of 1 m solution) was treated with HCl (5 mL of 2 m), and the reaction is as shown in Scheme 1. The obtained precipitate of EDTA was washed several times with water to remove Na+ ions present and dried at 80 °C for 1 h. The dried EDTA was used as a fuel for the preparation of CeO2 nanoparticles. Stoichiometric amounts (1:1) of the oxidizer (2 g) and fuel (0.8 g) were taken in a trough, 10 mL distilled water was added, and the mixture was stirred for 10 min. The homogeneous redox solution was preheated and dehydrated on a hot plate at 150 °C. After dehydration, a gel formed, and this was introduced into a preheated muffle furnace maintained at 450 °C. Smoldering-type combustion took place, and within 3–4 min, the reaction proceeded to completion, forming nanocrystalline CeO2.
Scheme 1.

Conversion of disodium salt of EDTA to pure EDTA.
4.3. Characterization. Powder XRD data was recorded on an X′pert PRO PANalytical X-ray diffractometer (PANalytical, Almelo, The Netherlands) with graphite-monochromatized Cu-Kα (1.5418 Å) radiation. The FTIR spectrum of the sample was collected using an Alpha-P IR spectrometer (Bruker, Billerica, USA). The absorption spectrum and reduction spectrum of CrVI to CrIII were measured on a Lambda-750 UV/Vis spectrometer (PerkinElmer, Waltham, USA). The PL spectrum was measured using an RF-5301PC spectroflurophotometer (Shimadzu, Kyoto, Japan). The BET surface area, that is, N2 adsorption–desorption measurements of the samples were measured using a Tristar II surface area and porosity instrument (Micromeritics, Norcross, USA). The surface morphology was examined using an Ultra 55 SEM (Carl Zeiss, Jena, Germany). TEM was performed on a JEM 1200 Ex microscope (Jeol, Tokyo, Japan) operating at 100 kV.
4.4. Photocatalytic degradation of dye. Photocatalytic experiments were carried out in a 150x75 mm batch reactor in the month of August 2013 between 12–3 PM, in sunlight (750 Wm−2 intensity) and in UV light (125 Wm−2 intensity). An aqueous suspension was prepared by adding a known amount of CeO2 nanoparticles (0.1–0.5 g) to a given concentration of trypan blue dye solution (5–25 mg L−1 in 100 mL). The pH of the solution was adjusted by addition of either 0.1 m NaOH or 0.1 m H2SO4. During the photocatalytic experiments, the slurry was stirred for uniform exposure to light sources. A known volume of the exposed solution (10 mL) was withdrawn at specific intervals of time (15 min), centrifuged (2000 rpm, 15 min) to remove the photocatalyst, and assessed for extent of degradation using a spectrophotometer at 592 nm. Various parameters like effect of nanoparticle concentration, catalytic load, irradiation time, pH, nature of light, and recyclability were also examined. After the completion of the photocatalytic degradation, the catalyst was removed by centrifugation (2000 rpm, 15 min), washed with water, and dried in an air oven at 100 °C for 2 h. This oven-dried catalyst was used for another round of degradation. This procedure was repeated twice, and degradation efficiency was tested each time.
4.5. Antibacterial activity by agar well diffusion method. Antibacterial activity was screened by agar well diffusion method39 for bacterial pathogens (P. aeruginosa NCIM-2242 and S. aureus NCIM-5022). These strains were purchased from National Chemical Laboratory (NCL), Pune, India. Nutrient agar plates were swabbed using sterile l-shaped glass rods with mature broth cultures of the respective bacterial strains incubated for 24 h. By using a sterile cork borer, 6 mm wells were made into the each Petri dish. Various concentrations of CeO2 in sterile water (500, 750, and 1000 μg L−1 per well, ) were used to assess the activity of CeO2 nanoparticles. Water (negative control) and Ciprofloxacin (positive control, Hi Media, Mumbai, India) were added into the wells by using sterile micropipettes. All the plates were simultaneously incubated at 37 °C for 24 h. After the incubation period, the diameter of the inhibition zones of each well was measured. Each sample was tested in triplicate, and the average values were calculated to determine antibacterial activity.
4.6. Antibacterial activity by broth dilution method. Two concentrations of CeO2 (200 and 400 μg L−1) were screened for two bacterial strains, namely P. aeruginosa NCIM-2242 and S. aureus NCIM-5022. In this method, the nanoparticles were dispersed in sterile water to get two different concentrations of the sample solutions. Then, these sample solutions were added into sterile tubes containing nutrient broth. The bacterial suspension (0.1 mL of ∼108 CFU/mL) was added into each tube. In addition, positive control tubes, containing same amount of bacteria and nutrient broth, and negative control tubes, containing only nutrient broth, were also prepared. All the tubes were incubated in a reciprocal shaker with a shaking speed of about 200 rpm min−1 at 37 °C for 24 h. The minimum inhibition concentration (MIC) was defined as the minimum concentration at which there is no visible change in the turbidity of the medium. To evaluate the bactericidal efficacy of the samples, each of the bacterial solutions (0.025 mL) with samples (200 and 400 μg L−1) was taken and plated in sterile nutrient agar plates. Then the plates were incubated at 37 °C for another 24 h, and the number of bacterial colonies was counted. The bactericidal rate (K) could be calculated according to Equation 16,16 where A and B are the number of bacterial colonies corresponding to the positive control group and the sample group, respectively.40
| 16 |
Acknowledgments
T. N. Ravishankar wishes to acknowledge Jain University, India for financial support to carry out the research.
References
- 1.Masui T, Hirai H, Imanaka N, Adachi G, Sakata T, Mori H. J. Mater. Sci. Lett. 2002;21:489–491. [Google Scholar]
- 2.Lin W, Huang Y-w, Zhou X-D, Ma Y. Int. J. Toxicol. 2006;25:451–457. doi: 10.1080/10915810600959543. [DOI] [PubMed] [Google Scholar]
- 3.Arnold MC, Badireedy AR, Wiesher MR, Giulia RT, Meyer JN. Arch. Environ. Contam. Toxicol. 2013;65:224–233. doi: 10.1007/s00244-013-9905-5. [DOI] [PubMed] [Google Scholar]
- 4.Zhang N, Ciriminna R, Pagliaro M, Xu YJ. Chem. Soc. Rev. 2014;43:5276–5287. doi: 10.1039/c4cs00056k. [DOI] [PubMed] [Google Scholar]
- 5.Zhang N, Zhang Y, Xu YJ. Nanoscale. 2012;4:5792–5813. doi: 10.1039/c2nr31480k. [DOI] [PubMed] [Google Scholar]
- 6.Benefield LD, Judkins F, Weand BL. Process Chemistry for Water and Wastewater Treatment. New Jersey: Prentice-Hall; 1982. pp. 365–404. [Google Scholar]
- 7.Chu W. J. Water. Res. 2001;35:3147–3152. doi: 10.1016/s0043-1354(01)00015-x. [DOI] [PubMed] [Google Scholar]
- 8.Yang MQ, Xu YJ. Phys. Chem. Chem. Phys. 2013;15:19102–19118. doi: 10.1039/c3cp53325e. [DOI] [PubMed] [Google Scholar]
- 9.Weng B, Liu S, Tang ZR, Xu YJ. RSC Adv. 2014;4:12685–12700. [Google Scholar]
- 10.Bader H, Sturzenegger V, Hoigné J. J. Water. Res. 1988;22:1109–1115. [Google Scholar]
- 11.Fujishima A, Tata NR, Donald AT. J. Photochem. Photobiol. C. 2000;1:1–21. [Google Scholar]
- 12.Zhang Y, Tang ZR, Fu X, Xu YJ. ACS Nano. 2010;4:7303–7314. doi: 10.1021/nn1024219. [DOI] [PubMed] [Google Scholar]
- 13.Zhang N, Yang MQ, Tang ZR, Xu YJ. ACS Nano. 2014;8:623–633. doi: 10.1021/nn405242t. [DOI] [PubMed] [Google Scholar]
- 14.Kamat PV. Chem. Rev. 1993;93:267–300. [Google Scholar]
- 15.Nair JP, Wachtel E, Lubomirsky I, Fleig J, Maier J. Adv. Mater. 2003;15:2077–2081. [Google Scholar]
- 16.Zhang N, Liu S, Xu YJ. Nanoscale. 2012;4:2227–2238. doi: 10.1039/c2nr00009a. [DOI] [PubMed] [Google Scholar]
- 17.Pan X, Yang MQ, Fu X, Zhang N, Xu YJ. Nanoscale. 2013;5:3601–3614. doi: 10.1039/c3nr00476g. [DOI] [PubMed] [Google Scholar]
- 18.Nagabhushana BM, Sreekanth RP, Ramesh KP, Shivakumara C, Chandrappa GT. J. Mater. Res. Bull. 2006;41:1735–1746. [Google Scholar]
- 19.Ramakrishna V, Rima P, Apurba KM. Nanomater. Nanotechnol. 2012;2:8. :2012. [Google Scholar]
- 20.Sathyamurthy S, Leonard KJ, Dabestani RT, Paranthaman MP. Nanotechnology. 2005;16:1960. [Google Scholar]
- 21.Maensiri S, Marsingboon C, Loakul P, Jareonboon W, Promarak V, Anderson PL. Cryst. Growth Des. 2007;7:950–955. [Google Scholar]
- 22.Gao F, Li GH, Zhang JH, Qin FG, Yao ZY, Liu ZK, Wang ZG, Lin LY. Chin. Phys. Lett. 2001;18:443. [Google Scholar]
- 23.Morshed AH, Moussa ME, Bedair SM, Leonard R, Liu SX, Masry NE. Appl. Phys. Lett. 1997;70:1647–1650. [Google Scholar]
- 24.Marabelli F, Wachter P. Phys. Rev. B. 1987;36:1238–1243. doi: 10.1103/physrevb.36.1238. [DOI] [PubMed] [Google Scholar]
- 25.Koelling DD, Boring AM, Wood JH. Solid State Commun. 1983;47:227–232. [Google Scholar]
- 26.Chane-Ching J-Y, Cobo F, Aubert D, Harvey HG, Airiau M, Corma A. Chem. Eur. J. 2005;11:979–987. doi: 10.1002/chem.200400535. [DOI] [PubMed] [Google Scholar]
- 27.Pan C, Zhang D, Shi L. J. Solid State Chem. 2008;181:1298–1306. [Google Scholar]
- 28.Fang J, Cao Z, Zhang D, Shen X, Ding W, Shi L. J. Rare Earths. 2008;26:153–157. [Google Scholar]
- 29.Ghorai TK. Open. J. Phys. Chem. 2011;1:28–36. [Google Scholar]
- 30.Nagaraju G, Ravishankar TN, Manjunatha K, Sarkar S, Nagabhushana H, Goncalves R, Dupont RJ. Mater. Lett. 2013;109:27–30. [Google Scholar]
- 31.Saggioro EM, Oliveira AS, Pavesi T, Maia CG. Molecules. 2011;16:10370–10374. doi: 10.3390/molecules161210370. [DOI] [PMC free article] [PubMed] [Google Scholar]
- 32.Ganea GM, Kolic PE, Zahab B, Warner IM. Anal. Chem. 2011;83:2576–2581. doi: 10.1021/ac102874x. [DOI] [PMC free article] [PubMed] [Google Scholar]
- 33.Barrera-Díaz CE, Lugo-Lugo V, Bilyeu B. J. Hazard. Mater. 2012;223–224:1–12. doi: 10.1016/j.jhazmat.2012.04.054. [DOI] [PubMed] [Google Scholar]
- 34.Speir TW, Kettles HA, Parshotam A. Soil. Bio Biochem. 1995;27:801–810. [Google Scholar]
- 35.Park SJ, Park BJ, Ryu SK. Carbon. 1999;37:1223–1226. [Google Scholar]
- 36.Nagaraju G, Manjunath K, Ravishankar TN, Ravikumar BS, Nagabhushan H, Ebeling G. J. Mater. Sci. 2013;48:8420–8426. [Google Scholar]
- 37.Liu IT, Hon MH, Teoh LG. J. Electron. Mater. 2013;42:2536–2541. [Google Scholar]
- 38.Kuang Y, He X, Zhang Z, Li Y, Zhang H, Ma Y, Wu Z, Chai Z. J. Nanosci. Nanotechnol. 2011;11:4103–4108. doi: 10.1166/jnn.2011.3858. [DOI] [PubMed] [Google Scholar]
- 39.Gokulakrishnan R, Ravikumar S, Anandha R. Asian Pac. J. Trop. Dis. 2012;2:411–413. [Google Scholar]
- 40.Zhou X-D, Huebner W, Anderson HU. Appl. Phys. Lett. 2002;80:3814. [Google Scholar]


