Abstract
Current relapse rates in acute myeloid leukemia (AML) highlight the need for new therapeutic strategies. Panobinostat, a novel pan-histone deacetylase inhibitor, and marizomib, a second-generation proteasome inhibitor, are emerging as valuable therapeutic options for hematological malignancies. Here we evaluated apoptotic effects of this combinatorial therapy in AML models and report earlier and higher reactive oxygen species induction and caspase-3 activation and greater caspase-8 dependence than with other combinations. In a bortezomib refractory setting, panobinostat induced high levels of DNA fragmentation, and its action was significantly augmented when combined with marizomib. These data support further study of this combination in hematological malignancies.
Keywords: Panobinostat, marizomib, bortezomib, acute myeloid leukemia, multiple myeloma
1. Introduction
Relapse in acute myeloid leukemia (AML) patients treated with standard regimens is a significant clinical problem [1]. In contrast to genetic aberrations that lead to irreversible structural DNA changes, epigenetic alterations result in loss or gain of gene function without modification of the DNA coding sequence in a manner that can be reversed pharmacologically to restore normal bone marrow function and achieve clinical disease response [2].
Histone acetylation is controlled by histone acetyltransferase (HAT) and histone deacetylase (HDAC) activities [3]. Inhibition of HDAC activity modifies deregulated gene transcription in cancer cells, inducing growth arrest, differentiation, and apoptosis in a relatively selective manner in cancer versus normal cells [4, 5]. Several structurally diverse classes of HDAC inhibitors (HDACi) have been developed. Among these, the pan-HDACi panobinostat, a novel derivative of cynamic acid hydroxamate [6–8], is a highly potent inhibitor of all class I, II, and IV HDAC enzymes implicated in cancer development and progression [7, 9]. In enzymatic assays, panobinostat inhibited HDACs 1, 2, 4, 8, 10, and 11 at IC50 values that were significantly lower than vorinostat, an FDA-approved pan-HDACi [6].
HDACi rarely exhibit efficacy as single agents, so combination strategies are being interrogated. A recent phase II trial reported encouraging results for the efficacy of panobinostat combined with the first-generation proteasome inhibitor bortezomib and dexamethasone in heavily pretreated bortezomib-refractory multiple myeloma (MM) patients [10]. The combination of panobinostat with bortezomib has yielded promising results in previous tests in AML cell models [11]. Interestingly, prior work from our laboratory has shown that marizomib, a second-generation proteasome inhibitor, exhibits stronger synergy than bortezomib when combined with HDACi in leukemia cells [12, 13].
Marizomib possesses several features that distinguish it from bortezomib. Unlike bortezomib, which was developed to primarily inhibit the chymotrypsin-like activity of the proteasome (the activity of the β5 catalytic subunit), marizomib can inhibit all three catalytic activities of the proteasome: the chymotrypsin-like, caspase-like, and trypsin-like activities. Marizomib has also been shown to rely more heavily on a caspase-8 dependent pathway to initiate cell death; caspase-8 has been shown to be critical for the synergy observed when marizomib is combined with HDACi in acute lymphoblastic leukemia (ALL) models [12]. Data recently published by Niewerth et al. [24] in acute leukemia cell lines showed that marizomib was effective in bortezomib-resistant human T-ALL cells, supporting the concept that these proteasome inhibitors trigger cell death in distinct ways [14].
In the present study, we evaluated panobinostat alone and in combination with marizomib to elucidate effects on cell proliferation, apoptosis, and drug-resistance in AML and bortezomib-resistant cell models. Furthermore, we investigated the molecular mechanisms underlying this combinatorial therapy.
2. Material and methods
2.1. Cell lines and culture conditions
The human leukemia AML3 (human AML FAB-M4) and ML-1 (derived from an M5 AML relapse in a patient initially diagnosed with T-cell ALL) cell lines were purchased from ATCC (Manassas, VA). Cells were maintained in RPMI media supplemented with 0.01 M N-2-hydroxyethylpiperazine-N-2-ethanesulfonic acid (HEPES), 1 mM sodium pyruvate, 10% heat-inactivated fetal bovine serum (FBS; Hyclone, Logan, UT), 2 mM L-glutamine, 100 IU/mL penicillin, and 100 μg/mL streptomycin (Cellgro, Mediatech, Herndon, VA). RPMI-8226 MM parental cells and bortezomib-resistant RPMI-8226vr10 cells were maintained in RPMI media with 2 mM L-glutamine containing 10% FBS, 100 IU/mL penicillin, and 100 μg/mL streptomycin (Cellgro, Mediatech, Herndon, VA). Cells were maintained at 37°C with 5% CO2. Fresh peripheral blood monocuclear cells (PBMCs) were isolated using Ficoll-Paque PLUS gradient (Amersham Biosciences, Uppsala, Sweden), as previously described [15].
2.2. Reagents
Panobinostat, vorinostat, and bortezomib were purchased from LC Laboratories (Woburn, MA). Marizomib was provided by Nereus Pharmaceuticals (San Diego, CA). The chymotrypsin-like activity fluorogenic substrate, suc-LLVY-amc, was obtained from AG Scientific (San Diego, CA). N-acetyl cysteine (NAC), was purchased from Sigma-Aldrich (St. Louis, MO). Hydroethidium (HEt) dye was obtained from Molecular Probes (Eugene, OR). The caspase-3 substrate, DEVD-amc, was obtained from Biomol International, LP (Plymouth Meeting, PA). Antibodies were purchased from the following sources: proteasome subunit β5 (Enzo Life Sciences, Inc., Farmingdale, New York), caspase-8 and caspase-3 (Cell Signaling Technology, Inc., Beverly, Massachusetts). The caspase inhibitors IETD-fmk and LEHD-fmk were purchased from Calbiochem (Merck KGaA, Darmstadt, Germany).
2.3. Viability and DNA fragmentation analysis
Cells were plated at a density of 0.5×10⁶ cells/mL in 12-well plates and treated with indicated doses of panobinostat, vorinostat, marizomib, and bortezomib for indicated times. Cell number and viability were analyzed by trypan blue exclusion measured on a Vi-CELL Cell Viability Analyzer (Beckman Coulter, Brea, CA). DNA fragmentation was assessed by staining cells with propidium iodide (PI) and analyzing samples on the FL-3 channel of a flow cytometer (FACSCalibur; Becton Dickinson, Franklin Lakes, NJ). The percentage of cells with fragmented DNA was determined by gating the subdiploid population using CellQuest Software (BD Biosciences, San Jose, CA).
2.4. Cell lysates and Western blotting
Cells were lysed for 1 hour in Triton X-100 lysis buffer (PBS containing 1% Triton X-100, 25 mM Tris, pH 7.5, and 150 mM sodium chloride) with a protease inhibitor cocktail tablet (Roche, Indianapolis, IN) and phosphatase inhibitor cocktail 2 (Sigma Aldrich, St. Louis, MO), followed by centrifugation. Lysates were collected and separated by sodium dodecyl sulfate-polyacrylamide gel electrophoresis (SDS-PAGE). Proteins were transferred to polyvinylidene fluoride membranes and blocked for 1 hour at room temperature with 5% milk in Tris-buffered saline with 0.05% Tween-20 (TBST). Membranes were incubated with primary antibodies (1:1,000 dilutions) in 5% milk in TBST overnight at 4°C. Membranes were incubatd with corresponding secondary antibodies for 1 hour at room temperature. Bands were visualized by chemiluminescent detection (GE Healthcare, Waukesha, WI). Densitometry was performed using ImageJ software (National Institutes of Health, Bethesda, MD).
2.5. 20S Proteasome activity assay
The fluorogenic peptide suc-LLVY-amc was used to measure chymotrypsin-like proteasome activity in leukemia cells, as previously described [16]. Cells were lysed by freezing and thawing in 20 mM Tris, pH 7.5, 0.1 mM ethylenediaminetetraacetic acid, pH 8.0, 20% glycerol, 0.05% Nonidet-P40, 1 mM 2-β mercaptoethanol, and 1 mM ATP. Lysates were centrifuged and supernatants were combined with fluorogenic peptides in 50 mM HEPES, pH 7.5, and 5 mM ethyleneglycoltetraacetic acid, pH 7.0. Samples were analyzed with a spectrofluorometer (SpectraMax Gemini EM; Molecular Devices, Sunnyvale, CA) at an excitation of 380 nm and an emission of 460 nm. The amount of fluorescence (amc) released correlates with the amount of proteasome activity of the specific proteolytic target. Fluorescence is expressed as relative fluorescent units (RFU).
2.6. Intracellular superoxide levels
HEt, a cell-permeable dye, was used to measure intracellular superoxide levels. Cells were harvested by centrifugation, the cell pellet was resuspended with 10 uM HEt in PBS and incubated for 30 minutes at 37°C in the dark. Samples were harvested, resuspended with 500 μL PBS, and analyzed by measuring the fluorescence intensity on the FL-3 channel of a flow cytometer.
2.7. Caspase-3 activity assay
Caspase-3 activity was determined as previously described [12] using the fluorogenic substrate DEVD-amc. Cells were harvested and lysed in PBS by freezing and thawing on dry ice. Samples were aliquoted in triplicates in a 96-well plate with 150 μL DEVD buffer with 50 μM DEVD-amc. Release of fluorescence (amc) was measured with a spectrofluorimeter at an excitation of 355 nm and an emission of 460 nm. Fluorescence generated by the cleavage of fluorogenic peptide is proportional to caspase-3 activity.
2.8. Statistical analyses
Data presented are the mean (standard deviation [SD]) from three independent experiments performed in triplicate using GraphPad Prism version 6.0 for Windows (GraphPad Sofware, San Diego, CA). Student’s t-tests were performed to determine statistically significant differences between samples. P-values < 0.05 were considered statistically significant. Isobologram analyses using the Chou and Talalay method with Calcusyn (Biosoft, Ferguson, MO) were used to determined syngergy [17]. A combination index (CI) value less than 1.0 indicates synergistic effects, a CI value equal to 1.0 indicates additive interactions, and a CI-value greater than 1.0 indicates antagonistic interactions.
3. Results
3.1. Panobinostat induces more DNA fragmentation and caspase-3 activation than vorinostat in AML and bortezomib-resistant cells
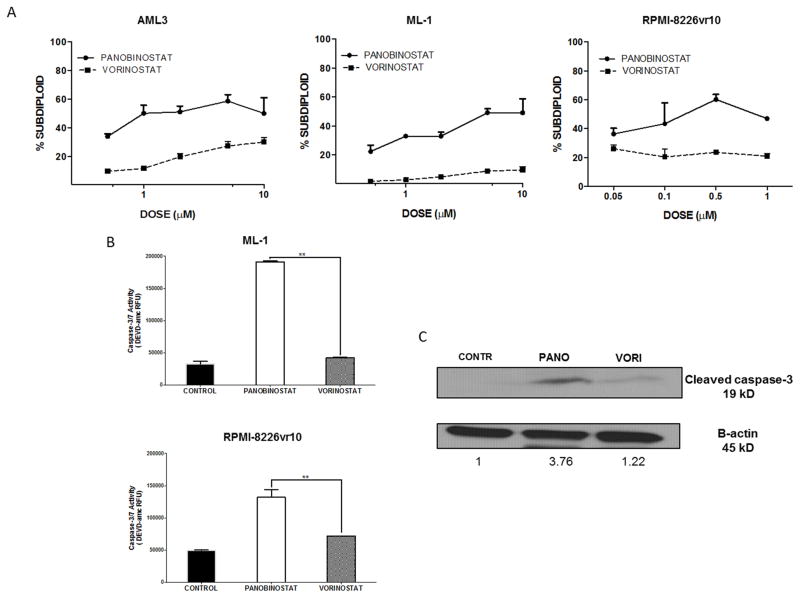
We examined the cytotoxic effects of panobinostat and vorinostat in AML cell lines and bortezomib-resistant MM cells. Both HDACi induced DNA fragmentation in a dose-dependent manner within 24 hours. Panobinostat induced more DNA fragmentation than vorinostat, even at doses as low as 0.5 μM in AML cells and 0.05 μM in bortezomib-resistant cells (Fig. 1A). Since DNA fragmentation is a consequence of caspase-3 activation [18], we examined caspase-3 activity in ML-1 and RPMI-8226vr10 cells in response to equimolar doses (1 μM) of panobinostat and vorinostat. Panobinostat increased caspase-3 activity 4-fold compared to untreated controls in ML-1 cells and 2.5-fold in bortezomib-resistant cells; vorinostat only slightly increased caspase-3 activation in both cell lines (Fig. 1B). Results were further confirmed with detection of cleaved caspase-3 on Western blot (Fig. 1C).
Fig. 1. Panobinostat induces higher DNA fragmentation and caspase-3 activation than vorinostat in AML and bortezomib-resistant MM cells.
A) AML3, ML-1, and RPMI-8226vr10 cells were exposed to increasing concentrations of panobinostat and vorinostat for 24 hours, followed by PI staining for analysis of DNA fragmentation. B) ML-1 and RPMI-8226vr10 cells were treated for 24 hours with equimolar doses (1μM) of panobinostat and vorinostat. Caspase-3/7 activity was measured using the DEVD-amc fluorogenic substrate. C) ML-1 cells well treated with panobinostat or vorinostat for 24 hours, followed by Western blotting for cleaved caspase-3 (**p < 0.01).
3.2. Panobinostat overcomes β5 proteasome subunit overexpression associated with bortezomib resistance
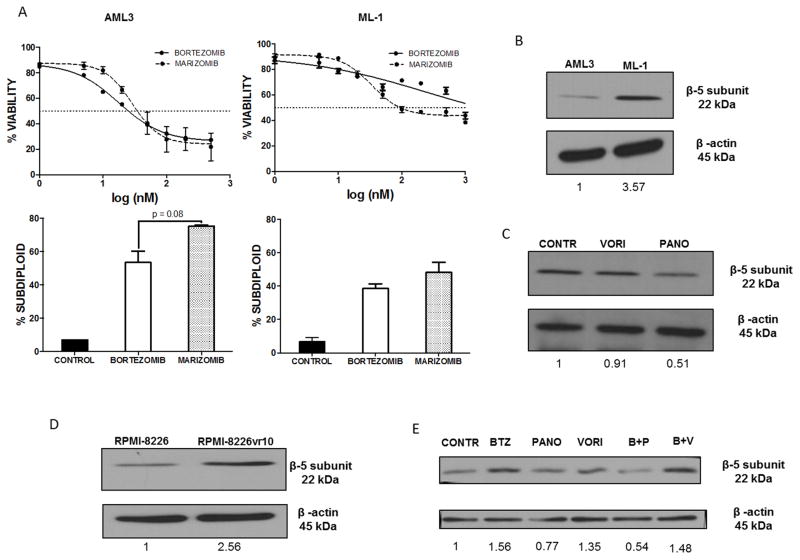
Cell viability analysis revealed that ML-1 cells were more resistant to bortezomib than AML3 cells (Fig. 2A, top panels). Both proteasome inhibitors caused dose-dependent induction of DNA fragmentation at equimolar concentrations (500 nM for AML3 cells and 1 μM for ML-1 cells), with marizomib inducing significantly more DNA fragmentation than bortezomib in AML3 cells, and trending toward more death in ML-1 cells (72% vs. 51% in AML3 cells and 48% vs. 38% in ML-1 cells, respectively) (Fig. 2A, bottom panels).
Fig. 2. Panobinostat is able to overcome β5 proteasome subunit overexpression associated with proteasome inhibitor resistance.
A) Top panels: AML3 and ML-1 cells were exposed to increasing concentrations of bortezomib or marizomib for 24 hours. After treatment, cell viability was assessed by trypan blue exclusion. Bottom panels: Cells were treated with equimolar drug concentrations (500 nM for AML3 and 1 μM for ML-1) for 24 hours, then stained with PI and analyzed for DNA fragmentation (NS = not significant). B) AML3 and ML-1 cell lysates were probed for the proteasome subunit β5. C) ML-1 cells treated 24 hours with equimolar (1 μM) panobinostat or vorinostat were analyzed for expression of the proteasome subunit β5. D) Lysates from parental RPMI-8226 and RMPMI-8226vr10 cells were examined for expression of the proteasome subunit β5. E) RPMI-8226vr10 cells treated for 24 hours with 1 μM panobinostat, 1 μM vorinostat, and 10 nM bortezomib alone and in combination were analyzed for protein expression of the proteasome subunit β5.
Overexpression of the β5 proteasome subunit has been linked to bortezomib resistance [19]. Since ML-1 cells showed marked resistance to bortezomib, we examined whether these cells have elevated β5 subunit levels. Using Western blot analysis, we found that ML-1 cells have higher levels of β5 compared to AML3 cells (Fig. 2B). Since panobinostat has been shown to overcome bortezomib resistance [20], and HDACi have been shown to suppress expression of β5 subunits, we investigated whether panobinostat affected protein levels of this subunit. ML-1 cells treated with panobinostat had a 50% reduction in β5 protein expression compared to untreated cells or cells treated with vorinostat (Fig. 2C). To corroborate these findings, we compared the amount of β5 expression between parental and bortezomib-resistant MM cells. As expected, RPMI-8226vr10 cells had higher expression of β5 than their parental counterparts (Fig. D). Panobinostat, alone and in combination with bortezomib, significantly decreased the amount of β5 expression compared to cells treated with vorinostat (Fig. 2E). Together, these results suggest that panobinostat is a promising agent to overcome resistance to bortezomib.
3.3. Marizomib shows greater immediate suppression of the proteasome and induces higher reactive oxygen species (ROS) levels in AML cells
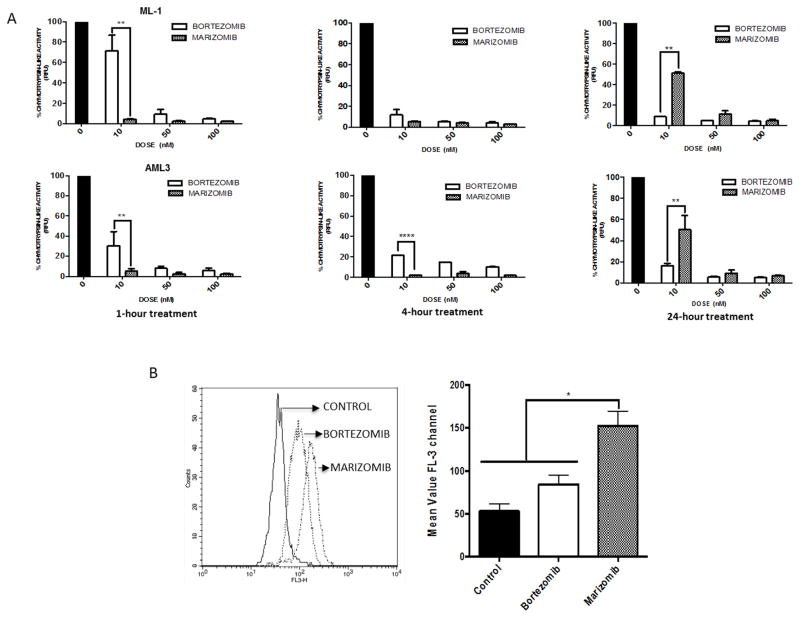
While panobinostat combined with bortezomib has been studied in AML [11, 21], the ability of panobinostat to synergize with the irreversible proteasome inhibitor marizomib has not been explored. We evaluated the effects of equimolar bortezomib and marizomib on the proteolytic activities of the 20S proteasome in AML cells by measuring the chymotrypsin-like activity of the proteasome after 1, 4, and 24 hours of drug exposure. Marizomib showed greater immediate suppression (94.9%) after 1 hour of treatment compared to bortezomib (69%), even at a low dose of 10 nM. As an irreversible proteasome inhibitor, marizomib is expected to cause longer lasting proteasome inhibition than the reversible inhibitor bortezomib. Interestingly, AML cell lines treated with marizomib recover the chymotryptic-like activity of the proteasome more quickly than cells treated with bortezomib, particularly at low doses. At higher doses (50 nM and 100 nM), marizomib is still able to adequately inhibit the proteasome by 87.7% and 95.2%, respectively, at 24 hours (Fig. 3A).
Fig. 3. Marizomib shows greater immediate suppression of the proteasome, but bortezomib causes more sustained suppression.
A) Chymotrypsin-like proteasome activity was measured after 1, 4, and 24 hours of exposure to marizomib or bortezomib in ML-1 cells (top panels) and AML-3 cells (bottom panels). B) After 16 hours of treatment with 10 nM bortezomib or marizomib, cells were stained with HEt dye to measure superoxide levels (*p < 0.05; **p < 0.01).
Several reports indicate that proteasome inhibition increases ROS levels [21], and prior work from our laboratory demonstrated that marizomib has a higher capacity for ROS production than bortezomib in ALL cells [12]. To determine if the same findings apply to AML cells, ML-1 cells were treated with equimolar doses (10 nM) of either bortezomib or marizomib for 16 hours and stained with HEt to determine superoxide levels (Fig. 3B). There was a greater increase in intracellular superoxide levels in cells treated with marizomib than in cells treated with bortezomib. Together, these results indicate that marizomib has a greater immediate capacity for proteasome activity suppression than bortezomib, and marizomib also induces higher levels of ROS than bortezomib in AML cells.
3.4. Panobinostat synergizes with marizomib in ML-1 cells, and the combination does not affect normal PBMC viability
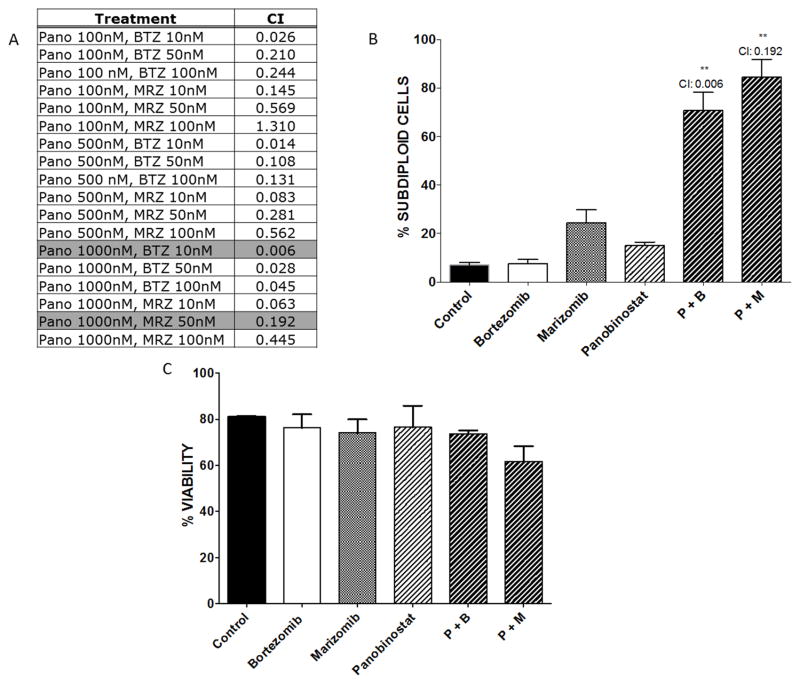
Prior work demonstrated that the combination of proteasome inhibitors with HDACi produced synergistic cell death in lymphoblastic leukemia cells [13]. Therefore, we examined whether panobinostat can be combined with marizomib to enhance apoptosis in AML cells. ML-1 cells were treated for 24 hours with increasing doses of panobinostat (0.1–1 μM) alone or in combination with bortezomib or marizomib (10–100 nM). Synergy was determined as previously described [12, 16]. Bortezomib and marizomib synergized with virtually all doses of panobinostat, as indicated by CI values less than 1.0 (Fig. 4A). The combinations with the highest synergy (Fig. 4B) were 1 μM panobinostat combined with 10 nM bortezomib or 50 nM marizomib (CI = 0.006 for bortezomib combination and CI = 0.192 for marizomib combination). Both of these combinations significantly increased DNA fragmentation and reduced cell viability (p < 0.01) compared to single agent treatment. No synergy was observed with combinations of proteasome inhibitors and vorinostat (data not shown). Interestingly, these combinations did not affect viability of PBMCs derived from healthy donors (Fig. 4C). Together, these results suggest that the combination of low-dose marizomib with panobinostat is specifically synergistic in AML cells.
Fig. 4. Panobinostat synergizes with proteasome inhibitors in ML-1 cells.
A) Calcusyn software were used to determined synergy for combinations of panobinostat (pano) with marizomib (MRZ) and bortezomib (BTZ). CI values < 1.0 indicate synergistic effects, CI values = 1.0 indicate additive interactions, and CI values > 1.0 indicate antagonistic interactions. Highlighted values represent the combinations with the highest synergy based on DNA fragmentation. B) ML-1 cells were exposed to the combinations with the highest synergy: 1 μM panobinostat, 10 nM bortezomib, and 50 nM marizomib. After treatment for 24 hours, cells were stained with PI for analysis of DNA fragmentation (**p < 0.01). C) Healthy donor PBMCs were isolated and treated for 24 hours with bortezomib or marizomib alone and in combination with panobinostat at the same concentrations as in Fig. 4B. Cell viability was assessed by trypan blue exclusion.
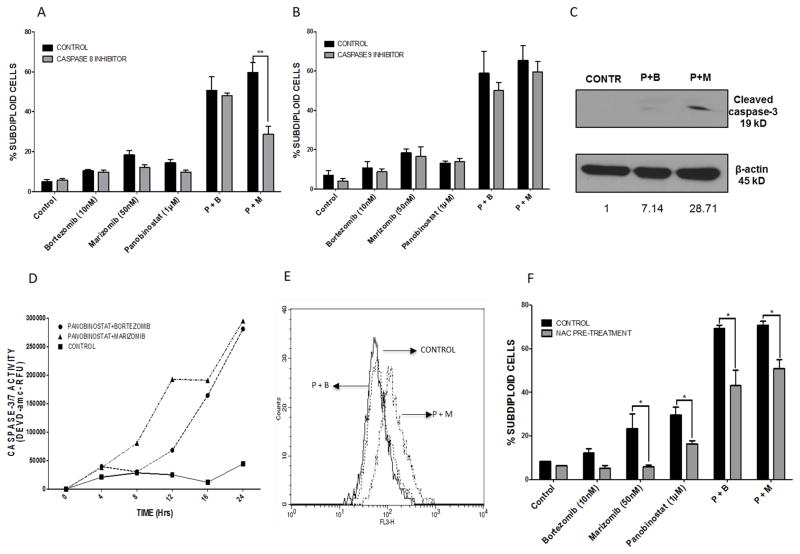
3.5. The combination of panobinostat and marizomib is more dependent on caspase-8 and induces earlier and higher caspase-3 activation in AML cells
To provide a molecular explanation for the enhanced synergy observed with the combination of marizomib and panobinostat, we investigated differences in the apoptotic cascade induced by different combinations. Caspase-8 and caspase-9 dependence were evaluated using inhibitors of caspase-8 (IETD-fmk) and caspase-9 (LEHD-fmk) (Fig. 5A and 5B, respectively). Caspase-8 inhibition decreased the cytotoxicity of the panobinostat plus marizomib combination, whereas no difference was observed in cells treated with panobinostat plus bortezomib (p < 0.01). Western blotting for cleaved caspase-8 corroborated this data (data not shown). Caspase-9 inhibitors did not significantly protect against DNA fragmentation in any of the combinations.
Fig. 5. The combination of panobinostat plus marizomib induces greater and earlier caspase-3 activity and is caspase-8 dependent in ML-1 cells.
A & B) ML-1 cells were pre-treated with inhibitors of caspase-8 (A, IETD-fmk) or caspase-9 (B, LEHD-fmk), followed by treatment with combinations of panobinostat with marizomib or bortezomib. DNA fragmentation was assessed by flow cytometry after propidium iodide staining. C) ML-1 cells were treated for 12 hours with 1 μM panobinostat, 10 nM bortezomib, and 50 nM marizomib. Lysates were probed for cleaved caspase-3. D) ML-1 cells were treated for indicated times with either panobinostat (1 μM) plus marizomib (50 nM) or panobinostat (1 μM) plus bortezomib (10 nM) combinations. Caspase-3/7 activity was measured using the fluorogenic substrate DEVD-amc. E) After 16 hours of treatment with each of the combinations (1 μM panobinostat plus 50 nM marizomib or 1 μM panobinostat plus 10 nM bortezomib), cells were stained with HEt for analysis of superoxide levels. F) ML-1 cells were pretreated for 30 minutes with 24 mM NAC, followed by 24 hours of treatment with diluent, 10 nM bortezomib, 50 nM marizomib, 1 μM panobinostat, or combinations of these agents. DNA fragmentation was assessed by PI staining (*p < 0.05; **p < 0.01).
Next, we examined caspase-3 activity in response to each of the combinations over time. The combination of panobinostat plus marizomib induced earlier (at 8 hours) and higher caspase-3 activation and cleavage compared to the panobinostat plus bortezomib combination (Fig. 5C and 5D).
Since our previously published data showed increased ROS in combinations of HDACi with marizomib [12], we sought to determine if ROS levels increased when marizomib was combined with panobinostat. To do this, ML-1 cells were treated with each of the 2 combinations (panobinostat plus bortezomib or panobinostat plus marizomib). Treatment with panobinostat plus marizomib for 16 hours caused significantly higher elevation in ROS levels than panobinostat plus bortezomib. To test whether the increased levels of ROS observed with the combination of panobinostat and marizomib contributed to apotosis, ML-1 cells were treated with each of the drug combinations with and without pre-treatment with the antioxidant NAC. Exposure to panobinostat alone and in combination with proteasome inhibitors caused an increase in the percentage of subdiploid cells, which was attenuated by pre-treatment with NAC (Fig. 5E).
3.6. Panobinostat plus marizomib causes an early decrease in β5 proteasome subunit overexpression and synergistically overcomes bortezomib resistance
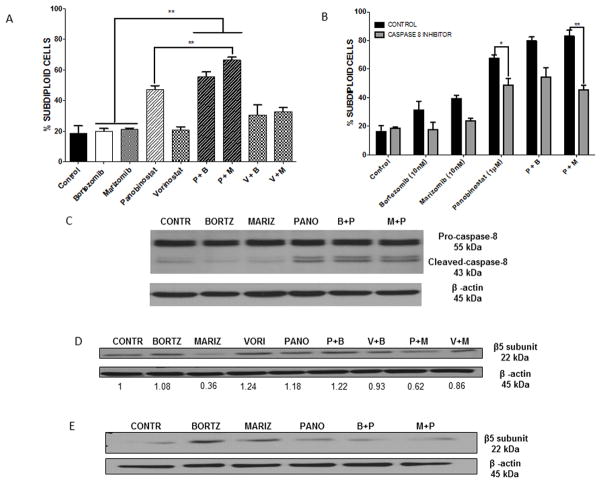
Since we have shown that panobinostat is able to overcome overexpression of the β5 proteasome subunit, which is associated with bortezomib resistance, we examined whether panobinostat, either alone or in combination with marizomib, produced enhanced apoptotic effects in a bortezomib-resistant model. RPMI-8226vr10 cells were exposed to equimolar doses (1 μM) of each of the HDACi and low doses of proteasome inhibitors (10 nM of bortezomib or marizomib) alone and in combination for 24 hours, and then the subdiploid population was quantified by flow cytometry. As expected, the cells were resistant to bortezomib treatment alone. Interestlingly, they were also resistant to marizomib (Fig. 6A). However, exposure to panobinostat overcame resistance to both of the proteasome inhibitors, and the combination of panobinostat plus marizomib caused astatistically significantly higher percentage of DNA fragmentation compared to panobinostat alone (Fig. 6A).
Fig. 6. Panobinostat in combination with marizomib demonstrates synergistic anti-bortezomib-resistant MM effects in vitro and shows earlier and sustained decrease of β5 proteasome subunit overexpression.
A) RPMI-8226vr10 cells were treated with equimolar doses of either of the HDACi (1 μM panobinostat and vorinostat) or proteasome inhibitors (10 nM marizomib and bortezomib) alone and in combination for 24 hours, then stained with PI for analysis of DNA fragmentation (**p < 0.01). B) RPMI-8226vr10 cells were pretreated with a specific caspase-8 inhibitor (IETD-fmk) 30 minutes, followed by treatment with panobinostat, marizomib, and bortezomib alone and in combination for 24 hours. Cells were stained with PI and analyzed for DNA fragmentation (*p < 0.05; **p < 0.01). C) After 12 hours of treatment with the drug combinations used in Fig. 6 A–B, RPMI-8226vr10 cell lysates were probed for caspase-8 cleavage. D–E) RPMI-8226vr10 cells were treated for 12 hours (D) or 24 hours (E) with the 1 μM panobinostat, 1 μM vorinostat, 10 nM bortezomib, or 10 nM marizomib alone and in combination. Lysates were probed for the proteasome subunit β5.
Since we have shown that both panobinostat and marizomib rely on caspase-8 for their apoptotic effects in AML cells (Fig. 5A), we also wanted to investigate if this characteristic was applicable to a bortezomib-resistant model. RPMI-8226vr10 cells were treated with panobinostat and both proteasome inhibitors alone and in combination with a caspase-8 inhibitor (IETD-fmk) for 24 hours, following which DNA fragmentation was assessed. Pre-treatment with the caspase-8 inhibitor protected RPMI-8226vr10 cells from death induced by panobinostat and the panobinostat plus marizomib combination in a statistically significant manner (p < 0.05 and p < 0.01, respectively; Fig. 6B). To verify the role for caspase-8 activation as an early event in panobinostat-induced cell death, we measured cleavage of caspase-8 in RPMI-8226vr10 cells (Fig. 6C). Panobinostat single treatment and its combinations caused activation of caspase-8, indicated by the 43-kDa cleavage fragment.
We used Western blots to test the effects of the panobinostat plus marizomib combination on β5 proteasome subunit expression in RPMI-8226vr10 cells. Interestingly, our results showed that marizomib has an earlier capacity (12 hours) for inhibition of β5 proteasome subunit expression compared to bortezomib and panobinostat. Furthermore, the combination of marizomib and panobinostat also decreased the expression of β5 to half the level of cells treated with panobinostat plus bortezomib, (Fig. 6D). The combination also caused inhibition of β5 subunit expression that was sustained for 24 hours (Fig. 6E). Interestingly, marizomib alone was the most effective at reducing β5 protein expression, indicating that reduction of the β5 subunit is not predictive of degree of cell death, and these events are occurring in parallel pathways. Overall, these data support the effectiveness of panobinostat in cell death induction in a model resistant to multiple proteasome inhibitors, and this apoptotic capacity is further augmented when panobinostat is combined with marizomib.
4. Discussion
Our work demonstrated that panobinostat has apoptotic effects against not only AML cell lines, but also against a bortezomib-resistant model; this effect is indeed more potent than vorinostat (Figure 1). We have also shown that panobinostat demonstrates potent synergy with proteasome inhibitors (either marizomib or bortezomib, Figure 4) in AML cells and chemotherapy-resistant MM cells (Figure 6).
Several recent reports have focused on describing the interactions of HDACi and proteasome inhibitors as a therapeutic strategy for both solid and liquid tumors [10, 11]. However, all of these efforts have focused on bortezomib and carfilzomib, the only FDA-approved proteasome inhibitors. Marizomib has been investigated in clinical trials for advanced solid tumors or refractory MM and lymphoma [22, 23]. Results indicate that marizomib is well-tolerated and induces partial responses in 17–20% of cases, being particularly useful in the bortezomib-refractory setting. Prior results from our laboratory in ALL cells indicate that marizomib demonstrates more potent synergy with HDACi compared to bortezomib [12]. Interestingly, in the current study, the panobinostat plus marizomib combination had a higher and earlier capacity for caspase-3 activation, as well as more potent induction of caspase-3 cleavage, in AML cells (Figure 5). Moreover, drug-mediated apoptosis in bortezomib-resistant MM cells was also significantly increased by the panobinostat plus marizomib combination compared to either drug alone. This difference in synergistic effect with marizomib versus bortezomib may reflect the fact that marizomib is indeed a more potent inhibitor of the proteasome than bortezomib. No apoptosis was seen in PBMCs isolated from healthy donors treated with either of the combinations, reinforcing the selectivity of these combinations for leukemia cells.
Prior publications have suggested that in the HDACi plus marizomib combination, caspase-8 activation and oxidative stress generation appear to be key proapoptotic events [13]. Our study corroborates these findings, as cell death induced by the combination of panobinostat plus marizomib was reversed by the caspase-8/-10 inhibitor IETD-fmk, and was able to induce higher ROS levels than the combination involving bortezomib (Figure 5).
Despite the clinical success of bortezomib in hematological malignancies, resistance to this drug remains a significant, clinically recurrent problem [24]. Overexpression of the β5 proteasome subunit is one mechanism that has been linked to bortezomib resistance [19]. It has been demonstrated that cells with established acquired resistance to bortezomib have up-regulation of a mutant β5 protein, which serves as a compensatory mechanism to retain sufficient chymotrypsin-like proteasome activity [19]. The ability of HDACi to inhibit protein expression of the β5 subunit of the proteasome has been previously reported by our group and others [13]. The current study extends those findings to also include panobinostat, which is also able to inhibit the protein expression of the β5 proteasome subunit not only in AML cells, but also in a bortezomib-resistant MM model. We also find that the combination of panobinostat with marizomib furtherer enhances panobinostat’s apoptotic potential in bortezomib-resistant cell models. Future experiments will focus on the molecular mechanisms involved in the synergy between these 2 agents.
In conclusion, these results support the use of panobinostat alone and in combination with another novel anticancer agent, marizomib, in the treatment of hematological malignancies. The unique antiproliferative and cytotoxic effect of panobinostat against AML and proteasome inhibitor-resistant cells might be linked to the higher potency that this drug exerts against specific HDAC enzymes; this might explain the differences in cytotoxicity between panobinostat and vorinostat found in this study. Our data provide support for clinical development of panobinostat combinations with the overall goal of improving patient outcomes through a more potent and better tolerated therapy, particularly in the setting of refractory disease.
Highlights.
Panobinostat elicits cell death in acute myeloid leukemia (AML) cell lines.
Cell lines resistant to proteasome inhibitors are sensitive to panobinostat.
Synergy is observed with panobinostat and proteasome inhibitors in AML lines.
Acknowledgments
This research is supported in part by the MD Anderson Cancer Center Leukemia SPORE Grant CA100632 and by the NIH/NCI under award number P30CA016672. We thank Blake Johnson, MS, and Mary E. Irwin PhD for technical assistance.
Footnotes
Contributions: FCM designed and performed the experiments, analyzed the data, and wrote the paper; CAM performed experiments and wrote portions of the paper; RZO provided the RPMI-8226 and RPMI-8226vr10 cell lines. JC guided the experimental design and writing of the manuscript. JC revised the paper critically for important intellectual content and submitted the final version.
All other authors have no conflicts of interest.
Conflict of interest statement
Orlowski: Genentech: Honoraria, Membership on an entity’s Board of Directors or advisory committees; Array Biopharma: Honoraria, Membership on an entity’s Board of Directors or advisory committees; Resverlogix: Research Funding; Onyx: Honoraria, Membership on an entity’s Board of Directors or advisory committees, Research Funding; Millennium: The Takeda Oncology Company: Honoraria, Membership on an entity’s Board of Directors or advisory committees, Research Funding; Celgene: Honoraria, Membership on an entity’s Board of Directors or advisory committees, Research Funding; Bristol-Myers Squibb: Honoraria, Membership on an entity’s Board of Directors or advisory committees, Research Funding; Merck: Membership on an entity’s Board of Directors or advisory committees.
Publisher's Disclaimer: This is a PDF file of an unedited manuscript that has been accepted for publication. As a service to our customers we are providing this early version of the manuscript. The manuscript will undergo copyediting, typesetting, and review of the resulting proof before it is published in its final citable form. Please note that during the production process errors may be discovered which could affect the content, and all legal disclaimers that apply to the journal pertain.
References
- 1.Kaspers GJ. Pediatric acute myeloid leukemia. Expert Rev Anticancer Ther. 2012;12(3):405–13. doi: 10.1586/era.12.1. [DOI] [PubMed] [Google Scholar]
- 2.Jones PA, Baylin SB. The epigenomics of cancer. Cell. 2007;128(4):683–92. doi: 10.1016/j.cell.2007.01.029. [DOI] [PMC free article] [PubMed] [Google Scholar]
- 3.Wade PA. Transcriptional control at regulatory checkpoints by histone deacetylases: molecular connections between cancer and chromatin. Hum Mol Genet. 2001;10(7):693–8. doi: 10.1093/hmg/10.7.693. [DOI] [PubMed] [Google Scholar]
- 4.Minucci S, Pelicci PG. Histone deacetylase inhibitors and the promise of epigenetic (and more) treatments for cancer. Nat Rev Cancer. 2006;6(1):38–51. doi: 10.1038/nrc1779. [DOI] [PubMed] [Google Scholar]
- 5.Bhalla KN. Epigenetic and chromatin modifiers as targeted therapy of hematologic malignancies. J Clin Oncol. 2005;23(17):3971–93. doi: 10.1200/JCO.2005.16.600. [DOI] [PubMed] [Google Scholar]
- 6.Atadja P. Development of the pan-DAC inhibitor panobinostat (LBH589): successes and challenges. Cancer Lett. 2009;280(2):233–41. doi: 10.1016/j.canlet.2009.02.019. [DOI] [PubMed] [Google Scholar]
- 7.Khot A, Dickinson M, Prince HM. Panobinostat in lymphoid and myeloid malignancies. Expert Opin Investig Drugs. 2013;22(9):1211–23. doi: 10.1517/13543784.2013.815165. [DOI] [PubMed] [Google Scholar]
- 8.Maiso P, et al. The histone deacetylase inhibitor LBH589 is a potent antimyeloma agent that overcomes drug resistance. Cancer Res. 2006;66(11):5781–9. doi: 10.1158/0008-5472.CAN-05-4186. [DOI] [PubMed] [Google Scholar]
- 9.Lemaire M, et al. The HDAC inhibitor LBH589 enhances the antimyeloma effects of the IGF-1RTK inhibitor picropodophyllin. Clin Cancer Res. 2012;18(8):2230–9. doi: 10.1158/1078-0432.CCR-11-1764. [DOI] [PubMed] [Google Scholar]
- 10.Richardson PG, et al. PANORAMA 2: panobinostat in combination with bortezomib and dexamethasone in patients with relapsed and bortezomib-refractory myeloma. Blood. 2013;122(14):2331–7. doi: 10.1182/blood-2013-01-481325. [DOI] [PubMed] [Google Scholar]
- 11.Jiang XJ, et al. Synergistic effect of panobinostat and bortezomib on chemoresistant acute myelogenous leukemia cells via AKT and NF-kappaB pathways. Cancer Lett. 2012;326(2):135–42. doi: 10.1016/j.canlet.2012.07.030. [DOI] [PubMed] [Google Scholar]
- 12.Miller CP, et al. NPI-0052, a novel proteasome inhibitor, induces caspase-8 and ROS-dependent apoptosis alone and in combination with HDAC inhibitors in leukemia cells. Blood. 2007;110(1):267–77. doi: 10.1182/blood-2006-03-013128. [DOI] [PMC free article] [PubMed] [Google Scholar]
- 13.Miller CP, et al. Caspase-8 dependent histone acetylation by a novel proteasome inhibitor, NPI-0052: a mechanism for synergy in leukemia cells. Blood. 2009;113(18):4289–99. doi: 10.1182/blood-2008-08-174797. [DOI] [PMC free article] [PubMed] [Google Scholar]
- 14.Niewerth D, et al. Antileukemic Activity and Mechanism of Drug Resistance to the Marine Salinispora tropica Proteasome Inhibitor Salinosporamide A (Marizomib) Mol Pharmacol. 2014;86(1):12–9. doi: 10.1124/mol.114.092114. [DOI] [PMC free article] [PubMed] [Google Scholar]
- 15.Chandra J, et al. Involvement of reactive oxygen species in adaphostin-induced cytotoxicity in human leukemia cells. Blood. 2003;102(13):4512–9. doi: 10.1182/blood-2003-02-0562. [DOI] [PubMed] [Google Scholar]
- 16.Lightcap ES, et al. Proteasome inhibition measurements: clinical application. Clin Chem. 2000;46(5):673–83. [PubMed] [Google Scholar]
- 17.Chou TC, Talalay P. Quantitative analysis of dose-effect relationships: the combined effects of multiple drugs or enzyme inhibitors. Adv Enzyme Regul. 1984;22:27–55. doi: 10.1016/0065-2571(84)90007-4. [DOI] [PubMed] [Google Scholar]
- 18.Hengartner MO. The biochemistry of apoptosis. Nature. 2000;407(6805):770–6. doi: 10.1038/35037710. [DOI] [PubMed] [Google Scholar]
- 19.Oerlemans R, et al. Molecular basis of bortezomib resistance: proteasome subunit beta5 (PSMB5) gene mutation and overexpression of PSMB5 protein. Blood. 2008;112(6):2489–99. doi: 10.1182/blood-2007-08-104950. [DOI] [PubMed] [Google Scholar]
- 20.Stessman HA, et al. Profiling bortezomib resistance identifies secondary therapies in a mouse myeloma model. Mol Cancer Ther. 2013;12(6):1140–50. doi: 10.1158/1535-7163.MCT-12-1151. [DOI] [PMC free article] [PubMed] [Google Scholar]
- 21.Yu C, et al. The hierarchical relationship between MAPK signaling and ROS generation in human leukemia cells undergoing apoptosis in response to the proteasome inhibitor Bortezomib. Exp Cell Res. 2004;295(2):555–66. doi: 10.1016/j.yexcr.2004.02.001. [DOI] [PubMed] [Google Scholar]
- 22.Potts BC, et al. Marizomib, a proteasome inhibitor for all seasons: preclinical profile and a framework for clinical trials. Curr Cancer Drug Targets. 2011;11(3):254–84. doi: 10.2174/156800911794519716. [DOI] [PMC free article] [PubMed] [Google Scholar]
- 23.Ocio EM, Mateos MV, San-Miguel JF. Novel agents derived from the currently approved treatments for MM: novel proteasome inhibitors and novel IMIDs. Expert Opin Investig Drugs. 2012;21(8):1075–87. doi: 10.1517/13543784.2012.691164. [DOI] [PubMed] [Google Scholar]
- 24.Cortes J, et al. Phase I study of bortezomib in refractory or relapsed acute leukemias. Clin Cancer Res. 2004;10(10):3371–6. doi: 10.1158/1078-0432.CCR-03-0508. [DOI] [PubMed] [Google Scholar]


