Abstract
Purpose
The aim of this study was to retrospectively review the growth rate in emergency radiology volume at an urban academic trauma center from 1996 to 2012.
Methods
The authors reviewed aggregated billing data, for which the requirement for institutional review board approval was waived, from 1,458,230 diagnostic radiologic examinations ordered for emergency department (ED) visits from 1996 to 2012. The growth rate was calculated as the average annual percentage change in imaging examinations per ED visits. The growth rates between 1996 to 2003 and 2004 to 2012 were statistically compared using a t test.
Results
ED patient visits showed continual growth at an average of 3% per year. Total imaging per ED visit grew from 1996 to 2003 at 4 ± 4% per year but significantly decreased from 2004 to 2012 at −2 ± 3% per year (P = .01). By modality, statistically significant decreased growth was observed in CT and MRI from 2004 to 2012. Ultrasound and x-ray showed unchanged growth from 1996 through 2012. ED physician ultrasound data available for 2002 to 2011 also showed increased growth.
Conclusions
When adjusting ED imaging volume by ED visits, significantly decreased growth of overall ED imaging, specifically CT and MRI, was observed during the past 9 years. This may be due to slowing of new imaging indications, improved awareness of practice guidelines, and increased use of ultrasound. Although the national health care discussion focuses on continual imaging growth, these results demonstrate that long-term stability in ED imaging utilization is achievable.
Keywords: Emergency department, radiology, diagnostic imaging, economics, utilization
INTRODUCTION
Health experts and the US government frequently cite diagnostic imaging as a major area for potential health care savings because of concerns for uncontrolled overutilization [1]. Indeed, the overall growth of volume and cost of imaging services outpaced that of any other physician service for nearly a decade [1], although imaging only represents a small fraction of total medical costs [2]. The causes of increased imaging volume are complex and vary among the outpatient, inpatient, and emergency department (ED) practice settings. Nevertheless, radiology has been placed in a new spotlight, and in the climate of health care reform, there is a perception that diagnostic imaging is overutilized [3].
The ED is frequently cited as one of the more expensive patient encounters [4], partly because radiology constitutes a greater proportion of the total costs of an average ED patient visit [5], among other concerns. Imaging has become an increasingly utilized method for the diagnosis of acute illness and trauma in the ED [6]. Specifically, helical multidetector CT technology has become the “workhorse” of ED diagnosis when imaging is obtained because of its speed and imaging resolution [7], and it is now present in 96% of EDs [8]. As a result of innovations in imaging, ED patient care is increasingly sophisticated, accurate, and efficient, such that imaging is now a central part of routine standard of care [9-11]. However, despite supporting improved accuracy of diagnosis, the rise in emergency radiology volume has also been criticized as replacing the physical examination and cheaper diagnostic examinations, increasing radiation exposure, and enabling defensive medicine practices [12].
Efforts have been introduced to curb overutilization through the creation of evidence-based practice guidelines and the promotion of increased awareness of radiation risk through the Image Wisely® campaign [13]. Yet when evaluating national trends in imaging utilization, ED imaging continues to demonstrate growth [14,15], while outpatient and inpatient imaging has stabilized [16]. Mirroring national trends, single-institution studies analyzing data through 2010 demonstrated continual growth of ED imaging [9,12,17,18]. However, this may be a result of a still early stage of change in practice patterns or inadequate compliance with practice guidelines. In the present study, we retrospectively reviewed trends in emergency radiology volume at our institution from 1996 to 2012.
METHODS
Data for ED imaging volume from the radiology department were collected from billing data that do not include individual protected health information and are therefore classified as non–human subjects research. Data on the volume of ED physician–performed ultrasound examinations were obtained from a separate trauma registry requiring patient chart review with prior institutional review board approval and the requirement for informed consent waived.
Institutional Setting
Our facility is a tertiary care, academic teaching hospital with approximately 900 beds in an urban setting. The ED is a level I adult, pediatric, and burn trauma center. It has a total of 48 acute care beds divided into 7 separate areas, including pediatric and psychiatric areas. A separate observation unit was opened in July 2006 with 14 beds and expanded to 18 beds in July 2012. An emergency radiology division, composed of dedicated radiology faculty members and fellows with rotating residents, provides full coverage of diagnostic radiology services at all hours throughout the year. Dedicated ED imaging equipment changed throughout the study period as follows: from 1996 to 2001, a single CT scanner was dedicated to the ED. A second CT scanner was added in 2001, and both scanners were variously upgraded to the current configuration of a 16-slice and 64-slice CT scanner since 2006. A dedicated MRI scanner was installed in 2003. A dedicated single ultrasound room and 3 digital radiographic rooms were maintained throughout the study period. When dedicated ED scanners were unavailable or required wait times exceeding 1 hour, scanners in other parts of the radiology department were made available.
Data Acquisition
Our institution maintains a computer database on diagnostic radiologic examinations ordered for patients visiting our ED since 1995. Data on examinations were acquired from January 1, 1996, through December 31, 2012, to compare aggregated volume by full calendar year. Each examination counted represents a single coded encounter using an internal examination billing codebook. Although examination codes were revised intermittently throughout the study period, examination descriptions remained relatively stable and were therefore used to primarily aggregate overall volume data across calendar years. All examination descriptions were reviewed manually by the study authors to ensure examinations were counted and assigned accurately. Combined examinations were adjusted with changes in Current Procedural Terminology coding to maintain comparisons. For example, in 2011, the Current Procedural Terminology coding manual mandated that CT abdominal and CT pelvic examinations performed in the same encounter be bundled as one coded examination. To remain consistent with the current standard, all pre-2011 CT abdominal and CT pelvic examinations performed during the same encounter were represented as one examination. Ascertainment of clinical indication was also based on the examination code and descriptions (eg, “CT pulmonary embolism”). Coded variables associated with each encounter include modality, body part, and patient age. Data on volume of ED physician–performed ultrasound examinations were obtained from a separate trauma registry. Patients who underwent interventional radiologic procedures or nuclear medicine examinations were not included except for chest ventilation-perfusion scans because these examinations constituted <0.5% to 1% of our total volume. Data on the number of unique ED patient visits were maintained separately through the emergency medicine department and were collected by full calendar year starting from 1996 onward.
Statistical Analysis
The growth rate in volume was calculated as an average of the annual percentage change of imaging examinations per ED visit. To make a comparison between time periods of growth, the total study interval from 1996 to 2012 was prospectively divided in half, and thus the growth rate was calculated as an annual average during the first half (January 1, 1996, to December 31, 2003) and second half (January 1, 2004, to December 31, 2012) of this period. We chose to divide the study periods in this way to compare average historic growth trends to recent growth trends. The time period of 2004 to 2012 was when we expected to see the effects of systemwide changes to curb utilization, including widespread imaging guidelines, incentive contracts, and the implementation of computerized decision support. To establish decreased growth, a two-tailed t test with unequal variance was used to compare the average annual growth rate between both time periods. The primary outcome examined was whether there was significant growth of total imaging examinations by ED visit from 2004 to 2012 compared with 1996 to 2003. Post hoc analysis was then performed by modality (CT, MRI, radiography, and ultrasound) and further by selected clinical indications (eg, anatomic region). ED physician–performed ultrasound was analyzed separately and not aggregated into overall imaging volume. Data were statistically analyzed using Excel for Mac 2011 (Microsoft Corporation, Redmond, Washington).
RESULTS
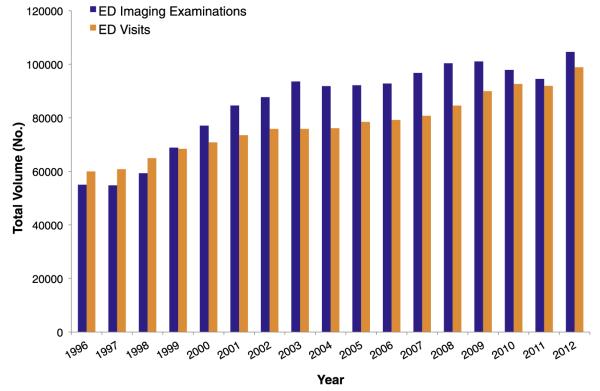
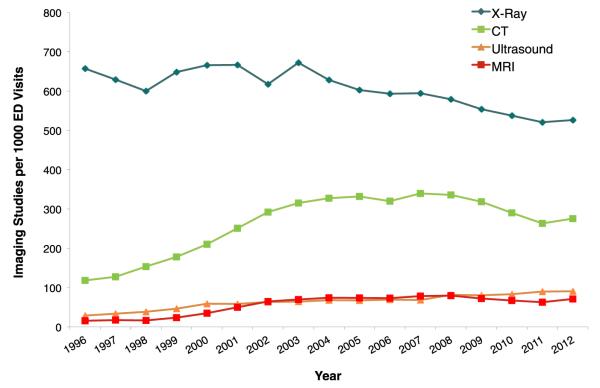
Both ED visits and imaging volume grew continuously from 1996 through 2012 (Fig. 1). From 1996 to 2012, ED visits grew at an annualized rate of 3%, without a significant difference between the first half and second half of the study period. Overall, radiography was the most commonly ordered examination throughout the study period, followed by CT, ultrasound, and MRI (Fig. 2).
Fig 1.
Overall volume of emergency department (ED) imaging examinations and ED patient visits.
Fig 2.
Volume of emergency department (ED) imaging examinations by modality per 1,000 ED patient visits.
Table 1 summarizes the change in average annual growth rate during the first and second halves of the investigation period when calculated as imaging examinations per ED visit. The overall rate of growth of total ED imaging examinations decreased significantly between 1996 to 2003 and 2004 to 2012. Additionally, post hoc analysis by modality revealed significant decreased growth in CT and MRI, whereas no significant changes in growth were demonstrated for ultrasound and radiography.
Table 1.
Average annual growth rate of imaging per emergency department visit, 1996 to 2012
| 1996–2003 (%) | 2004–2012 (%) | P * | |
|---|---|---|---|
| Total imaging | 4 ± 4 | −2 ± 3 | .01 |
| CT | 15 ± 5 | −1 ± 6 | <.001 |
| MRI | 25 ± 21 | 0 ± 7 | .02 |
| Radiography | 1 ± 6 | −3 ± 2 | .25 |
| Ultrasound | 13 ± 10 | 4 ± 7 | .09 |
All data were statistically analyzed using t tests. A statistically significant result is indicated in boldface type for P < .05, indicating that the growth rate had significantly decreased between 2004 to 2012 and 1996 to 2003.
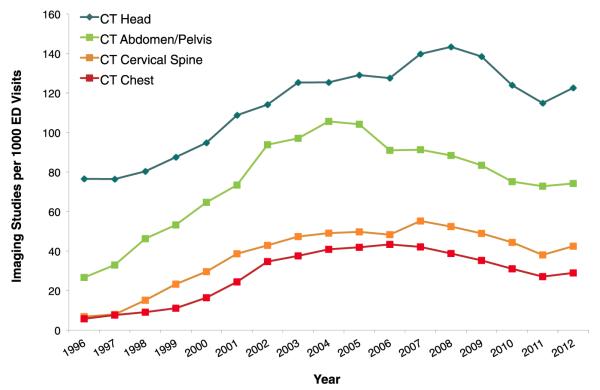
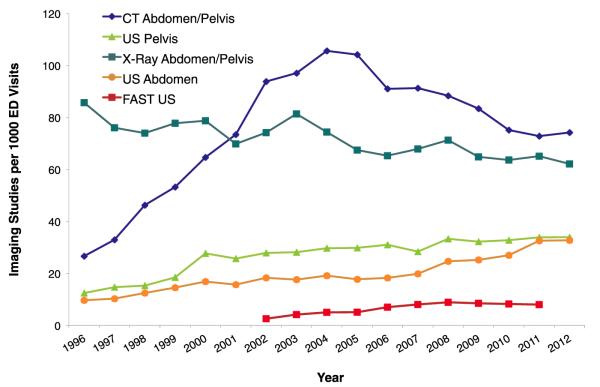
To further understand which examinations contributed to imaging growth or stability, post hoc analysis was performed of modalities by anatomic region (Table 2). Similar to the overall trend, specific CT examination types showed significantly decreased growth (Fig. 3). Among abdominal and pelvic studies, CT growth significantly decreased, while radiology-performed ultrasound continued to grow from 2004 to 2012 (Fig. 4). Data on ED physician–performed focused assessment with sonography in trauma examinations were only available from 2002 to 2011 and also demonstrated growth.
Table 2.
Post hoc analysis of average annual growth rate by select anatomic location, 1996 to 2012
| 1996–2003 (%) |
2004–2012 (%) |
P * | |
|---|---|---|---|
| Head and neck | |||
| CT head | 7 ± 5 | 0 ± 6 | .02 |
| CT C-spine | 34 ± 29 | −1 ± 9 | .02 |
| X-ray C-spine (1-view) | 14 ± 27 | −18 ± 31 | .05 |
| X-ray C-spine (complete) |
−17 ± 7 | −27 ± 24 | .29 |
| MRI head | 27 ± 29 | 2 ± 7 | .06 |
| Chest | |||
| CT chest | 32 ± 16 | −3 ± 8 | <.001 |
| X-ray chest | 1 ± 6 | −3 ±2 | .70 |
| Abdomen and pelvis | |||
| CT abdomen/pelvis | 21 ± 12 | −3 ± 6 | .001 |
| Ultrasound abdomen | 9 ± 11 | 8 ± 10 | .72 |
| Ultrasound pelvis | 14 ± 19 | 2 ±7 | .17 |
| X-ray abdomen/pelvis | 0 ± 8 | −3 ± 6 | .53 |
| ED FAST† | — | 14 ± 22 | — |
Note: C-spine = cervical spine; ED = emergency department; FAST = focused assessment with sonography in trauma.
All data were statistically analyzed using t test. A statistically significant result is indicated in boldface type for P <.05, indicating that the growth rate had significantly changed between 2004 to 2012 and 1996 to 2003.
FAST data were available only from 2002 to 2011.
Fig 3.
Volume of commonly ordered emergency department (ED) CT imaging examinations per 1,000 ED patient visits.
Fig 4.
Volume of abdominal and pelvic emergency department (ED) imaging examinations per 1,000 ED patient visits. FAST = focused assessment with sonography in trauma; US = ultrasound.
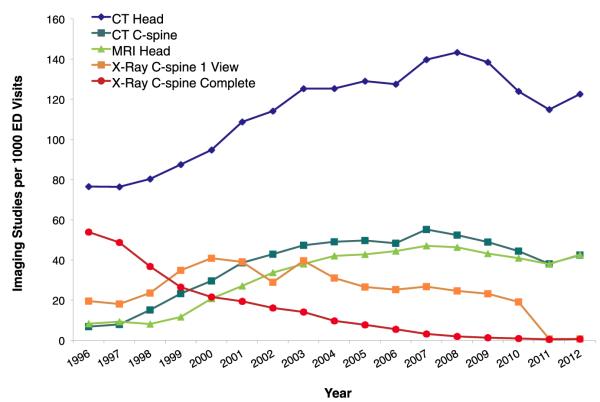
Among head and neck examinations (Fig. 5), head CT (mainly noncontrast) was the most commonly ordered examination throughout the investigation and showed significantly decreased growth from 2004 to 2012. MRI of the head showed decreased growth that approached statistical significance. Complete cervical spine radiographic examinations (5-view) were replaced by a combination of cervical spine CT with a one-view lateral cervical spine radiograph for subluxation and eventually replaced by cervical spine CT only.
Fig 5.
Volume of head and neck emergency department (ED) imaging examinations per 1,000 ED patient visits. C-spine = cervical spine.
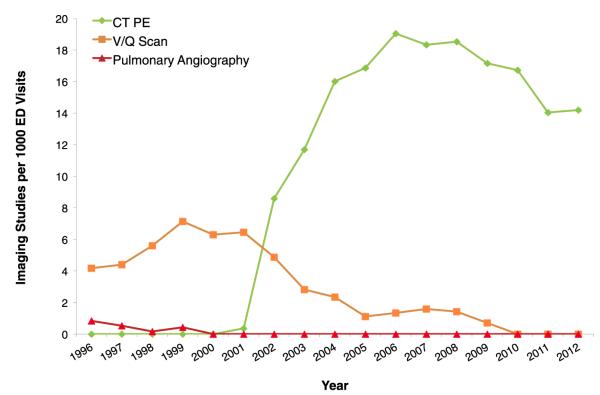
Figure 6 displays the trends of common imaging techniques used for diagnosis of pulmonary embolism (PE). CT for PE replaced ventilation-perfusion nuclear and pulmonary angiography starting in 2002.
Fig 6.
Volume of emergency department (ED) imaging examinations per 1,000 ED patient visits indicated for the diagnosis of pulmonary embolism (PE). V/Q = ventilation-perfusion.
DISCUSSION
In this study, representing a large academic level I trauma center, the overall average annual rate of ordered imaging studies per ED visits significantly decreased between 1996 to 2003 and 2004 to 2012 (Table 1). Furthermore, post hoc analysis by modality revealed that CT and MRI utilization showed significantly decreased growth during the recent time period.
In the current climate of health care reform and radiation safety, there is a heightened need to control the rate of ED imaging utilization in the face of continual growth nationally. Unlike outpatient imaging, ED imaging utilization is usually not limited by radiology benefit managers or accountable care organizations. Increased imaging utilization is also often pushed by a continual rise in patient visits to the ED nationally [19], a trend we are experiencing at our own institution. Nevertheless, there may be conditions unique to our institution that explain the decreasing growth of imaging utilization. Causes of imaging utilization are multifactorial, and many variables remain unmeasured, so we must emphasize that the associated trends we observed should first be considered correlative before being considered causative of imaging utilization. We identify 3 important factors that may explain significantly decreased growth between 1996 to 2003 and 2004 to 2012: (1) lack of new imaging indications, (2) adoption of practice guidelines, and (3) increased use of ultrasound.
From 1996 to 2003, we experienced sharp growth in CT and MRI utilization, during which time new technology and protocols were introduced, and therefore new imaging indications were being established. Helical CT was introduced during the early 1990s and overcame barriers for image resolution, acquisition time, and patient motion, such that CT became the primary diagnostic tool for a wide range of new clinical indications in the ED [7]. CT for the diagnosis of PE is a useful case demonstration of how helical CT created a new clinical application and caused rapid expansion during the early study period (Fig. 6). CT replaced nuclear medicine and pulmonary angiography for the diagnosis of pulmonary embolism starting in 2000 and became utilized to levels beyond these other prior modalities. With time, utilization of CT for diagnosis of PE also stabilized, and this may reflect the natural plateau a new technology achieves after its introduction.
From 2004 to 2012, there were no new major clinical indications for advanced imaging in the ED at our institution. Rather, advances during this time (eg, 16-slice to 64-slice CT) provided only relatively modest gains in resolution and patient throughput but did not translate into new major clinical applications utilized for common ED presentations. This includes cardiac CT, which is infrequently performed at our institution, primarily for research purposes at this time. The addition of new scanners may have spurred some growth (eg, a second CT scanner installed in 2001 and a new MRI scanner installed in 2003), but additional inpatient scanners were always available throughout the entire study period when wait times exceeded 1 hour.
There is also a simultaneous effort on the part of our emergency medicine and trauma surgery colleagues to utilize ED imaging more effectively. There is a greater awareness and adherence with guidelines to order imaging examinations appropriately, many of which were published at or just preceding 2004 to 2012, and we would expect the impact of these guidelines on utilization to occur in the recent study period. Beyond ACR appropriateness guidelines created initially in 1990s, the main guidelines to cause widespread awareness among ED providers include head trauma (eg, the New Orleans criteria published in 2000 [20]), cervical spine trauma (eg, the National Emergency X-Radiography Utilization Study criteria published in 2000 [21]), and PE (eg, the Wells criteria published in 2001 [22]). As an academic institution, our emergency medicine and surgery colleagues are frequently exposed to these issues through continuing medical education, resident core curriculum, and the Choosing Wisely campaign. The presence of a dedicated ED radiology department within the ED allows easy accessibility and frequent discussions about appropriate imaging. This has also helped raise awareness on ionizing radiation [23], health care costs, defensive medicine behaviors [14], and incidental lesions [24]. With regard to ordering CT for the diagnosis of PE, we have implemented clinical decision support tools at our hospital that displays D-dimer laboratory information, requires input of the Wells criteria, and outputs the recommendation for CT for PE. The ED department tracks adherence to head CT and CT for PE guidelines by individual physicians and provides feedback as appropriate. These guidelines now form new contracts for ED faculty members through bonuses and selected pay-for-performance (P4P) measures, which occurred in parallel with the introduction of outpatient P4P contracts in 2004. Outpatient P4P may also influence ordering behavior in the ED among providers who work across multiple care settings.
Concurrently, the ED developed a formal ultrasound training program in 2004 to improve bedside point of care. From 2004 to 2012, we observed decreased utilization of abdominal and pelvic CT and MRI studies, which may have been a result of continual growth in radiology-performed ultrasound and ED-performed focused assessment with sonography in trauma during the recent time period (Fig. 4). We did not analyze other ED-performed ultrasound examinations (eg, limited abdomen or chest examinations) because of limited longitudinal data, but the preliminary results appear to show a similar trend of increased ultrasound utilization. The increased familiarity with the modality may have led to an increased reliance on ultrasound (both radiology performed and ED physician performed) for clinical decision making and forgoing ordering CT and MRI examinations [25]. This would not decrease overall utilization but would shift utilization away from more costly, resource-intensive, and potentially harmful examinations that involve radiation and contrast.
The main limitation of our study is that we are unable to establish causality for the observed recent decreased utilization of imaging. For example, compliance with practice guidelines does not consistently reduce imaging utilization [26]. There may be other unmeasured, systemic factors that contributed to changes in utilization. The introduction of a statewide universal health care system in 2006 may have shifted some ED visits to alternative health care settings [27]. However, unlike the rest of the state, we experienced a continual increase in ED patient visits at our institution. Finally, we are not able to comment to what extent the volume of studies ordered is clinically beneficial. As a large level I trauma hospital and tertiary referral academic center experiencing almost 100,000 ED patient visits annually, we have a busy ED service composed of a larger proportion of high-acuity patients and high-complexity transfers. We have an increased rate of hospital admissions (25%) than the national average (13%) [28] and consequently a higher rate of utilization. For example, in 2010, the proportion of ED visits in which CT was ordered at our institution was 29%, compared with the national average of 17% [28]. High overall volume cannot necessarily be criticized as overutilization without comparing case complexity and measuring benefit through positivity rates of examinations and its effects on care [10,29]. Increased utilization of advanced imaging modalities such as CT or MRI increases certainty and speed of diagnosis and treatment and potentially avoids other tests or unnecessary invasive procedures [11,30,31].
CONCLUSIONS
Our results demonstrate that ED imaging growth significantly decreased at a single level I trauma center in a large urban city from 2004 to 2012. This decrease was further observed within advanced imaging modalities such as CT and MRI. Our results may be explained by a slowing in new imaging indications, greater adherence to practice guidelines, and increased utilization of ultrasound. This implies that the recent growth of emergency diagnostic imaging may now be driven primarily by increasing ED patient visits rather than overutilization.
TAKE-HOME POINTS.
 ED imaging growth significantly decreased at a single level I trauma center in a large urban city from 2004 to 2012.
 The recent decrease in ED imaging growth and CT and MRI utilization at our institution may be a result of a slowing of new imaging indications, greater adherence to practice guidelines, and increasing use of ultrasound.
 Although the national health care discussion focuses on continual ED imaging growth, we demonstrate that decreasing ED imaging utilization was achievable at our institution.
ACKNOWLEDGMENTS
We thank Della Abedi-Tari, Tracy Chen, Michelle Baxter, and Jonathan Hernandez for their assistance in data collection.
This report was orally presented at the 99th annual meeting of the RSNA on December 3, 2013. This research was supported by grant TL1 RR024129 from the National Institutes of Health (Bethesda, Maryland). The views expressed are those of the study authors alone and not an official position of the affiliated institutions or funding source.
REFERENCES
- 1.Medicare Payment Advisory Commission [Accessed December 4, 2014];Report to the Congress: improving incentives in Medicare. Available at: http://www.medpac.gov/documents/reports/Jun09_EntireReport.pdf?sfvrsn=0.
- 2.Iglehart JK. Health insurers and medical-imaging policy—a work in progress. N Engl J Med. 2009;360:1030–7. doi: 10.1056/NEJMhpr0808703. [DOI] [PubMed] [Google Scholar]
- 3.Levin DC, Rao VM. Turf wars in radiology: the overutilization of imaging resulting from self-referral. J Am Coll Radiol. 2004;1:169–72. doi: 10.1016/j.jacr.2003.12.009. [DOI] [PubMed] [Google Scholar]
- 4.Williams RM. The costs of visits to emergency departments. N Engl J Med. 1996;334:642–6. doi: 10.1056/NEJM199603073341007. [DOI] [PubMed] [Google Scholar]
- 5.Williams RM. Distribution of emergency department costs. Ann Emerg Med. 1996;28:671–6. doi: 10.1016/s0196-0644(96)70092-6. [DOI] [PubMed] [Google Scholar]
- 6.Bhargavan M, Sunshine JH. Utilization of radiology services in the United States: levels and trends in modalities, regions, and populations. Radiology. 2005;234:824–32. doi: 10.1148/radiol.2343031536. [DOI] [PubMed] [Google Scholar]
- 7.Novelline RA, Rhea JT, Rao PM, Stuk JL. Helical CT in emergency radiology. Radiology. 1999;213:321–39. doi: 10.1148/radiology.213.2.r99nv01321. [DOI] [PubMed] [Google Scholar]
- 8.Ginde AA, Foianini A, Renner DM, Valley M, Camargo CA., Jr Availability and quality of computed tomography and magnetic resonance imaging equipment in U.S. emergency departments. Acad Emerg Med. 2008;15:780–3. doi: 10.1111/j.1553-2712.2008.00192.x. [DOI] [PubMed] [Google Scholar]
- 9.Broder J, Warshauer DM. Increasing utilization of computed tomography in the adult emergency department 2000-2005. Emerg Radiol. 2006;13:25–30. doi: 10.1007/s10140-006-0493-9. [DOI] [PubMed] [Google Scholar]
- 10.Hendee WR, Becker GJ, Borgstede JP, et al. Addressing overutilization in medical imaging. Radiology. 2010;257:240–5. doi: 10.1148/radiol.10100063. [DOI] [PubMed] [Google Scholar]
- 11.Abujudeh HH, Kaewlai R, McMahon PM, et al. Abdominopelvic CT increases diagnostic certainty and guides management decisions: a prospective investigation of 584 patients in a large academic medical center. AJR Am J Roentgenol. 2011;196:238–43. doi: 10.2214/AJR.10.4467. [DOI] [PubMed] [Google Scholar]
- 12.Henley MB, Mann FA, Holt S, Marotta J. Trends in case-mix-adjusted use of radiology resources at an urban level 1 trauma center. AJR Am J Roentgenol. 2001;176:851–4. doi: 10.2214/ajr.176.4.1760851. [DOI] [PubMed] [Google Scholar]
- 13.Brink JA, Amis ES., Jr Image Wisely: a campaign to increase awareness about adult radiation protection. Radiology. 2010;257:601–2. doi: 10.1148/radiol.10101335. [DOI] [PubMed] [Google Scholar]
- 14.Korley FK, Pham JC, Kirsch TD. Use of advanced radiology during visits to US emergency departments for injury-related conditions 1998-2007. JAMA. 2010;304:1465–71. doi: 10.1001/jama.2010.1408. [DOI] [PMC free article] [PubMed] [Google Scholar]
- 15.Larson DB, Johnson LW, Schnell BM, Salisbury SR, Forman HP. National trends in CT use in the emergency department: 1995-2007. Radiology. 2011;258:164–73. doi: 10.1148/radiol.10100640. [DOI] [PubMed] [Google Scholar]
- 16.Levin DC, Rao VM, Parker L. The recent downturn in utilization of CT: the start of a new trend? J Am Coll Radiol. 2012;9:795–8. doi: 10.1016/j.jacr.2012.05.023. [DOI] [PubMed] [Google Scholar]
- 17.Hess EP, Haas LR, Shah ND, Stroebel RJ, Denham CR, Swensen SJ. Trends in computed tomography utilization rates: a longitudinal practice-based study. J Patient Saf. 2014;10:52–8. doi: 10.1097/PTS.0b013e3182948b1a. [DOI] [PubMed] [Google Scholar]
- 18.Lee J, Kirschner J, Pawa S, Wiener DE, Newman DH, Shah K. Computed tomography use in the adult emergency department of an academic urban hospital from 2001 to 2007. Ann Emerg Med. 2010;56:591–6. doi: 10.1016/j.annemergmed.2010.05.027. [DOI] [PubMed] [Google Scholar]
- 19.Tang N, Stein J, Hsia RY, Maselli JH, Gonzales R. Trends and characteristics of US emergency department visits 1997-2007. JAMA. 2010;304:664–70. doi: 10.1001/jama.2010.1112. [DOI] [PMC free article] [PubMed] [Google Scholar]
- 20.Haydel MJ, Preston CA, Mills TJ, Luber S, Blaudeau E, DeBlieux P. Indications for computed tomography in patients with minor head injury. N Engl J Med. 2000;343:100–5. doi: 10.1056/NEJM200007133430204. [DOI] [PubMed] [Google Scholar]
- 21.Hoffman JR, Mower WR, Wolfson AB, Todd KH, Zucker MI. Validity of a set of clinical criteria to rule out injury to the cervical spine in patients with blunt trauma. National Emergency X-Radiography Utilization Study Group. N Engl J Med. 2000;343:94–9. doi: 10.1056/NEJM200007133430203. [DOI] [PubMed] [Google Scholar]
- 22.Wells PS, Anderson DR, Rodger M, et al. Excluding pulmonary embolism at the bedside without diagnostic imaging: management of patients with suspected pulmonary embolism presenting to the emergency department by using a simple clinical model and d-dimer. Ann Intern Med. 2001;135:98–107. doi: 10.7326/0003-4819-135-2-200107170-00010. [DOI] [PubMed] [Google Scholar]
- 23.Smith-Bindman R, Lipson J, Marcus R, et al. Radiation dose associated with common computed tomography examinations and the associated lifetime attributable risk of cancer. Arch Intern Med. 2009;169:2078–86. doi: 10.1001/archinternmed.2009.427. [DOI] [PMC free article] [PubMed] [Google Scholar]
- 24.Casarella WJ. A patient’s viewpoint on a current controversy. Radiology. 2002;224:927–7. doi: 10.1148/radiol.2243020024. [DOI] [PubMed] [Google Scholar]
- 25.Sheng AY, Dalziel P, Liteplo AS, Fagenholz P, Noble VE. Focused assessment with sonography in trauma and abdominal computed tomography utilization in adult trauma patients: trends over the last decade. Emerg Med Intern. 2013;2013:1–7. doi: 10.1155/2013/678380. [DOI] [PMC free article] [PubMed] [Google Scholar]
- 26.Stiell IG, Clement CM, Grimshaw JM, et al. A prospective cluster-randomized trial to implement the Canadian CT head rule in emergency departments. CMAJ. 2010;182:1527–32. doi: 10.1503/cmaj.091974. [DOI] [PMC free article] [PubMed] [Google Scholar]
- 27.Miller S. The effect of insurance on emergency room visits: an analysis of the 2006 Massachusetts health reform. J Pub Econ. 2012;96:893–908. [Google Scholar]
- 28.National Center for Health Statistics National Hospital Ambulatory Medical Care Survey: 2010 Emergency Department Summary. Tables. 2013:1–33. [Google Scholar]
- 29.Baker LC, Atlas SW, Afendulis CC. Expanded use of imaging technology and the challenge of measuring value. Health Aff (Millwood) 2008;27:1467–78. doi: 10.1377/hlthaff.27.6.1467. [DOI] [PubMed] [Google Scholar]
- 30.Rhea JT, Halpern EF, Ptak T, Lawrason JN, Sacknoff R, Novelline RA. The status of appendiceal CT in an urban medical center 5 years after its introduction: experience with 753 patients. AJR Am J Roentgenol. 2005;184:1802–8. doi: 10.2214/ajr.184.6.01841802. [DOI] [PubMed] [Google Scholar]
- 31.Raman SS, Osuagwu FC, Kadell B, Cryer H, Sayre J, Lu DSK. Effect of CT on false positive diagnosis of appendicitis and perforation. N Engl J Med. 2008;358:972–3. doi: 10.1056/NEJMc0707000. [DOI] [PubMed] [Google Scholar]


