

Abstract
Objective
Neurodegenerative and cerebrovascular conditions are common in old age and are associated with cognitive decline. However, considerable heterogeneity remains in residual decline (i.e., person specific trajectories of cognitive decline adjusted for these common neuropathologic conditions). The present study aimed to characterize profiles of residual decline in late life cognition.
Method
Up to 19 waves of longitudinal cognitive data were collected from 876 autopsied participants from two ongoing clinical-pathologic cohort studies of aging. Uniform neuropathologic examinations quantified measures of Alzheimer's disease, cerebral infarcts, Lewy body disease, and hippocampal sclerosis. Random effects mixture models characterized latent profiles of residual decline in global cognition.
Results
We identified four latent groups, and each group demonstrated distinct residual decline profiles. On average, 44% of the participants had little or no decline, 35% showed moderate decline, 13% showed severe decline and the rest (8%) had substantial within-subject fluctuation of longitudinal cognitive measures. These latent groups differed in psychological, experiential and neurobiologic factors that have been previously shown to be associated with cognitive decline. Specifically, compared with non-decliners, decliners had more depressive symptoms, were more socially isolated; were less engaged in cognitive or physical activities; and had lower density of noradrenergic neurons in locus ceruleus.
Conclusions
After controlling for common dementia related pathologies, considerable residual variability remains in cognitive aging trajectories and this variability is not random but rather is related to markers of cognitive and neural reserve. The mixture modeling approach provides a powerful tool to identify latent groups with distinct cognitive trajectories.
Keywords: Cognitive aging, Common neuropathologies, Residual decline, Random effects mixture model, Reserve
Introduction
Loss of cognition in late life poses a major public health challenge. Identifying profiles of cognitive aging is essential to develop strategies for preventing or delaying cognitive impairment and dementia. Some literature suggests that cognitive decline is intrinsic to the aging process and affects everyone [Salthouse 2004, Salthouse 2012]. Other literature, however, emphasizes that much of between-person variability is extrinsic and cognitive decline is not an inevitable feature of aging [Rowe & Kahn 1987, Deary et al 2009].
There is considerable heterogeneity in cognitive trajectories where some people remain stable, some decline slowly and others decline fast [Hayden et al 2011]. Common neuropathologic conditions, e.g. Alzheimer's disease (AD), cerebral infarcts and Lewy body disease, are important contributing factors to such heterogeneity. Burdens of various pathologies on cognition are in general independent and additive [Launer et al 2008, Sonnen et al 2007, Troncoso et al 2008]. Subclinical pathologies [Morris et al 1996, Sperling et al 2011, Bennett et al 2012, Hedden et al 2012] and mixed pathologies [Kovacs et al 2008, Fotuhi et al 2009] are common. Notably, these pathologic indices explain less than half (approximately 40%) of the variation in person-specific rates of cognitive change [Boyle et al 2013]. Substantial heterogeneity remains in residual cognitive decline, that is, person-specific change in cognition above and beyond the influence of common pathologic indices.
In this study, we seek to determine whether there are distinct profiles of residual cognitive aging by leveraging both cognitive and neuropathologic data from two large community-based cohort studies of aging. Longitudinal cognitive measures were collected from approximately 900 participants who were followed each year, died and underwent brain autopsy. Uniform neuropathologic examinations quantified measures of AD, infarcts, Lewy body disease, and hippocampal sclerosis. We used a random effects mixture model to identify latent groupings with distinct signatures of residual decline. A similar modeling approach was previously applied to investigate heterogeneity of longitudinal trajectories of the Mini Mental State Examination (MMSE) in a French cohort of 3,337 older persons [Proust & Jacqmin-Gadda 2005]. We described the distinct profile of ‘residual’ cognitive trajectory in each group and tested whether these latent groups differed in previously identified markers of cognitive and neural reserve.
Methods
Study participants
Data come from two ongoing large, longitudinal clinical-pathologic cohort studies of aging: the Religious Orders Study (ROS) and the Rush Memory and Aging Project (MAP) [Bennett et al 2012, Bennett et al 2012]. Both studies are approved by the Institutional Review Board of Rush University Medical Center. Participants agree to annual clinical evaluations and brain donation upon death. Conducted by the same team of investigators, the two studies share a large common core of measures designed to allow efficient merging of the data. Since January 1994, over 2,800 participants have completed the baseline evaluation. The overall clinical follow-up exceeds 95% and the autopsy rate exceeds 90%.
At the time of these analyses, 876 participants had died with two or more clinical evaluations required to estimate the residual cognitive decline, and had autopsy data. All participants were free of dementia at baseline. At their last clinical evaluation, 294 (34.0%) remained cognitively normal, 231 (26.7%) developed mild cognitive impairment, and 340 (39.3%) developed dementia. The mean age at baseline was 80.3 years (standard deviation [SD] = 6.9; range: 59.0–102.1), the mean education was 16.5 years (SD = 3.6; range: 3-30), and 66.1% were females and 95.4% were non-Hispanic whites. The average length of follow up was 6.9 years (SD=3.9, range 1-18).
Cognitive evaluations
Up to 19 waves of longitudinal data on cognitive function were available from ROS and MAP cohorts. Each participant underwent structured, annual clinical evaluations that included 17 cognitive tests. These tests assess a broad range of cognitive processes commonly affected by aging. To minimize random variability as well as floor and ceiling artifacts, raw scores on each test were standardized using the mean and SD from the baseline evaluation. Individual standardized test scores were then averaged to yield a composite score of global cognition. Higher scores indicate better cognitive performance. Psychometric properties of the summary score were described previously [Wilson et al 2002].
Neuropathology measures
Details of neuropathologic evaluation have been previously reported [Bennett et al 2004]. Briefly, brains were removed on average 8.3 hours (SD=7.1 hours) after death using a standard protocol. Cerebral hemispheres were cut into 1cm coronal slabs, and slabs from one hemisphere were fixed (paraformaldehyde) and dissected for diagnostic purpose. Using immunohistochemical staining and computer assisted sampling, paired helical filament tau (PHFtau) neuronal neurofibrillary tangle density per mm2 in 8 cortical regions were determined and averaged within and across brain regions. Beta amyloid plaque deposition was quantified by image analysis; however, since amyloid association with change in cognition is largely mediated by tau tangles [Bennett et al 2004], we excluded amyloid from the current analyses to ensure parsimonious models. Macroscopic infarcts were determined by gross examination of both hemispheres and verified after dissection and histologic review [Schneider et al 2005]. The presence of neocortical Lewy bodies was identified with antibodies to α-synuclein [Schneider et al 2012]. Hippocampal sclerosis was examined on hematoxylin and eosin stain and defined by severe neuronal loss in the hippocampus and/or subiculum. Throughout the analysis, binary measures (present versus absent) were used for macroscopic infarcts, Lewy bodies and hippocampal sclerosis. The neuropathologic assessment was performed by persons blinded to all clinical data.
Cognitive and neural reserve markers
Cognitive and neural reserve markers refer to psychological, experiential and neurobiologic factors that are associated with increased or decreased rates of cognitive decline, either independent of common neuropathologies or as modifiers of the association of neuropathologies with cognition. We examined group differences in a set of reserve markers that have been previously shown to be associated with cognitive decline. These include cognitive reserve markers of depressive symptoms [Wilson et al 2014], purpose in life [Boyle et al 2010]; social isolation [Wilson et al 2007], cognitive activity [Wilson et al 2002; 2012], social activity [James et al 2011], and physical activity [Buchman et al 2012]; as well as a neural reserve marker of tyrosine-hydroxylase-immunoreactive neuronal density in brainstem [Wilson et al 2013].
Statistical analysis
To examine how cognition changes over time, we analyzed longitudinal cognitive measures over multiple years prior to death using a random effects mixture model [Verbeke & Lesaffre 1996, Proust & Jacqmin-Gadda 2005]. While a linear mixed model is helpful in estimating the extent to which common neuropathologies contribute to the cognitive decline, it assumes homogeneity in person-specific residual decline. As contrast, a latent class approach is well suited to characterize the heterogeneity, and mixture models are essential in modeling these latent classes empirically and without any prior assumptions about groupings [Verbeke & Lesaffre 1996, Roeder et al 1999, Proust & Jacqmin-Gadda 2005, Dodge et al 2008]. To our knowledge, the approach has not been used to model residual cognitive decline.
The basic model is specified below. Here, the dependent variable, yij, is the observed longitudinal measure of cognition for subject i at visit j, where i = 1…m with m the total number of subjects and j = 1…ni with ni the last visit for subject i.
Independent variables agei, sexi and educationi are age at baseline, sex and years of education for subject i. For ease of interpretation, age at baseline was centered at 80 years and education was centered at 16 years. timeij refers to time in years since baseline for subject i at visit j. We included the quadratic terms to capture potential nonlinear cognitive decline in later life.
αk and βk are the fixed effects. Specifically, α1, α2 and α3 estimate the association of baseline age, sex and education with baseline level of cognition (intercept). β1, β2 and β3 estimate the association of baseline age, sex and education with linear decline in cognition. β4, β5 and β6 estimate the association of these variables with quadratic decline. The associations of neuropathologic indices with the trajectory of cognitive decline were analyzed similarly by adding corresponding terms to the basic model.
γi are the random effects for subject i. Random effects are introduced to account for individual specific deviations from the mean trajectories. Regular linear mixed models in general assume the random effects γi are homogeneous and follow the same distribution,
Here, μ0 is the mean intercept and is interpreted as the baseline level of cognition for an average female who enrolled at age 80 and had 16 years of education. μ1 and μ2 refer to the linear and quadratic coefficients of decline in cognition for the same average female participant. The matrix refers to the covariance structure of the random effects.
First, we fit three linear mixed models to examine heterogeneity of person specific change in cognition and the influence of demographics and neuropathologies on the rate of change. Model 1 contains no covariates, Model 2 is adjusted for age at baseline, sex, and education, and Model 3 is further adjusted for the indices of common neuropathologies.
Next, in order to capture the heterogeneity of the residual cognitive decline, we extended the model by having the random effects follow a mixture distribution with K latent classes,
where πk refers to the probability for kth latent class and satisfies 0 ≤ πk ≤ 1, . For model simplicity, we constrained the variance covariance matrix to be . The optimal number of latent classes K was selected based on the fit statistics of Akaike's Information Criterion (AIC) and Bayesian Information Criterion (BIC). Both statistics (the smaller the better) introduce a penalty term for the number of parameters in the maximized model likelihood so as to balance between fitness and parsimony in model selection and reduce the chances of overfitting the data. We also evaluated our choice of K by using Lo-Mendell-Rubin adjusted Likelihood Ratio Test (LMR-LRT). Participants were subsequently classified into K groups based on posterior probabilities estimated from the model.
Random effects mixture models were fit using Mplus [Muthen and Muthen 1998-2012]. In order to improve the model convergence and avoid local maxima, we applied 1000 random sets of starting values and optimized using 100 sets with the highest likelihood values so as to ensure that the maximum model likelihood are replicable under different sets of starting values. Other analyses were done using SAS software, version 9.3 (SAS Institute, Cary, NC) and R version 3.0.1 (www.r-project.org).
Results
Heterogeneity of person specific change in cognition
We started with the models without mixture (K=1) to examine the influence of age at baseline and common neuropathologies on the change in cognition, adjusted for sex and education (Table 1). As shown in Model 1, on average, there was a significant decline in cognition over time (μ1, estimate[EST] = -.034, standard error [SE] =.006, p<.001; and μ2, EST = -.010, SE =.0003, p<.001). There was substantial variation in person-specific trajectories in cognition with some persons exhibiting moderate to steep decline, some declining more slowly, and others remaining relatively stable (Figure 1). Some of this variation was attributable to demographics and common neuropathologic variables (Table 1, Model 3). Older baseline age was associated with a lower level of cognition (α1, EST=-.022, SE=.002, p<.001) and faster rate of decline (β1, EST=-.002, SE=.001, p=.027, and β4, EST=-.0002, SE=.00006, p<.001). Separately, tau tangle density, macroscopic infarcts, neocortical Lewy bodies, and hippocampal sclerosis were each independently associated with a faster rate of decline in cognition (Figure S1). After adjustment for demographic and common neuropathologic variables, the variance of the residual slopes shrunk by approximately a third, yet substantial variability remained.
Table 1. Association with change in global cognition from the models without mixture (K=1).
| Model 1 Estimate (SE, p) | Model 2 Estimate (SE, p) | Model 3 Estimate (SE, p) | |
|---|---|---|---|
| Fixed Effects on baseline level (intercept) | |||
| Age at baseline (α1) | - | -.024 (.002, <.001) | -.022 (.002, <.001) |
| Male sex (α2) | - | -.054 (.035, .120) | -.074 (.034, .030) |
| Education (α3) | - | .034 (.005, <.001) | .033 (.004, <.001) |
| τ tangle density | - | - | -.016 (.002, <.001) |
| Macroscopic infarcts | - | - | -.067 (.033, .042) |
| Cortical Lewy bodies | - | - | -.027 (.049, .586) |
| Hippocampal sclerosis | - | - | -.099 (.057, .083) |
| Fixed Effects on decline (slope) | |||
| Age at baseline (β1) | - | -.002 (.0001, .006) | -.002 (.0008, .027) |
| Male sex (β2) | - | .006 (.013, .639) | -.004 (.012, .728) |
| Education (β3) | - | .003 (.002, .077) | .003 (.002, .040) |
| τ tangle density | - | - | -.006 (.001, <.001) |
| Macroscopic infarcts | - | - | .005 (.011, .664) |
| Cortical Lewy bodies | - | - | -.024 (.016, .138) |
| Hippocampal sclerosis | - | - | -.007 (.018, .716) |
| Fixed Effects on decline (quadratic) | |||
| Age at baseline (β4) | - | -.0003 (.0001, <.001) | -.0002 (.0001, <.001) |
| Male sex (β5) | - | .0005 (.0007, .492) | .0005 (.0007, .476) |
| Education (β6) | - | -.0002 (.0001, .032) | -.0002 (.0001, .039) |
| τ tangle density | - | - | -.0004 (.0001, <.001) |
| Macroscopic infarcts | - | - | -.003 (.001, <.001) |
| Cortical Lewy bodies | - | - | -.006 (.001, <.001) |
| Hippocampal sclerosis | - | - | -.003 (.001, .004) |
| Random Effects | |||
| Mean Intercept (μ0) | -.003 (.018, .863) | .001 (.020, .944) | .134 (.027, <.001) |
| Variance ( ) | .219 (.012, <.001) | .173 (.010, <.001) | .163 (.010, <.001) |
| Mean Linear (μ1) | -.034 (.006, <.001) | -.032 (.007, <.001) | .006 (.009, .497) |
| Variance ( ) | .018 (.001, <.001) | .017 (.001, <.001) | .012 (.001, <.0001) |
| Covariance (σ12) | .017 (.003, <.001) | .010 (.002, <.001) | .006 (.002, .004) |
| Mean Quadratic (μ2) | -.010 (.0003, <.001) | -.011 (.0005, <.001) | -.006 (.0007, <.001) |
| Residuals Variance | .088 (.002, <.001) | .087 (.002, <.001) | .086 (.002, <.001) |
SE: Standard error.
Figure 1. Trajectory of cognitive decline from a model without mixture (K=1).
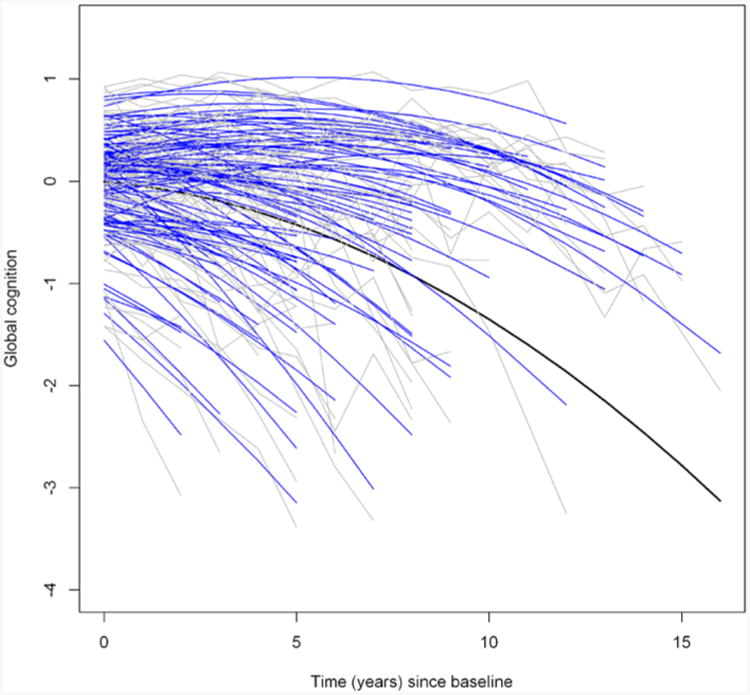
The figure shows the raw cognitive data (gray) and fitted values (blue) from a linear mixed model (k=1) for a random sample of 100 participants. The black curve corresponds to the fitted mean trajectory.
Profiles of residual decline in cognition
To further characterize the remaining heterogeneity of cognitive decline, we fit a series of random effects mixture models to the data. The number of latent groups (K) in the mixture was determined by using a forward-selection approach (Figure 2). Briefly, we started with the model with no mixture (K=1), which yielded an AIC statistic of 6576 and a BIC statistic of 6709. As we increased the number of mixture (K), the model fit statistics improved gradually until they leveled off at K=4 (AIC=4623, and BIC=4872). Lo-Mendell-Rubin adjusted Likelihood Ratio Test for the model with K=5 suggested that a 4 class model was sufficient (Value=81.71, p=0.118).
Figure 2. Comparison of models with different number of latent classes (K).
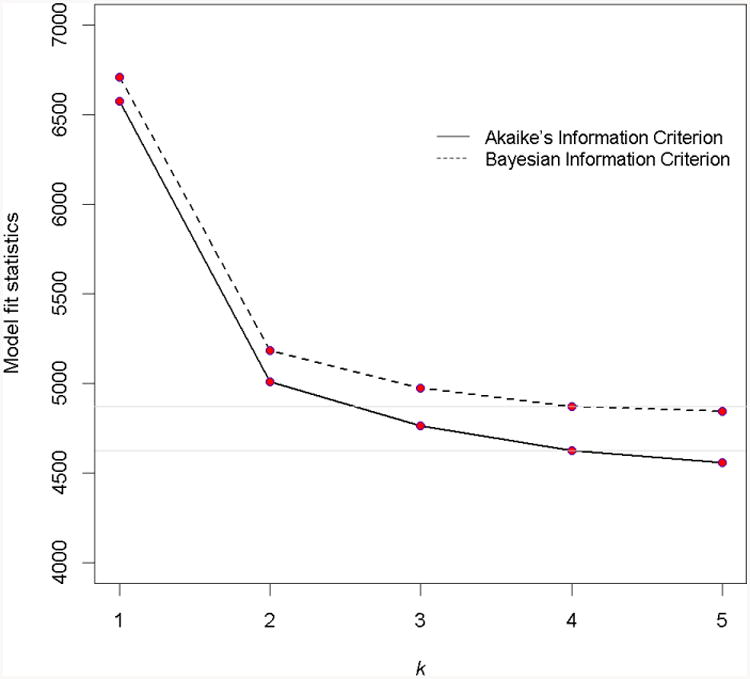
The figure shows the values of model fit statistics of AIC and BIC decrease and level off at k=4
Figure 3 and Table 2 illustrate the cognitive profiles of the four groups identified by the 4-class mixture model. The first latent group (non-decliners) consisted of 44.4% (n=389) of the participants who exhibited little to no decline in cognition during follow-up. The second group (moderate decliners) consisted of 34.7% (n=304) of the participants. The third group (severe decliners) consisted of 13.0% of participants (n=114). Notably, the linear coefficients (μ1) of the trajectories for the two declining groups were both positive. As a result, these declines were mild in the beginning and accelerated sometime thereafter. Finally, the fourth group consisted of 7.9% of participants (n=69). In addition to an overall pattern of decline, the cognitive trajectory in the fourth group was characterized by a substantially larger within-subject residual variance, suggesting that the longitudinal cognitive measures in these participants had large fluctuation.
Figure 3. Distinct profiles of cognitive decline by latent groups.
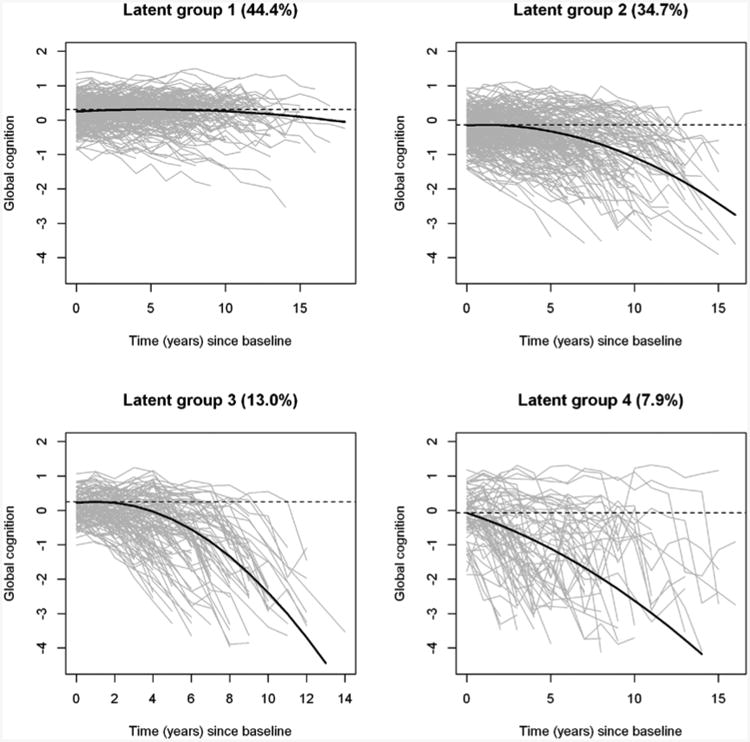
The figure shows the observed longitudinal global cognitive trajectories (gray) for the participants, as well as model derived mean trajectories (black), by latent groups.
Table 2. Estimates of change in cognition from the mixture model (K=4).
| Group 1 (N=389) Estimate (SE, p) | Group 2 (N=304) Estimate (SE, p) | Group 3 (N=114) Estimate (SE, p) | Group 4 (N=69) Estimate (SE, p) | |
|---|---|---|---|---|
| Intercept (μ0) | .227 (.032, <.001) | -.067 (.048, .162) | .165 (.049, .001) | -.068 (.082, .404) |
| Variance ( ) | .107 (.013, <.001) | .178 (.024, <.001) | .055 (.024, .020) | .261 (.065, <.001) |
| Linear (μ1) | .022 (.007, .002) | .024 (.018, .180) | .073 (.030, .016) | -.133 (.049, .007) |
| Variance ( ) | .0008 (.0002, <.001) | .007 (.002, <.001) | .018 (.005, <.001) | .028 (.013, .036) |
| Covariance (σ12) | .002 (.001, .167) | .012 (.004, .003) | .004 (.006, .484) | .007 (.016, .647) |
| Quadratic (μ2) | -.002 (.001, .005) | -.012 (.002, <.001) | -.034 (.004, <.001) | -.010 (.004, .013) |
| Residuals Variance | .031 (.002, <.001) | .055 (.007, <.001) | .090 (.015, <.001) | .355 (.052, <.001) |
Table 3 reports the demographic and neuropathologic characteristics of the four groups, including the summary statistics for each group and comparison results for overall group differences. In general, decliners (Group 2, 3, and 4) were older and had a greater pathologic burden at autopsy compared to non-decliners. Participants in Group 4 had the highest proportion of neocortical Lewy bodies and macroscopic infarcts, which likely contributed to the large residual variance observed in this group. We previously reported that neocortical Lewy body pathology is associated with fluctuations in cognitive decline [Schneider et al 2012].
Table 3. Demographic, clinical, and pathologic characteristics by latent groups.
| Mean (SD) or N (%) | Group 1 (N=389) | Group 2 (N=304) | Group 3 (N=114) | Group 4 (N=69) | p-value |
|---|---|---|---|---|---|
| Study (ROS) | 214 (55.0%) | 158 (52.0%) | 55 (48.3%) | 44 (63.8) | 0.1862 |
| # follow-up years | 7.1 (4.2) | 6.6 (3.8) | 6.9 (2.7) | 7.2 (4.0) | .5173 |
| Age at baseline (in years) | 79.3 (6.9) | 81.2 (6.6) | 81.4 (7.1) | 79.6 (6.6) | <.0011 |
| Age at death (in years) | 87.4 (6.5) | 89.0 (6.5) | 89.6 (6.6) | 88.1 (6.5) | .0011 |
| Male sex | 143 (36.7%) | 107 (35.2%) | 29 (25.4%) | 18 (26.1%) | .0672 |
| Education (in years) | 16.5 (3.6) | 16.4 (3.6) | 16.3 (3.5) | 17.0 (4.4) | .5151 |
| Baseline cognition | 0.17 (0.4) | -0.29 (0.5) | 0.06 (0.4) | -0.16 (0.7) | <.0011 |
| Pathologic AD | 188 (48.3%) | 205 (67.4%) | 98 (86.0%) | 46 (66.7%) | <.0012 |
| Macroscopic infarcts | 109 (28.0%) | 110 (36.2%) | 47 (41.2%) | 37 (53.6%) | <.0012 |
| Neocortical Lewy bodies | 26 (6.7%) | 38 (12.5%) | 21 (18.4%) | 17 (24.6%) | <.0012 |
| Hippocampal sclerosis | 16 (4.1%) | 34 (11.2%) | 15 (13.2%) | 5 (7.3%) | .0012 |
Demographic and clinical measures are taken at study baseline except for age at death; and pathology measures are taken at autopsy.
SD: Standard deviation.
ANOVA (df=3);
Chi Square (df=3);
Kruskal-Wallis Test (df=3).
Difference in reserve between latent groups
Ultimately, prevention of cognitive decline in old age requires an understanding of the determinants of the distinct profiles of residual decline. Therefore, we examined the group differences in cognitive and neural reserve markers that have previously been shown to be associated with cognitive decline in old age. Table 4 shows the comparisons between the groups.
Table 4. Psychological, experiential, and resilience risk factors by latent groups.
| Risk factors | Group 1 (N=389) | Group 2 (N=304) | Group 3 (N=114) | Group 4 (N=69) | p** |
|---|---|---|---|---|---|
|
| |||||
| Depressive symptom | 1.18 (1.16) | 1.49 (1.45) | 1.65 (1.37) | 1.92 (1.81) | <.001 |
|
| |||||
| Purpose in life* | 3.61 (0.48) | 3.51 (0.46) | 3.44 (0.39) | 3.41 (0.41) | .031 |
|
| |||||
| Social isolation* | 2.26 (0.52) | 2.48 (0.55) | 2.47 (0.46) | 2.71 (0.55) | <.001 |
|
| |||||
| Cognitive activity* | 3.40 (0.77) | 3.08 (0.79) | 3.12 (0.94) | 3.02 (0.99) | .001 |
|
| |||||
| Social activity* | 2.55 (0.59) | 2.36 (0.60) | 2.38 (0.53) | 2.45 (0.47) | .015 |
|
| |||||
| Physical activity* | 2.49 (1.25) | 2.27 (1.49) | 2.14 (1.61) | 1.32 (0.84) | .005 |
|
| |||||
| Neuron density* | |||||
| locus ceruleus | 46.7 (16.5) | 38.3 (18.3) | 37.1 (20.3) | 17.5 (6.9) | <.001 |
| raffe nucleus | 105.9 (28.3) | 102.4 (28.0) | 106.0 (25.0) | 84.2 (13.0) | .306 |
| substantia nigra | 30.9 (11.5) | 32.2 (11.3) | 29.4 (13.2) | 23.5 (6.5) | .329 |
| ventral tegmental | 80.5 (43.5) | 90.0 (48.4) | 80.3 (46.5) | 80.5 (33.8) | .768 |
Group comparisons were done using non-parametric Kruskal-Wallis Test (df=3).
Data available in a subset of the sample.
p-values were assessed using adjusted α =0.05/10=0.005, corrected for the number of tests.
We observed overall group differences in psychological and experiential markers of cognitive reserve, including depressive symptoms (p<.001), social isolation (p<.001), cognitive activities (p=.001), and physical activities (p=.005). Compared with non-decliners, decliners had more depressive symptoms, were more socially isolated, and engaged in fewer cognitively stimulating or physical activities. Purpose in life and social activities were nominally significant, but did not pass the Bonferroni correction. Further, non-decliners differed in a marker of neural reserve such that decliners had lower tyrosine-hydroxylase-immunoreactive neuronal density in the locus ceruleus than non-decliners (p=.001).
Secondary analysis: model difference between studies and influence of length of follow-ups
Our primary analysis combined data from two cohorts to enhance statistical power. To examine whether results varied between the cohorts, we performed separate analyses for the ROS and MAP participants (Table S1). LMR-LRT statistics suggested that the models with K=3 were sufficient for both ROS (Value=95.45, p=0.168) and MAP (Value=42.92, p=0.328). Several reasons could contribute to this discrepancy. First, there were some difference between the participants from ROS and MAP (Table S2). In particular, participants from ROS were younger, and had longer follow-ups and a higher level of education. On the other hand, participants from the two cohorts did not differ in terms of the burden of common neuropathologies. Second, analyses of the two cohorts separately require splitting the sample size and thereby reducing power to detect effects. Importantly, the percent of participants in latent groups identified using combined analysis did not differ between ROS and MAP, and both combined and stratified analyses consistently revealed that substantial heterogeneity was present in cognitive trajectories after adjustment for common neuropathologies.
Separately, because participants can have varying lengths of follow-up, we assessed the potential influence of the number of follow-ups on the latent groupings. Thus, we refit the model by restricting to participants with relatively longer follow-ups (at least 5). The overall results, as shown in Table S3, were similar.
Discussion
Our prior work examined the extent to which pathology accounts for between subject variation in cognitive decline and estimated that less than half of the variation was accounted for by common neuropathologic conditions [Boyle et al 2013]. This suggests that substantial heterogeneity is evident in residual cognitive decline. The central question of interest in the present study was whether this heterogeneity is random and whether it could be characterized by distinct latent groups. Using data from nearly 900 autopsied older persons, we identified 4 latent groups that demonstrated distinct profiles of change in cognition. Notably participants from the largest latent group did not show cognitive decline after controlling for common neuropathologic indices; while others still exhibited various degree of decline. These latent groups differed in a range of psychological, experiential and neurobiologic markers of cognitive and neural reserve. Our findings confirm that there remains substantial heterogeneity in individual cognitive trajectories, and such heterogeneity is not random but rather is related to indices of reserve. Efforts to dissect the heterogeneity of residual cognitive decline offer a better appreciation of the complexity of cognitive aging and provide a unique opportunity to understand important determinants of late life cognitive trajectories.
The findings from this study have several important implications. First, while compelling evidence from clinical-pathologic studies has shown that pathologies of common neurodegenerative diseases are associated with late-life cognitive decline, the extent to which these neuropathologies are actually the drivers of cognitive decline remains unknown. The present results suggest that, for many participants, there is essentially little to no decline in global cognition after controlling for common pathologic indices of AD, infarcts, Lewy body disease and hippocampal sclerosis. While traditional teaching sees ‘normal’ cognitive aging as characterized by inevitable and slowly progressive decline due to developmental processes, this study offers an alternative conceptualization. Specifically, it suggests that a large proportion of cognitive decline observed among older persons is driven by the accumulation of common neuropathologies, and that cognitive aging in the absence of neuropathology is characterized by stability in cognitive function for many older persons.
Second, although a large proportion of participants exhibited no cognitive decline after controlling for common pathologies, other older participants did experience additional decline. Some of this decline likely reflects other unmeasured pathologic processes. For instance, recent evidence indicates that transactive response DNA-binding protein 43 pathology is not only seen in frontotemporal lobar degeneration and amyotrophic lateral sclerosis, but is common in aging where it plays an important role in cognitive decline and dementia [Wilson et al 2013]. Other pathologic changes such as white matter disease and atrophy also are important [Birdsill et al 2013, Debette and Markus 2010, Erten-Lyons et al 2013], as well as additional neuropathologies yet to be identified. Interestingly, while the models used to identify the groups with distinct cognitive profiles are adjusted for age and common neuropathologies, there remain significant differences in age and common neuropathologies between the groupings. This intriguing finding suggests that multiple factors can have independent effects on cognitive decline and at the same time be correlated with each other. In particular, it is not unusual that multiple pathologies are independently associated with cognitive decline, but are correlated with each other due to comorbidity. For instance, in our data, participants with pathologic AD are more likely to have hippocampal sclerosis pathology, yet both pathologies still have significant effects on cognitive decline after controlling for one another.
Third, there are significant differences in cognitive and neuronal reserve markers between the latent groups of residual cognitive decline. This finding provides further support that behavioral and structural elements of reserve influence late life cognitive performance and contribute to individual differences in the ability to respond to accumulating damage due to neuropathology. We have previously shown that engagement in cognitively stimulating activities helps to enhance the brain's ability to maintain relatively normal function despite the accumulation of a mild to moderate neuropathologic burden, and a higher level of purpose in life also protects against the harmful effects of AD pathology on cognitive function in elderly persons. On the other hand, adverse psychological and experiential factors such as depression or social isolation are likely to exacerbate the deleterious effects of neuropathologic changes on cognition. Separately, neural density in the locus ceruleus contributes to brain reserve capacity. Indeed, we confirmed that after adjustment for common neuropathologies, compared with non-decliners, decliners had more depressive symptoms, were more socially isolated, were less engaged in cognitive or physical activities, and had fewer noradrenergic neurons in the locus ceruleus. Clarifying the neurobiological mechanisms through which these reserve markers exert influences on late life cognitive function is urgently needed to promote cognitive health among elderly persons.
Strengths and limitations are noted. Participants in the study underwent detailed annual cognitive evaluations for up to 19 waves as well as uniform post-mortem neuropathologic examinations, allowing us to reliably characterize residual cognitive trajectories not explained by common neuropathologic indices. We applied a random effects mixture model which empirically classified participants into latent groups with distinct signatures of residual decline. In addition, our data also include a range of psychological, experiential, and neurobiologic factors, which provide us with a unique opportunity to examine reserve markers that differ between the latent groups. The study also has limitations. For example, pathologic measures in our analysis are markers of diseases but do not fully capture the processes. The binary measures for macroscopic infarcts, Lewy bodies and hippocampal sclerosis ignore important dimensions such as number, size and severity. A disease may explain more variation in cognitive decline when these dimensions are taken into account. Therefore, we are likely underestimating the effect of the overall burden of these neuropathologic conditions on cognitive aging. In addition, although postmortem indices are useful in examining the influence of pathology on cognitive decline, even many years prior to death [Wilson et al 2010, Yu et al 2013], the inability to capture the pathology in vivo limits the understanding of how dynamic changes in pathologic process are related to cognitive trajectories.
Aging involves a spectrum of cognitive abilities and the relationship of these cognitive systems with age is complex. Specific cognitive abilities, supported by distinct neural systems, may differentially respond to neurodegenerative lesions, oxidative stress, or inflammatory processes. Future studies are needed to examine distinct profiles of residual cognitive trajectories in specific cognitive systems.
Supplementary Material
Acknowledgments
The authors thank all the participants of the Religious Order Study and the Rush Memory and Aging Project, as well as the staff at the Rush Alzheimer's Disease Center for this work. This research was supported by National Institute on Aging grants R01AG17917, R01AG34374, R01AG15819, and P30AG10161.
Contributor Information
Lei Yu, Email: lei_yu@rush.edu.
Patricia A. Boyle, Email: paboyle@gmail.com.
Eisuke Segawa, Email: eisuke.segawa@northwestern.edu.
Sue Leurgans, Email: Sue_E_Leurgans@rush.edu.
Julie A. Schneider, Email: Julie_A_Schneider@rush.edu.
Robert S. Wilson, Email: Robert_S_Wilson@rush.edu.
David A. Bennett, Email: David_A_Bennett@rush.edu.
References
- Bennett DA, Schneider JA, Wilson RS, Bienias JL, Arnold SE. Neurofibrillary tangles mediate the association of amyloid load with clinical Alzheimer disease and level of cognitive function. Arch Neurol. 2004;61(3):378–84. doi: 10.1001/archneur.61.3.378. [DOI] [PubMed] [Google Scholar]
- Bennett DA, Schneider JA, Arvanitakis Z, Wilson RS. Overview and findings from the Religious Orders Study. Cur Alzheimer Res. 2012;9:630–647. doi: 10.2174/156720512801322573. [DOI] [PMC free article] [PubMed] [Google Scholar]
- Bennett DA, Schneider JA, Buchman AS, Barnes LL, Boyle PA, Wilson RS. Overview and findings from the Rush Memory and Aging Project. Cur Alzheimer Res. 2012;9:648–665. doi: 10.2174/156720512801322663. [DOI] [PMC free article] [PubMed] [Google Scholar]
- Bennett DA, Wilson RS, Boyle PA, Buchman AS, Schneider JA. Relation of neuropathology to cognition in persons without cognitive impairment. Ann Neurol. 2012;72(4):599–609. doi: 10.1002/ana.23654. [DOI] [PMC free article] [PubMed] [Google Scholar]
- Birdsill AC, Koscik RL, Jonaitis EM, Johnson SC, Okonkwo OC, Hermann BP, Larue A, Sager MA, Bendlin BB. Regional white matter hyperintensities: aging, Alzheimer's disease risk, and cognitive function. Neurobiol Aging. 2014;35(4):769–76. doi: 10.1016/j.neurobiolaging.2013.10.072. Epub 2013 Oct 10. [DOI] [PMC free article] [PubMed] [Google Scholar]
- Boyle PA, Buchman AS, Barnes LL, Bennett DA. Effect of a purpose in life on risk of incident Alzheimer disease and mild cognitive impairment in community-dwelling older persons. Archives of general psychiatry. 2010;67(3):304–310. doi: 10.1001/archgenpsychiatry.2009.208. [DOI] [PMC free article] [PubMed] [Google Scholar]
- Boyle PA, Wilson RS, Yu L, Barr AM, Honer WG, Schneider JA, Bennett DA. Much of late life cognitive decline is not due to common neurodegenerative pathologies. Ann Neurol. 2013;74(3):478–89. doi: 10.1002/ana.23964. [DOI] [PMC free article] [PubMed] [Google Scholar]
- Boyle PA, Yu L, Wilson RS, Schneider JA, Bennett DA. Relation of neuropathology with cognitive decline among older persons without dementia. Front Aging Neurosci. 2013;5:50. doi: 10.3389/fnagi.2013.00050. [DOI] [PMC free article] [PubMed] [Google Scholar]
- Buchman AS, Boyle PA, Yu L, Shah RC, Wilson RS, Bennett DA. Total daily physical activity and the risk of AD and cognitive decline in older adults. Neurology. 2012;78(17):1323–1329. doi: 10.1212/WNL.0b013e3182535d35. [DOI] [PMC free article] [PubMed] [Google Scholar]
- Buckner RL. Memory and executive function in aging and AD: multiple factors that cause decline and reserve factors that compensate. Neuron. 2004;44(1):195–208. doi: 10.1016/j.neuron.2004.09.006. [DOI] [PubMed] [Google Scholar]
- Deary IJ, Corley J, Gow AJ, Harris SE, Houlihan LM, Marioni RE, et al. Starr JM. Age-associated cognitive decline. British medical bulletin. 2009;92(1):135–152. doi: 10.1093/bmb/ldp033. [DOI] [PubMed] [Google Scholar]
- Debette S, Markus HS. The clinical importance of white matter hyperintensities on brain magnetic resonance imaging: systematic review and meta-analysis. BMJ. 2010;341:c3666. doi: 10.1136/bmj.c3666. [DOI] [PMC free article] [PubMed] [Google Scholar]
- DeCarli C, Massaro J, Harvey D, Hald J, Tullberg M, Au R, et al. Wolf PA. Measures of brain morphology and infarction in the Framingham Heart Study: establishing what is normal. Neurobiology of aging. 2005;26(4):491–510. doi: 10.1016/j.neurobiolaging.2004.05.004. [DOI] [PubMed] [Google Scholar]
- Dodge HH, Shen C, Ganguli M. Application of the pattern-mixtue latent trajectory model in an epidemiological study with non-ignorable missingness. Journal of data science: JDS. 2008;6(2):247. [PMC free article] [PubMed] [Google Scholar]
- Erten-Lyons D, Dodge HH, Woltjer R, Silbert LC, Howieson DB, Kramer P, Kaye JA. Neuropathologic basis of age-associated brain atrophy. JAMA Neurol. 2013;70(5):616–22. doi: 10.1001/jamaneurol.2013.1957. [DOI] [PMC free article] [PubMed] [Google Scholar]
- Fotuhi M, Hachinski V, Whitehouse PJ. Changing perspectives regarding late-life dementia. Nat Rev Neurol. 2009;5(12):649–58. doi: 10.1038/nrneurol.2009.175. Epub 2009 Nov 17. [DOI] [PubMed] [Google Scholar]
- Hayden KM, Reed BR, Manly JJ, Tommet D, Pietrzak RH, Chelune GJ, et al. Jones RN. Cognitive decline in the elderly: an analysis of population heterogeneity. Age and ageing. 2011;40(6):684–689. doi: 10.1093/ageing/afr101. [DOI] [PMC free article] [PubMed] [Google Scholar]
- Hedden T, Mormino EC, Amariglio RE, Younger AP, Schultz AP, Becker JA, Buckner RL, Johnson KA, Sperling RA, Rentz DM. Cognitive profile of amyloid burden and white matter hyperintensities in cognitively normal older adults. J Neurosci. 2012;32(46):16233–42. doi: 10.1523/JNEUROSCI.2462-12.2012. [DOI] [PMC free article] [PubMed] [Google Scholar]
- James BD, Wilson RS, Barnes LL, Bennett DA. Late-life social activity and cognitive decline in old age. Journal of the International Neuropsychological Society. 2011;17(06):998–1005. doi: 10.1017/S1355617711000531. [DOI] [PMC free article] [PubMed] [Google Scholar]
- Kovacs GG, Alafuzoff I, Al-Sarraj S, Arzberger T, Bogdanovic N, Capellari S, Ferrer I, Gelpi E, Kövari V, Kretzschmar H, Nagy Z, Parchi P, Seilhean D, Soininen H, Troakes C, Budka H. Mixed brain pathologies in dementia: the BrainNet Europe consortium experience. Dement Geriatr Cogn Disord. 2008;26(4):343–50. doi: 10.1159/000161560. Epub 2008 Oct 10. [DOI] [PubMed] [Google Scholar]
- Launer LJ, Petrovitch H, Ross GW, Markesbery W, White LR. AD brain pathology: vascular origins? Results from the HAAS autopsy study. Neurobiol Aging. 2008;29(10):1587–90. doi: 10.1016/j.neurobiolaging.2007.03.008. Epub 2007 Apr 26. [DOI] [PMC free article] [PubMed] [Google Scholar]
- Morris JC, Storandt M, McKeel DW, Rubin EH, Price JL, Grant EA, Berg L. Cerebral amyloid deposition and diffuse plaques in “normal” aging: Evidence for presymptomatic and very mild Alzheimer's disease. Neurology. 1996;46(3):707–719. doi: 10.1212/wnl.46.3.707. [DOI] [PubMed] [Google Scholar]
- Proust C, Jacqmin-Gadda H. Estimation of linear mixed models with a mixture of distribution for the random effects. Comput Methods Programs Biomed. 2005;78(2):165–73. doi: 10.1016/j.cmpb.2004.12.004. [DOI] [PMC free article] [PubMed] [Google Scholar]
- Roeder K, Lynch KG, Nagin DS. Modeling uncertainty in latent class membership: A case study in criminology. Journal of the American Statistical Association. 1999;94(447):766–776. [Google Scholar]
- Rowe JW, Kahn RL. Human aging: usual and successful. Science. 1987;237(4811):143–149. doi: 10.1126/science.3299702. [DOI] [PubMed] [Google Scholar]
- Salthouse TA. What and when of cognitive aging. Current Directions in Psychological Science. 2004;13(4):140–144. doi: 10.1177/0963721414535212. [DOI] [PMC free article] [PubMed] [Google Scholar]
- Salthouse TA. Are individual differences in rates of aging greater at older ages? Neurobiology of aging. 2012;33(10):2373–2381. doi: 10.1016/j.neurobiolaging.2011.10.018. [DOI] [PMC free article] [PubMed] [Google Scholar]
- Schneider JA, Bienias JL, Wilson RS, Berry-Kravis E, Evans DA, Bennett DA. The apolipoprotein E epsilon4 allele increases the odds of chronic cerebral infarction [corrected] detected at autopsy in older persons. Stroke. 2005;36(5):954–9. doi: 10.1161/01.STR.0000160747.27470.2a. Epub 2005 Mar 17. [DOI] [PubMed] [Google Scholar]
- Schneider JA, Arvanitakis Z, Yu L, Boyle PA, Leurgans SE, Bennett DA. Cognitive impairment, decline and fluctuations in older community-dwelling subjects with Lewy bodies. Brain. 2012;135:3005–3914. doi: 10.1093/brain/aws234. [DOI] [PMC free article] [PubMed] [Google Scholar]
- Sonnen JA, Larson EB, Crane PK, Haneuse S, Li G, Schellenberg GD, Craft S, Leverenz JB, Montine TJ. Pathological correlates of dementia in a longitudinal, population-based sample of aging. Ann Neurol. 2007;62(4):406–13. doi: 10.1002/ana.21208. [DOI] [PubMed] [Google Scholar]
- Sperling RA, Aisen PS, Beckett LA, Bennett DA, Craft S, Fagan AM, Iwatsubo T, Jack CR, Jr, Kaye J, Montine TJ, Park DC, Reiman EM, Rowe CC, Siemers E, Stern Y, Yaffe K, Carrillo MC, Thies B, Morrison-Bogorad M, Wagster MV, Phelps CH. Toward defining the preclinical stages of Alzheimer's disease: recommendations from the National Institute on Aging-Alzheimer's Association workgroups on diagnostic guidelines for Alzheimer's disease. Alzheimers Dement. 2011;7(3):280–92. doi: 10.1016/j.jalz.2011.03.003. Epub 2011 Apr 21. [DOI] [PMC free article] [PubMed] [Google Scholar]
- Troncoso JC, Zonderman AB, Resnick SM, Crain B, Pletnikova O, O'Brien RJ. Effect of infarcts on dementia in the Baltimore longitudinal study of aging. Ann Neurol. 2008;64(2):168–76. doi: 10.1002/ana.21413. [DOI] [PMC free article] [PubMed] [Google Scholar]
- Verbeke G, Lesaffre E. A linear mixed-effects model with heterogeneity in the random-effects population. JASA. 1996;91:217–221. [Google Scholar]
- Verhaeghen P, Salthouse TA. Meta-analyses of age–cognition relations in adulthood: Estimates of linear and nonlinear age effects and structural models. Psychological bulletin. 1997;122(3):231. doi: 10.1037/0033-2909.122.3.231. [DOI] [PubMed] [Google Scholar]
- Wilson RS, De Leon CFM, Barnes LL, Schneider JA, Bienias JL, Evans DA, Bennett DA. Participation in cognitively stimulating activities and risk of incident Alzheimer disease. JAMA. 2002;287(6):742–748. doi: 10.1001/jama.287.6.742. [DOI] [PubMed] [Google Scholar]
- Wilson RS, Krueger KR, Arnold SE, Schneider JA, Kelly JF, Barnes LL, et al. Bennett DA. Loneliness and risk of Alzheimer disease. Archives of general psychiatry. 2007;64(2):234–240. doi: 10.1001/archpsyc.64.2.234. [DOI] [PubMed] [Google Scholar]
- Wilson RS, Segawa E, Boyle PA, Bennett DA. Influence of late-life cognitive activity on cognitive health. Neurology. 2012;78(15):1123–1129. doi: 10.1212/WNL.0b013e31824f8c03. [DOI] [PMC free article] [PubMed] [Google Scholar]
- Wilson RS, Leurgans SE, Boyle PA, Schneider JA, Bennett DA. Neurodegenerative basis of age-related cognitive decline. Neurology. 2010;75:1070–1078. doi: 10.1212/WNL.0b013e3181f39adc. [DOI] [PMC free article] [PubMed] [Google Scholar]
- Wilson RS, Yu L, Trojanowski JQ, Chen EY, Boyle PA, Bennett DA, Schneider JA. TDP-43 Pathology, Cognitive Decline, and Dementia in Old Age. JAMA Neurol. 2013 doi: 10.1001/jamaneurol.2013.3691. Epub ahead of print. [DOI] [PMC free article] [PubMed] [Google Scholar]
- Wilson RS, Nag S, Boyle PA, Hizel LP, Yu L, Buchman AS, et al. Bennett DA. Neural reserve, neuronal density in the locus ceruleus, and cognitive decline. Neurology. 2013;80(13):1202–1208. doi: 10.1212/WNL.0b013e3182897103. [DOI] [PMC free article] [PubMed] [Google Scholar]
- Wilson RS, Capuano AW, Boyle PA, Hoganson GM, Hizel LP, Shah RC, et al. Bennett DA. Clinical-pathologic study of depressive symptoms and cognitive decline in old age. Neurology. 2014;83(8):702–709. doi: 10.1212/WNL.0000000000000715. [DOI] [PMC free article] [PubMed] [Google Scholar]
- Yu L, Boyle P, Schneider JA, Segawa E, Wilson RS, Leurgans S, Bennett DA. APOE ε4, Alzheimer's disease pathology, cerebrovascular disease, and cognitive change over the years prior to death. Psychology and aging. 2013;28(4):1015–23. doi: 10.1037/a0031642. [DOI] [PMC free article] [PubMed] [Google Scholar]
Associated Data
This section collects any data citations, data availability statements, or supplementary materials included in this article.