Abstract
Background
Modern dental implants present surface features of distinct dimensions that can be damaged during the insertion procedure into bone.
Purpose
The aims of this study were (1) to quantify by means of roughness parameters the surface damage caused by the insertion procedure of dental implants and (2) to investigate the presence of loose particles at the interface.
Materials and Methods
Three groups of dental implants representing different surface topographies were inserted in fresh cow rib bone blocks. The surface roughness was characterized by interferometry on the same area before and after the insertion. SEM-BSD analysis was used to identify loose particles at the interface.
Results
The amplitude and hybrid roughness parameters of all three groups were lower after insertion. The surface presenting predominance of peaks (Ssk>0) associated to higher structures (height parameters) presented higher damage associated to more pronounced reduction of material volume. SEM-BSD images revealed loose titanium and aluminum particles at the interface mainly at the crestal cortical bone level.
Conclusions
Shearing forces during the insertion procedure alters the surface of dental implants. Loose metal particles can be generated at bone-implant interface especially around surfaces composed mainly by peaks and with increased height parameters.
Keywords: Bone, Dental implants, Surface Properties, Surface Topography, Titanium
INTRODUCTION
Oral rehabilitation with dental implants is a routine treatment modality for replacing missing teeth. The first generation of implants demonstrated an accepted bone crestal loss of < 1mm within the first year and < 0.2 in the following years1. The development of new implant surfaces and designs together with improvement of the surgical/prosthetic hardware resulted in a reduction of bone loss associated to modern implants14. However, marginal bone loss still a common finding poorly explained. Different theories suggest possible mechanisms, such as: the establishment of the biological width around a metal screw, occlusal overload or peri-implantitis.
Successful implants will experience bone loss that usually takes place at a very early time points. Bone level changes calculated on radiographs taken from 1-54 weeks indicated that the change in height is limited to the first 6 weeks and subsequent change is remarkably reduced19. Follow-up studies considering the implant placement as baseline for the analysis indicated a similar trend3, 11, indicating that this initial bone loss first described by Branemark et al. in 19772 occurs much earlier than expected.
The surface of modern implants with enhanced roughness presents higher peaks that are more likely to break and detach during the insertion procedure into bone. The quantitative characterization of surface topography of dental implants was introduced by Wennerberg et al. in 1992.22 and the analysis of the roughness parameters before and after insertion is a reliable alternative to quantify the extent of wear.4 Previous results indicated a change in surface topography of implants unscrewed after 12 weeks of healing in rabbits.21 In vivo experiments indicated loose titanium particles in bone tissue around smooth-turned,16, 17 grit-blasted/acid-etched 16 and plasma-sprayed implants.7, 8, 15, 16 More recently, soft tissue biopsies performed in patients after 6 months of implant installation detected Ti particles in the connective tissue facing the dental implants.5, 6 The shear forces arising from the friction of self-tapping implants against the bone tissue produce a dynamic shifting of stresses on different locations along the implant, related to the heterogeneity of bone tissue and the geometry of the implants.10 Thus, dynamic localized spots are randomly created during insertion of the implants, generating particular areas of stress concentration that may compromised the integrity of the surface features and consequently release titanium particles in the bone tissue. Therefore, the aim of this study was to evaluate the surface damage to different dental implants caused by the insertion procedure itself and evaluate the generation of loose metal particles at the bone-implant interface.
MATERIALS AND METHODS
Fresh cow rib bones pieces were prepared and used immediately. Blocks measuring approximately 20 × 15 × 15 mm were cut with a diamond band saw (model C-40; Gryphon Corporation, Sylmar, CA, USA). Those blocks without 1.5 ± 0.5 mm thickness of cortical bone were excluded to keep the sample with similar thickness of human maxilla and mandible bones13. Next, each block was sectioned at the midline and the two halves were bound tightly back together to the original configuration by a clamp to allow the insertion of the implant at the midline interface (Figure 1).
Figure 1.
Cow rib bone blocks – 20 × 15 × 15 mm were cut transversely (a) and drilling was performed at the interface, as recommended for dense bone (b). After the implants were fully inserted (c), the blocks were split and the implant was assessed without any additional damage to the implant surface (d).
Cylindrical self-tapping threaded dental implants of similar dimensions and different surface topographies were selected (n = 6 per group): 4.0 × 10 mm TiUnite™ MkIII, Nobel Biocare, Sweden (TU); 4.0 × 11 mm OsseoSpeed™ TX, Astra Tech AB, Sweden (OS) and 4.1 × 10 mm SLActive® Bone Level, Straumann, Switzerland (SL). TU surface features are produced by anodization process, while SL and OS surface features are produced by the combination of grit-blasting and acid-etching processes20.
The bone blocks were randomly divided and drilling and implant insertion were performed at the interface of the two halves following each manufacturer's instructions with over copious irrigation. The implants were inserted at 25 rpm using the drilling unit (Elcomed SA-310; W&H Dentalwerk Bürmoos GmbH, Bürmoos, Austria). After the implants were fully inserted, the clamp was removed and the blocks were split at the pre-sectioned interface to retrieve the implant, which was easily removed without counter torque. This means that the removal procedure did not damage the implant surface. The implants were transferred to a plastic tube to be sonicated in purified water (30 min) and acetone (10 min) to remove residual bone debris from the surface. Acetone is an organic solvent know to be non reactive to titanium and ceramics, commonly used to remove contaminants from titanium implants,
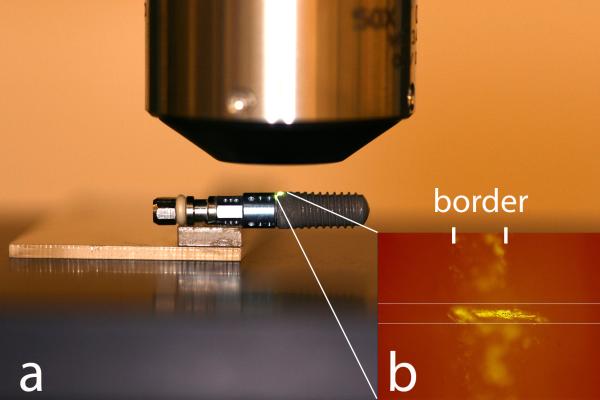
The crest of all threads, including the microthreads on neck of OS implants, were evaluated at the same regions before and after insertion by interferometry (New View 7300; Zygo , Middlefield, CT, USA) with objective 50× and zoom factor of 0.5. An implant mount (SL implant) and a transfer (TU and OS) was fixed to slide to ensure that the implants were measured at the exact same spot before and after insertion. In addition, careful adjustment was obtained by matching a scratch mark to a pre-determined rectangle mask set on the live display window of the software (MetroPro® version 9.1.2; Zygo). (Figure 2). Band pass Gaussian filter was used to remove errors of form and waviness.
Figure 2.
Implant positioning was obtained using the mount fixed to a slide (a). In addition, a scratch mark ensured the exact alignment to a predetermined mask set on the live display window of the software (b).
The roughness parameters selected were calculated using Scanning Probe Image Processor software (version 5.1.8; Image Metrology A/S, Hørsholm, Denmark) and included:
Amplitude parameters: Sa = average height deviation, and Ssk = degree of symmetry of the surface heights about the mean plane (skewness).
Hybrid parameter: Sdr = developed interfacial area ratio.
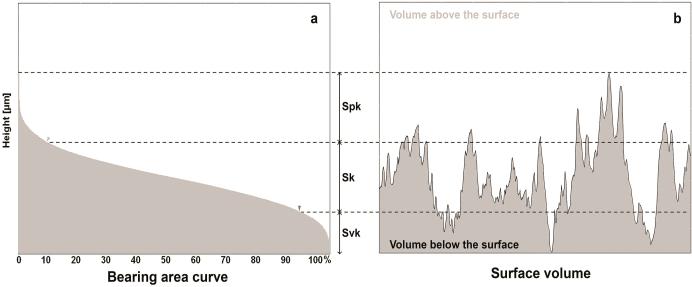
Functional parameters: Spk = peak height above the core roughness; Sk = core roughness height (peak-to-valley) of the surface with the predominant peaks and valleys removed; and Svk = valley depth below the core roughness (Figure 3a).
Figure 3.
The functional parameters are determined from the bearing area ratio curve (a). Spk corresponds to the peak height above the core roughness; Sk to the core roughness height (peak-to-valley) of the surface with the predominant peaks and valleys removed; and Svk to valley depth below the core roughness. The sum of these parameters (Svk + Sk + Spk) determines the total structural height of the surface and the volume of surface features (Vm) comprises 100% of the surface material ratio (b).
In addition, the peak density and the material volume (Vm) correspondent to 100% of the surface features (Figure 3b) were calculated using MetroPro® software. The average difference in Vm (Vmintial – Vmfinal) calculated by the interferometer was then correlated with the total surface area of the implants to estimate the total volume of particles detached from the surface considering a uniform damage along the entire implant. For this, one implant of each group was subjected to a μCT scanning (vivaCT 40; Scanco USA Inc., Wayne, PA, USA) to determine the total surface area of the implant, which revealed 173.31, 176.71 and 158.22 mm2 for TU, OS and SL groups. From the total volume estimated, the mass of particles was calculated considering the density of titanium dioxide as 4.23 g/cm3.
Scanning electron microscopy (SEM) images of the implants before and after insertion was performed (Zeiss Auriga SEM/FIB, Oberkochen, Germany) at different magnifications, associated to back-scattered electron detector (BSD) at 20kV with a resolution of <5nm and energy-dispersive x-ray spectroscopy (EDS). To detect the presence of loose titanium particles along the bone implantation sites, the bone blocks were dried at 37°C for 48 h after implant removal and evaluated by BSD/EDS. Remaining debris on the bone surface related to the insertion procedure were removed prior to SEM-EDS with a jet spray to avoid unstable structures that would compromise the analysis and contaminate the electron microscope vacuum chamber.
The roughness parameters, peak density and Vm data before and after implant insertion was analyzed by paired t-test (α = 0.05) (SPSS Statistics 20; IBM Corporation, Armonk, New York, USA).
RESULTS
Implant insertion torque never exceeded the maximum value recommended by the manufactures. Average insertion torque (Ncm) of 40.4(2.0), 35.2(3.1) and 36.5(2.5) was calculated for TU, OS and SL implants, respectively.
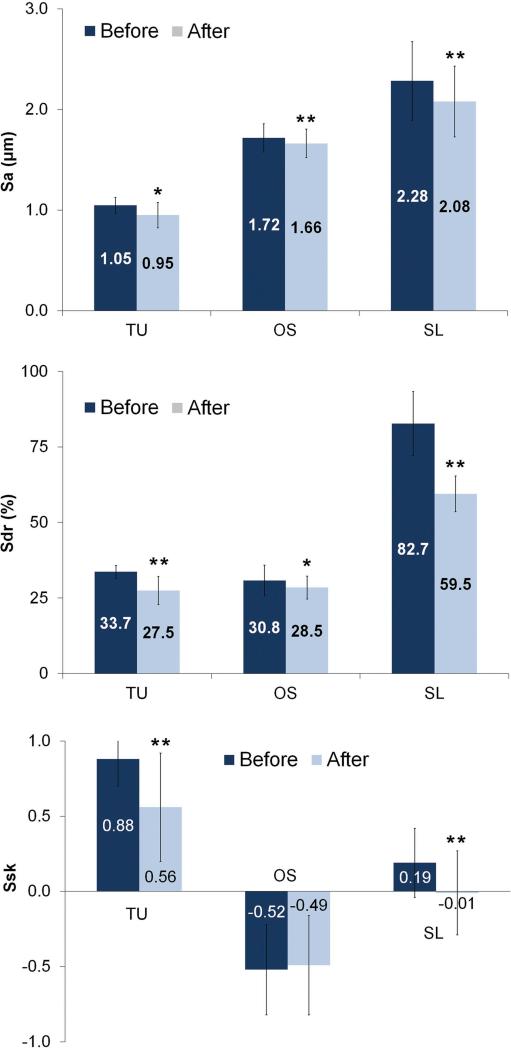
The results are summarized in Table 1. The average height deviation (Sa) of the TU, OS and SL implants demonstrated a reduction of 0.1-, 0.06- and 0.2 μm after insertion (Figure 4). The degree of symmetry measured by the Ssk showed a predominance of peaks above the mean plane to TU and SL (Ssk > 0) implants. After insertion, the reduction on the Ssk values of TU and SL implants indicates a shift on the height profile towards a more symmetrical distribution explained by loss of the peaks. In contrast, Ssk initial negative value for OS implants reveals that the initial surface was composed predominantly by valleys and the similar values before and after insertion indicated that height distribution was not affected (Figure 4). The developed interfacial area ratio (Sdr) values alteration followed the same pattern as observed for Sa; higher reduction to SL (Δ 23.2%) followed by TU (Δ 6.2%) and OS (Δ 2.3%).
Table 1.
Roughness Parameters of the Implant Groups Before and After Insertion.
| Implant Parameter | TU | OS | SL | |
|---|---|---|---|---|
| Sa (μm) | Before | 1.05 ± 0.08 | 1.72 ± 0.14 | 2.28 ± 0.39 |
| After | 0.95 ± 0.13 | 1.66 ± 0.14 | 2.08 ± 0.35 | |
| Sdr (%) | Before | 33.66 ± 2.14 | 30.78 ± 5.05 | 82.68 ± 10.58 |
| After | 27.45 ± 4.72 | 28.45 ± 3.80 | 59.48 ± 5.94 | |
| Svk (μm) | Before | 0.63 ± 0.11 | 2.63 ± 0.46 | 2.76 ± 0.80 |
| After | 0.75 ± 0.22 | 2.51 ± 0.48 | 2.54 ± 0.69 | |
| Sk (μm) | Before | 3.11 ± 0.35 | 5.38 ± 0.62 | 7.06 ± 1.20 |
| After | 2.83 ± 0.50 | 5.16 ± 0.49 | 6.60 ± 1.10 | |
| Spk (μm) | Before | 1.70 ± 0.20 | 2.06 ± 0.52 | 3.44 ± 0.74 |
| After | 1.53 ± 0.31 | 2.02 ± 0.48 | 2.75 ± 0.70 | |
| Ssk | Before | 0.88 ± 0.18 | −0.52 ± 0.30 | 0.19 ± 0.23 |
| After | 0.56 ± 0.36 | −0.49 ± 0.33 | −0.01 ± 0.28 | |
Figure 4.
Surface roughness Sa, Sdr and Ssk parameters (mean and standard deviation) of the implants before and after insertion into bone (* = P < 0.05 and ** = P < 0.01).
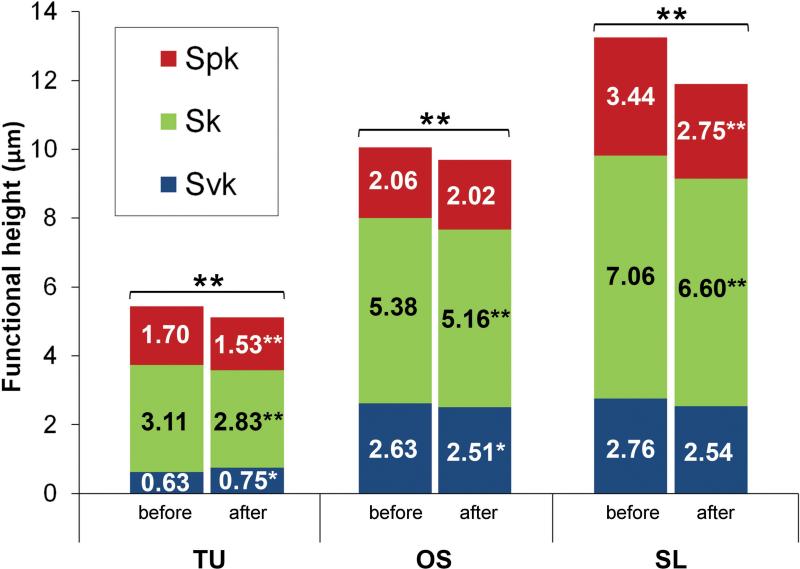
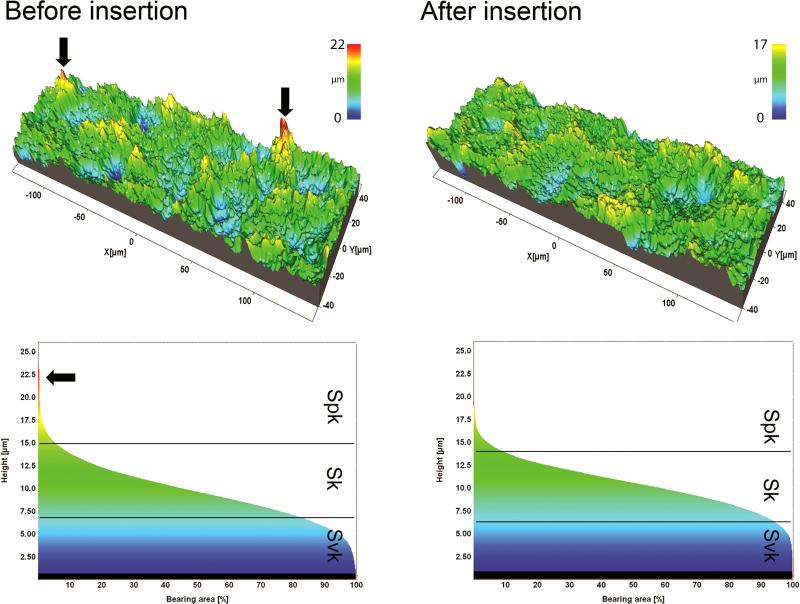
TU implants exhibited slightly deeper extreme valleys (Svk) after insertion coupled to a reduction of both the core roughness (Sk) and extreme peaks (Spk) of 0.28 μm and 0.17 μm that resulted in an overall height reduction (Svk+Sk+Spk) of 0.33 μm. OS implants exhibited a reduction of the Svk and Sk of 0.12 μm and 0.22 μm, where the Spk was similar after insertion, resulting on an overall reduction of 0.33 μm. Although the OS and SL undergo similar surface modifications, the functional parameters modification indicated a different behavior under stress. SL implants were mainly affected on the extreme peaks, with a reduction of the Spk of 0.69 μm, while the core roughness and extreme valleys showed a reduction of 0.45 μm and 0.22 μm that resulted in an overall height reduction of 1.36 μm (Figure 5). An example of a SL implant measurement of the same thread before and after shows that the extreme peaks were predominantly affected compared to the core roughness and extreme valleys (Figure 6).
Figure 5.
The surface functional height (Svk+Sk+Spk) of implants before (B) and after (A) insertion into bone (* = P < 0.05 and ** = P < 0.01).
Figure 6.
The surface topography of a thread of SL implants before and after insertion into bone and respective bearing area curves. Summits (red peaks) were visually less prevalent after implant insertion.
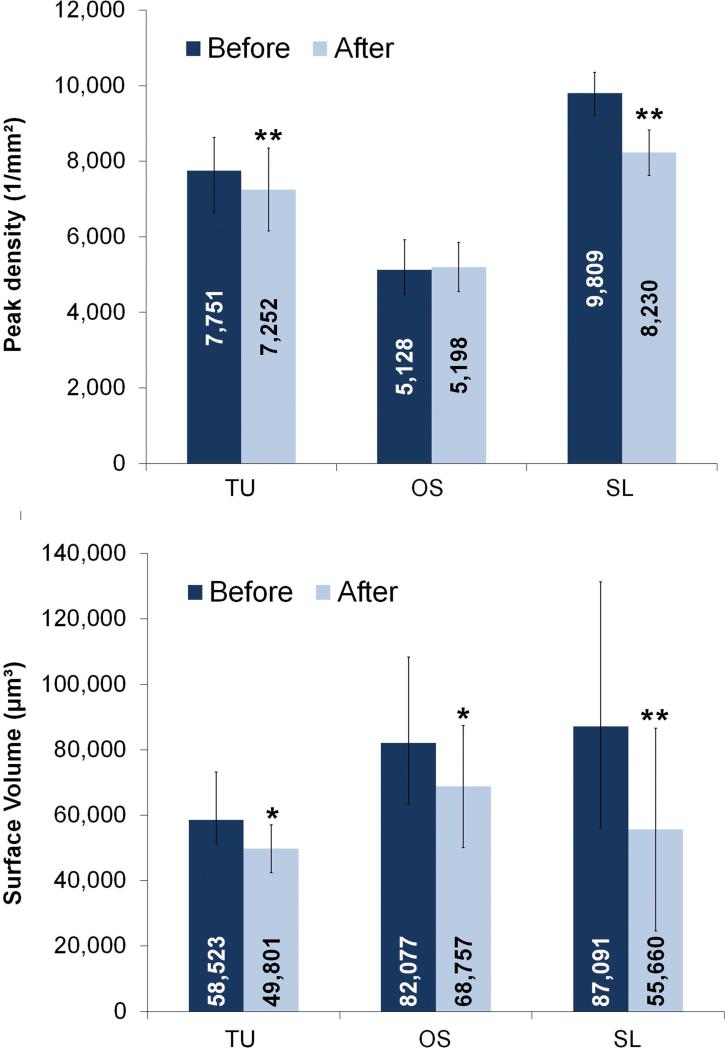
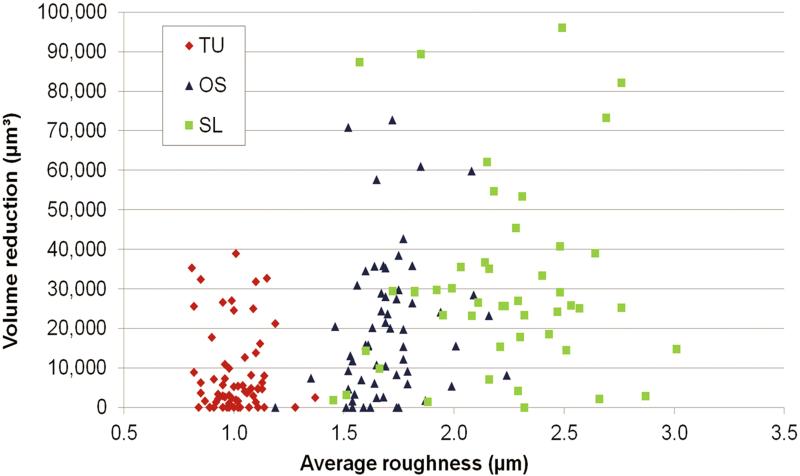
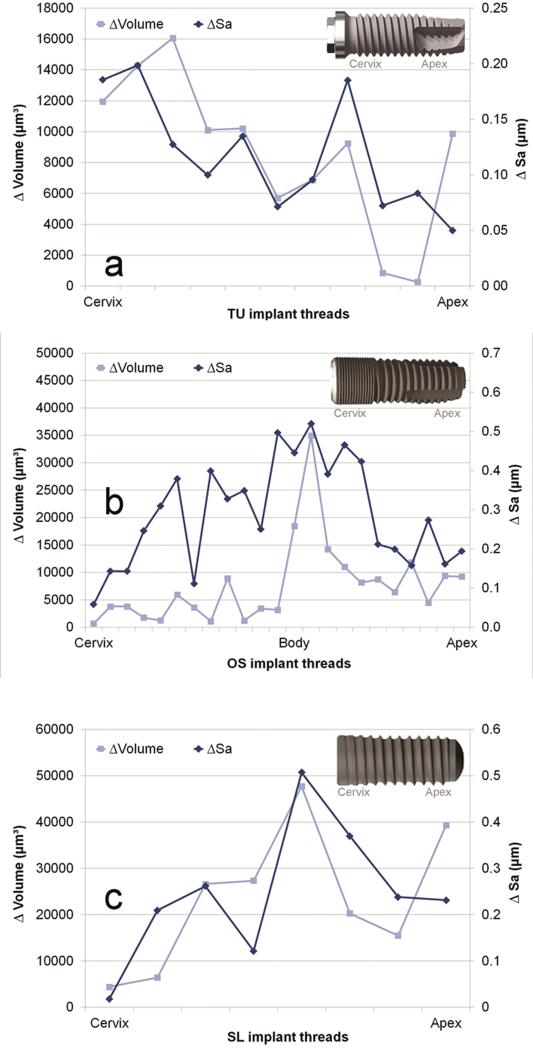
TU, OS and SL groups demonstrated an average Vm reduction of the volume at the crest of the threads of 8,723 μm3, 13,320 μm3 and 31,431 μm3 (Figure 7). This corresponded to 0.06, 0.14 and 0.54 mg of released particles from TU, OS and SL implants. The threads were randomly damaged during insertion, even in the same implant group, as observed by the broad range of Vm reduction considering each thread (Figure 8). While some threads were minimally affected, others threads of OS and SL implants exhibited the highest structural height reduction (Figure 9).
Figure 7.
Peak density and surface volume (mean and standard deviation) of implants before and after insertion into bone (* = P < 0.05 and ** = P < 0.01).
Figure 8.
The surface volume reduction after implant insertion according to the average roughness (Sa) computed at the crest of all threads of TU, OS and SL groups.
Figure 9.
The average roughness (Sa) and surface volume (Vm) reduction on each individual thread after insertion along TU (a), OS (b) and SL (c) implants.
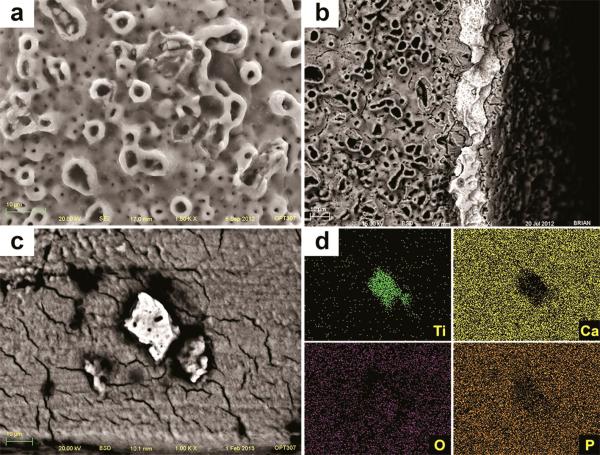
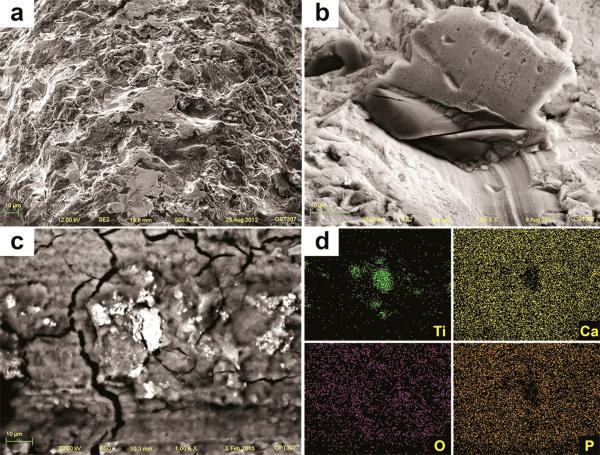
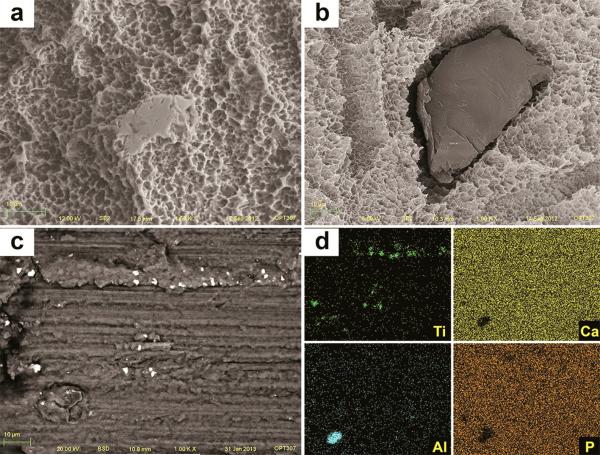
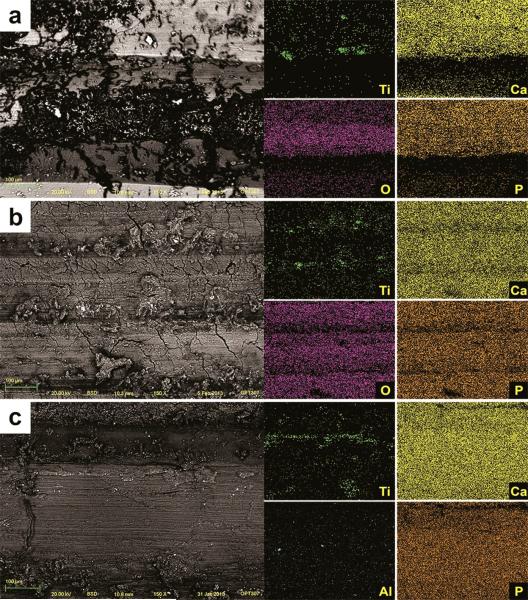
After insertion, SEM images of TU implants showed chipping of the porous structures along the surface associated with cracks on the base of the anodized layer (Figure 10a). Also, delamination was seen at the sharp edges of the cutting-threads with exposure of bulk titanium (Figure 10b). The sharp peaks present initially at the grit-blasted and acid-etched implants (OS and SL) were less prominent or completely removed after insertion, resulting in flattened smooth areas (Figure 11 and 12). The BSD/EDS evaluation revealed presence of titanium debris along the implantation site of bone blocks separated from TU, SL and OS implants (Figure 10, 11 and 12). Loose titanium particles of 10 nm to 20 μm were seen on the implantation sites, concentrated mainly around the cortical bone layer, especially at the microthreads region of OS implants. Bone blocks adjacent to SL implants revealed Al particles (Figure 13).
Figure 10.
SEM image of TU implant after insertion into bone revealed chipping of the more extreme porous (a) and cracks on the oxide layer associated to loss of entire oxide layer at the cutting edge with exposure of the bulk Ti (b). Along the implantation sites, pieces of the oxide layer were identified by SEM-BSD (c) and their Ti content was shown by EDS mapping of the surface (d).
Figure 11.
SEM image of OS implant after insertion into bone revealed sharp peaks less prominent or completely removed, resulting in flattened smooth areas after implant insertion (a). Also, the TiO2 grit-particles (dark and smooth) embedded into the surface (b) were less prevalent after insertion. Along the implantation sites, particles were identified by SEM-BSD (c) and their Ti content was shown by EDS mapping of the surface (d).
Figure 12.
SEM image of SL implant after insertion into bone revealed sharp peaks less prominent or completely removed, resulting in flattened smooth areas after implant insertion (a). Also, the alumina grit-particles (dark and smooth) embedded into the surface (b) were less prevalent after insertion. Along the implantation sites, particles were identified by SEM-BSD (c) and their Ti and Al content was shown by EDS mapping of the surface (d).
Figure 13.
SEM-BSD images of the implantation sites showed titanium loose particles (white shiny spots) along all implantation sites after removal of TU (a), OS (b) and SL implants (c). The elemental content of those particles (Ti for TU and OS, and Ti and Al for SL implants) was confirmed by the EDS mapping of the surface.
DISCUSSION
Pilot tests were performed to ensure that the maximum insertion torque for the implant groups never exceeded the values recommended by each company. This critical step was important to simulate an ideal placement and to ensure that any damage to the surface was not related to implant overtorque. In addition, secondary damage was achieved by cutting the bone blocks in half prior to implant insertion, allowing an easy removal of the implant by separating the block in two pieces. It would be hard to estimate any further damage related to the attempt to remove the implant by unscrewing or cutting the bone block with the implant already installed. Thus, any change in surface topography of the implants evaluated in the present study is restricted to the actual insertion procedure and does resemble the clinical scenario.
The Sa is the most used roughness parameter used to characterize implant surfaces and indicated that the height of the structures were more affected on the rougher SL implants. The higher surface alteration to the rougher SL implant was further confirmed by the more pronounced reduction of the hybrid Sdr parameter and the more pronounced reduction of surface volume compared to TU and OS implants. However, it was not clear the reason why both blasted and acid-etched implants (OS and SL) experienced such clear distinguished alteration after insertion.
The amplitude and hybrid parameters demonstrated change in the surface topography of all three groups but they are not sensitive to indicate the pattern of wear within the surface. To complement the amplitude and hybrid parameters, functional parameters are an alternative to separate the features within the surface. Surface features are separated as extreme peaks (Spk), core (Sk) and extreme valleys (Svk), providing a tool to inspect the damage at different levels.4 This approach proved to be a valuable technique to analyze different surfaces of dental implants and identify where the damage occurred. SL rougher implant demonstrated a pronounced reduction of Spk and decreased Sk after insertion, whereas the Svk were not statistically different. In contrast to SL implants, OS implants demonstrated a reduction of the core roughness (Sk) and the deep valleys (Svk) while the extreme peaks were not affected (Figure 5).
SL and OS implants are treated by the same surface modification techniques (blasting and acid-etching) but the two implants have a clear different height distribution. OS implants exhibit a surface predominantly formed by structures below the mean plane (Ssk < 0), whereas the SL implants have a slight asymmetry towards structures above the mean plane (Ssk > 0), explaining the unexpected similar Spk values before and after insertion for the OS implants and overall higher surface alteration to the rougher and positively skewed SL implants. The chipping of the oxide layer of the anodized TU implants at some threads explains the discrete increase of the Svk, resulting in some deeper structures combined to the expected wear of the Spk extreme peaks extending to the Sk core roughness. The direct analysis of the peak density values corroborated with the alterations detected by the roughness parameters. Positively skewed surfaces of TU and SL implants demonstrated a significant reduction of the number of peaks after insertion, whereas the negatively skewed OS implants revealed similar values before and after insertion (Figure 7). It is clear from the present results that the negative height distribution associated to a lower Sdr reduced the overall modification of the OS implants despite the higher Sa value compared to TU implants. In addition, the combination of higher Sa and Sdr values associated to a positive height distribution on SL implants determine the more pronounced volume reduction compared to TU and OS implants.
The present study showed that the insertion procedure itself is able to release up to 0.5 mg of particles at implant-bone interface. Previous studies reported that aseptic osteolysis was induced by 0.2 mg12 to 3.0 mg18 of loose titanium particles, showing extensive and non-uniform osteoclastic activity with a resorbed bone area 8%12 to 35%18 higher than the control sites without particles at 712 to 10 days, respectively. However, the evaluation of bone after 16 weeks failed to show any clear ongoing resorption and few reminiscent particles were detected9. Therefore, it seems that the aseptic osteolytic response to titanium particles is transient dependent on the presence of the particles. A recent follow-up with unusual radiographic protocol demonstrated a similar trend around dental implants. Vandeweghe et al19 based on a detailed radiographic regimen evaluated crestal bone changes as early as 1 week. The results demonstrated that 0.95mm (75%) of bone loss during the first year occurred within the first 6 weeks and a steady decrease of 0.1mm was observed at 3, 6 and 12 months. Other studies that considered the implant placement as baseline for crestal bone height evaluation indicated the same trend; a higher ratio of bone loss at 3 and 6 months intervals compared to 1 year follow-up3, 11.
A prolonged imbalance on bone remodeling related to the loose titanium particles is not expected in healthy subjects. After 16 weeks, no clear active bone resorption was observed in rabbits loaded with Ti-6Al-4V despite the presence of few reminiscent particles9. This finding is in agreement with the crestal bone height changes observed in follow-up studies, where a highest percentage of bone loss occurred during the first 3 months and fairly stable values were observed thereafter3, 19.
The generation of loose particles at the interface during insertion has been previously described and increased number of particles was associated to rougher implants17 and may contribute to the early marginal bone loss around well integrated dental implants. The great majority of the particles is phagocytised by macrophages and removed from the implant-bone interface, preventing a permanent bone resorption. The final destination of such particles was investigated in minipigs. After 5 months, no particles were detected at the bone-implant interface and were found in the lungs, kidneys and liver17. This indicates the possibility of migration of these particles released from the surface of dental implants from the jaw bone to other organs.
CONCLUSION
Surface damage was observed on all three implant groups. The combined enhanced Sa and positive Ssk values of SL implants resulted in more surface damage during the insertion procedure. Loose titanium particles of different sizes were detected embedded in the bone walls as a result of wear of the surface features. Future experiments should elucidate the clinical relevance of such particles on peri-implant tissues response.
ACKNOWLEDGMENTS
This work was supported by National Institutes of Health PHS award P30 AR61307. The authors would like to thank to the São Paulo Research Foundation (FAPESP #2011/23269-0) for the scholarship granted to PS.
REFERENCES
- 1.Albrektsson T, Zarb G, Worthington P, Eriksson AR. The long-term efficacy of currently used dental implants: a review and proposed criteria of success. Int J Oral Maxillofac Implants. 1986;1:11–25. [PubMed] [Google Scholar]
- 2.Branemark PI, Hansson BO, Adell R, Breine U, Lindstrom J, Hallen O, Ohman A. Osseointegrated implants in the treatment of the edentulous jaw. Experience from a 10-year period. Scand J Plast Reconstr Surg Suppl. 1977;16:1–132. [PubMed] [Google Scholar]
- 3.Collaert B, Wijnen L, De Bruyn H. A 2-year prospective study on immediate loading with fluoride-modified implants in the edentulous mandible. Clin Oral Implants Res. 2011;22:1111–1116. doi: 10.1111/j.1600-0501.2010.02077.x. [DOI] [PubMed] [Google Scholar]
- 4.Dong WP, Stout KJ. An Integrated Approach to the Characterization of Surface Wear .1. Qualitative Characterization. Wear. 1995;181:700–716. [Google Scholar]
- 5.Flatebo RS, Hol PJ, Leknes KN, Kosler J, Lie SA, Gjerdet NR. Mapping of titanium particles in peri-implant oral mucosa by laser ablation inductively coupled plasma mass spectrometry and high-resolution optical darkfield microscopy. J Oral Pathol Med. 2011;40:412–420. doi: 10.1111/j.1600-0714.2010.00958.x. [DOI] [PubMed] [Google Scholar]
- 6.Flatebo RS, Johannessen AC, Gronningsaeter AG, Boe OE, Gjerdet NR, Grung B, Leknes KN. Host response to titanium dental implant placement evaluated in a human oral model. J Periodontol. 2006;77:1201–1210. doi: 10.1902/jop.2006.050406. [DOI] [PubMed] [Google Scholar]
- 7.Franchi M, Bacchelli B, Martini D, Pasquale VD, Orsini E, Ottani V, Fini M, Giavaresi G, Giardino R, Ruggeri A. Early detachment of titanium particles from various different surfaces of endosseous dental implants. Biomaterials. 2004;25:2239–2246. doi: 10.1016/j.biomaterials.2003.09.017. [DOI] [PubMed] [Google Scholar]
- 8.Franchi M, Orsini E, Martini D, Ottani V, Fini M, Giavaresi G, Giardino R, Ruggeri A. Destination of titanium particles detached from titanium plasma sprayed implants. Micron. 2007;38:618–625. doi: 10.1016/j.micron.2006.09.005. [DOI] [PubMed] [Google Scholar]
- 9.Goodman SB, Davidson JA, Song Y, Martial N, Fornasier VL. Histomorphological reaction of bone to different concentrations of phagocytosable particles of high-density polyethylene and Ti-6Al-4V alloy in vivo. Biomaterials. 1996;17:1943–1947. doi: 10.1016/0142-9612(96)00013-0. [DOI] [PubMed] [Google Scholar]
- 10.Guan H, Staden RCv, Johnson NW, Loo Y-C. Dynamic modelling and simulation of dental implant insertion process-A finite element study. Finite Elem. Anal. Des. 2011;47:886–897. [Google Scholar]
- 11.Hammerle CH, Jung RE, Sanz M, Chen S, Martin WC, Jackowski J. Submerged and transmucosal healing yield the same clinical outcomes with two-piece implants in the anterior maxilla and mandible: interim 1-year results of a randomized, controlled clinical trial. Clin Oral Implants Res. 2012;23:211–219. doi: 10.1111/j.1600-0501.2011.02210.x. [DOI] [PubMed] [Google Scholar]
- 12.Kaar SG, Ragab AA, Kaye SJ, Kilic BA, Jinno T, Goldberg VM, Bi Y, Stewart MC, Carter JR, Greenfield EM. Rapid repair of titanium particle-induced osteolysis is dramatically reduced in aged mice. J Orthop Res. 2001;19:171–178. doi: 10.1016/S0736-0266(00)00033-4. [DOI] [PubMed] [Google Scholar]
- 13.Katranji A, Misch K, Wang HL. Cortical bone thickness in dentate and edentulous human cadavers. J Periodontol. 2007;78:874–878. doi: 10.1902/jop.2007.060342. [DOI] [PubMed] [Google Scholar]
- 14.Laurell L, Lundgren D. Marginal bone level changes at dental implants after 5 years in function: a meta-analysis. Clin Implant Dent Relat Res. 2011;13:19–28. doi: 10.1111/j.1708-8208.2009.00182.x. [DOI] [PubMed] [Google Scholar]
- 15.Martini D, Fini M, Franchi M, Pasquale VD, Bacchelli B, Gamberini M, Tinti A, Taddei P, Giavaresi G, Ottani V, Raspanti M, Guizzardi S, Ruggeri A. Detachment of titanium and fluorohydroxyapatite particles in unloaded endosseous implants. Biomaterials. 2003;24:1309–1316. doi: 10.1016/s0142-9612(02)00508-2. [DOI] [PubMed] [Google Scholar]
- 16.Meyer U, Buhner M, Buchter A, Kruse-Losler B, Stamm T, Wiesmann HP. Fast element mapping of titanium wear around implants of different surface structures. Clin Oral Implants Res. 2006;17:206–211. doi: 10.1111/j.1600-0501.2005.01184.x. [DOI] [PubMed] [Google Scholar]
- 17.Schliephake H, Reiss G, Urban R, Neukam FW, Guckel S. Metal release from titanium fixtures during placement in the mandible: an experimental study. Int J Oral Maxillofac Implants. 1993;8:502–511. [PubMed] [Google Scholar]
- 18.Shin DK, Kim MH, Lee SH, Kim TH, Kim SY. Inhibitory effects of luteolin on titanium particle-induced osteolysis in a mouse model. Acta Biomater. 2012;8:3524–3531. doi: 10.1016/j.actbio.2012.05.002. [DOI] [PubMed] [Google Scholar]
- 19.Vandeweghe S, Cosyn J, Thevissen E, Van den Berghe L, De Bruyn H. A 1-year prospective study on Co-Axis implants immediately loaded with a full ceramic crown. Clin Implant Dent Relat Res. 2012;14(Suppl 1):e126–138. doi: 10.1111/j.1708-8208.2011.00391.x. [DOI] [PubMed] [Google Scholar]
- 20.Wennerberg A, Albrektsson T. On implant surfaces: a review of current knowledge and opinions. Int J Oral Maxillofac Implants. 2010;25:63–74. [PubMed] [Google Scholar]
- 21.Wennerberg A, Albrektsson T, Andersson B. An Animal Study of Cp Titanium Screws with Different Surface Topographies. Journal of Materials Science-Materials in Medicine. 1995;6:302–309. [Google Scholar]
- 22.Wennerberg A, Albrektsson T, Ulrich H, Krol JJ. An Optical 3-Dimensional Technique for Topographical Descriptions of Surgical Implants. Journal of Biomedical Engineering. 1992;14:412–418. doi: 10.1016/0141-5425(92)90087-2. [DOI] [PubMed] [Google Scholar]


