Abstract
The interactions among four amino acid analog pairs (Asn, Ser, Phe, and Val) within the membrane environment were investigated using umbrella sampling molecular dynamics simulations. The results confirm generally expected qualitative trends of preferential association of polar compounds inside the membrane vs. preferential interaction of hydrophobic compounds outside the membrane. Furthermore, correlations between amino acid interactions, membrane insertion, and membrane deformations are discussed and a detailed analysis of pair interaction energies is presented. A comparison of the energetics obtained from explicit lipid simulations with those from implicit membrane models reveals significant deviations and an improved parametrization of the HDGB implicit model is provided that partially corrects for deficiencies in the implicit membrane model when compared with the new reference data from this study.
Keywords: lipid bilayer, membrane deformation, pair interactions, membrane insertion, implicit membrane, free energy
Table of Contents (TOC) Image
Introduction
Membrane proteins are involved in a variety of cellular processes such as molecular transport and signaling pathways, and they are the target of many pharmaceutical studies. Membrane proteins are embedded in lipid bilayers that support and modulate their activity.1–3 As with soluble proteins, the interactions among the amino acids and the environment are the primary determinants of membrane protein structure and function.3 Yet, knowledge gaps remain about the fundamental nature of amino acid interactions within the membrane environment. Experimentally, such interactions are notoriously difficult to probe while computational studies have been hindered by the long time scales and complexity of bilayer systems. Therefore, many computational studies of amino acids in bilayer environments rely on simplifications such as coarse-graining4–5 or implicit membrane6–9 models to facilitate the conformational sampling of membrane protein systems10–13 at the expense of neglecting subtle details of amino acid lipid interactions.
The association and insertion of small peptides in aqueous and lipid environments has been the subject of several studies.11–27 In particular, amino acid insertion into membrane bilayers is fairly well understood. MacCallum et al. investigated the insertion of 17 amino acid side chains from the bulk water into membrane region and calculated the distribution of amino acid analogs with respect to the distance from the bilayer center.22 The membrane insertion free energy profiles for each amino acid group (aliphatic, aromatic, and polar side chains) were compared, and it was found that the energetic minimum of aliphatic side chains is at the center of the bilayer, while the free energy minimum for aromatic side chains (Trp, Tyr, Phe) is located near the lipid carbonyl group. Polar residues (Asn, Gln, Ser, and Thr) have large positive free energies at the bilayer center that can be resolved in part by allowing water penetration into the lipid bilayer.22 Membrane deformations are especially dramatic when charged amino acids are inserted as described most clearly for the case of arginine insertion.22
The energetics of amino acid interactions within the membrane is less well understood. Lee and Im28 investigated individual per residue contributions of helix-helix association, found out that that Asn residues contribute the most to the binding free energy. Later, Kim and Im15 studied the interactions of transmembrane (TM) helices with lipid bilayers.15 They decomposed the PMF of helix tilt angles into entropic and helix-lipid interactions, and concluded that helix-lipid interactions provide a driving force for helix orientation under positive hydrophobic mismatch conditions.15 In a recent study, Castillo et al.18 studied the association of two WALP23 peptides in three lipid membrane systems using the MARTINI coarse grained model4. In that study, the peptide-peptide, peptide-lipid, and lipid-lipid interactions upon peptide binding were analyzed and characterized in terms of their thermodynamic behavior. They reported that association of WALP23 peptides is favored by more than 20 kJ/mol, without any free energy barrier separating associated and dissociated states.18 In a more systematic study by de Jong et al.29, the dimerization of amino acid side-chain pairs was simulated using different force fields in water, n-octanol, and decane as mimics of lipid membranes. The general features of favoring association of polar compounds and disfavoring association of hydrophobic compounds in decane and octanol were reproduced but it remains unclear how their results transfer to actual lipid bilayer environments.
In order to better understand amino acid interactions in lipid bilayers, this work describes the association of pairs of four amino acid analogs, acetamide (Asn), methanol (Ser), toluene (Phe), and propane (Val) in DPPC bilayers from extensive biased-sampling all-atom computer simulations. The results provide association free energy profiles and detailed insight into the coupling between inserted amino acid pairs and membrane deformations. Furthermore, the energy profiles were compared with common implicit solvent models30–32 to assess their ability to reproduce amino acid interactions within the membrane.
Materials and Methods
Pairs of four amino acid analogs were considered in this study: toluene-toluene, acetamide-acetamide, methanol-methanol, and propane-propane (Fig. S1). Molecular dynamics umbrella sampling simulations were used to study the interactions among each pair at different positions along the bilayer normal: z=0, 4, 8, 12, 16, 20, 24 Å. The center of mass was restrained to the respective z values using a harmonic potential function with a force constant of 50 kcal/mol/Å2. The center of mass distance between the analogs was then varied from 3 Å to 15 Å with increments of 0.5 Å. At each distance, umbrella sampling was carried out33 using a force constant of 5 kcal/mol/Å2 to maintain the respective distances. Initial systems were set up by placing the pair of molecules inside two spheres that were created inside the membrane at different values of z. Two sets of umbrella sampling simulations were carried out. In one set (called forward sampling), the amino acid analogs were initially equilibrated at a distance of 5 Å, and then after 2 ns simulation, the pair distance was decreased to 4.5, 4, 3.5 and 3 Å as well as increased to 5.5, 6, 6.5 … 15 Å in subsequent simulations. In the second set (called backward sampling), the pair was initially equilibrated for 2 ns at a distance of 15 Å and then pulled to increasingly shorter distances up to 3 Å.
Explicit Solvent Simulations
A membrane bilayer consisting of 288 DPPC molecules was constructed and enclosed in a periodic box with a fixed lateral size of 95.24 Å × 95.24 Å. The non-bonded interactions were cut off at distance of 10 Å (with a switching function beginning at 8.5 Å), and for long range electrostatic interactions particle-mesh Ewald (PME) with a grid spacing of 1 Å was used. The simulations were performed using the NAMD molecular dynamics package34, under NPAT conditions using Langevin dynamics with a temperature of 323 K, and a constant normal pressure of 1 bar. A time step of 2 fs was used in conjunction with SHAKE. The CHARMM36 force field35 was used to model the lipids, the CHARMM General force field (CGenFF)36 for the amino acid analogs, and the TIP3 water model37 was used.
Initial configurations were minimized for 500 steps and then heated and equilibrated to temperatures of 20 K, 100 K, 250 K and 323 K for 2 ps, 2 ps, 2 ps, and 10 ps, respectively under the restraining potentials with respect to the pair distance and the z position of the pair. The overall center of mass of the lipids was also restrained to zero using a force constant of 100 kcal/mol/Å2. Subsequent umbrella runs were started from the previous 2 ns production run, and equilibrated and heated to 100 K, 250 K, and 323 K with their corresponding umbrella potential.
The first 2 ns of each simulation was discarded, and the rest of the data was used for calculating PMFs. To assess convergence, the root mean squared deviations (RMSD) between the potentials of mean force (PMF) at a given distance were compared between the forward and backward sets. Simulations were initially carried out for 6 ns per umbrella and continued in both sets until an RMSD value of less than 0.2 kcal/mol was achieved (see Figure S2). For some umbrellas this required as much as 200 ns with explicit solvent and lipids (see Table S1). Generally, polar compounds required more sampling because of coupling with membrane deformations as discussed below. The total simulation time for acetamide and methanol pairs were 10.4 µs and 8.0 µs, respectively, whereas for toluene and propane the aggregate simulation times were 6.8 µs and 2.1 µs. Weighted histogram analysis method (WHAM)38 was used to generate a composite unbiased PMF from the individual umbrellas along the entire range of pair distances. Finally, the effect of transforming the Cartesian coordinate into a pair distance reaction coordinate was corrected by subtracting the Jacobian contribution as described by Kim and Im15.
Implicit Solvent Simulations
Three implicit solvent models were considered in this study, HDGB, GBSW, and IMM1, the implicit membrane extension of EEF1. The implicit solvent simulations were run using CHARMM39 following the same umbrella sampling protocol as with the explicit lipids and solvent but with a shorter time of 1.5 ns per umbrella that was sufficient to satisfy the convergence criterion. All the initial systems underwent 50 steepest descent energy minimization steps followed by 500 adopted basis Newton Raphson method. Then the systems were heated to 100 K, 200 K, and 323 K for 500 MD steps. The production runs were performed for 1.5 ns in each direction. For HDGB simulations, the dielectric and non-polar profiles along the Z axis were adopted from Sayadi et al.10 (also shown in table S2). A scaling factor of 0.015 kcal/mol/Å2 was used to obtain non-polar solvation free energies proportional to the solvent-accessible surface area (SASA).40 For GBSW simulations, the implicit membrane thickness was set to 28 Å, a switching length of 2.5 Å was used and the non-polar scaling factor was set to 0.030 kcal/mol/ Å2. In the case of IMM1 model, a membrane thickness of 28 Å was used as well. For IMM1, the amino acid analog parameters were directly adopted from their corresponding amino acids in the EEF1 model without further modifications. With the given parameters, all three implicit solvent models are meant to approximate the energetics of a DPPC bilayer.
Bilayer Deformation Simulation
For certain separation distances and certain values of z, membrane bilayer deformations were observed with acetamide and methanol pairs (see results section). In most cases, forward and backward umbrellas exhibited the same behavior (deformed or undeformed membrane), but in a few cases bistable behavior was observed where forward and backward sampling did not converge to the same state and where the membrane was deformed in one case but not the other. In order to be able to generate a complete free energy profile we carried out additional umbrella biasing simulations at a fixed distance and z value but varying the degree of bilayer deformation.
To connect states with different degrees of membrane deformation we employed a recently introduced density-biasing approach41. In this method, an imaginary cylinder is placed along the bilayer normal axis. A volume function V is defined with two independent radial and axial components with a value of 1 inside the cylinder that is smoothly switched to zero to points outside the cylinder. The integral of the volume function over all water molecules gives the number of water molecules within the volume, which once normalized by the cylinder volume, is used as the reaction coordinate where low water density corresponds to an undeformed bilayer and high water density indicates deformation. In this case, a cylinder with radius 8 Å was used, spanning from z=−2.5 to z=15 Å, with the switching region set to 1 and 5 Å in radial and axial directions, respectively. Umbrella sampling was then used to vary the water density in the cylinder from 0.0011 Å−3 to 0.0171 Å−3 over eight umbrella windows with a force constant of 1,225,000 kcal/mol/Å−6. Due to convergence issues, the number of umbrellas was increased to 16 for methanol at z=4 Å. An additional restraint was applied to the phosphates of the lower leaflet if their distance to the bilayer center became less than 8 Å in order to prevent deformation of the lower leaflet. Density biased molecular dynamics simulations were carried out for 48 ns for each umbrella. The water-density biasing simulations were combined with the distance-based umbrella simulations to generate 2D PMFs as a function of the pair distance (ξ) and water density (ρ) using WHAM38. Final 1D PMF profiles as a function of the pair distance (ξ) were obtained by Boltzmann averaging according to Eq. 1
| (1) |
Results and Discussion
Results from extensive biased molecular dynamics simulations are presented that describe the pairwise interactions between acetamide, methanol, toluene, and propane pairs at different distances from the center of a lipid bilayer. Although the main focus of this study is on the amino acid interactions within lipid bilayers, we observed significant coupling with the lipid bilayer structure, which will be described first before continuing to amino acid association energetics and structural details.
Membrane Deformations
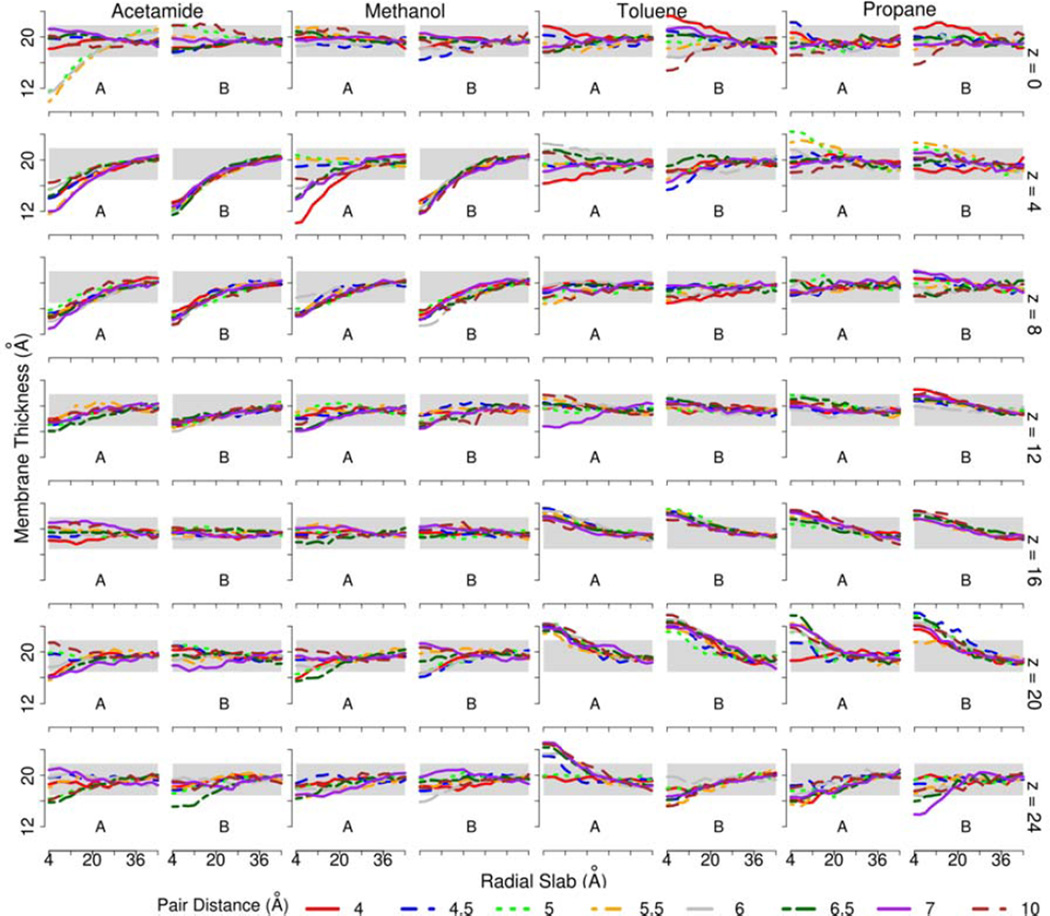
Because none of the compounds are charged, we initially assumed that membrane deformations would be modest and limited to cases where the analogs are near the membrane surface. However, we found significant membrane deformations even for deeply inserted acetamide and methanol pairs as shown in Figure 1. In the case of acetamide, deep deformations of the bilayer are observed consistently at z=4 Å and z=8 Å. When the acetamide pair is at the center (z=0), deformations are observed in some of the umbrellas and only at some pair distances suggesting a bi-stable scenario where deformed and undeformed membrane states are favorable but separated by a kinetic barrier. Methanol pairs also result in membrane deformations at z=4 Å and z=8 Å but not at z=0. At z=4 Å, the sampling is again bi-stable with all of the backward sampling umbrellas showing a deformed membrane while the membrane is deformed only at three pair distances in the forward sampling umbrellas. The non-polar compounds toluene and propane do not lead to water insertion when inserted deeply but when fixed at z=16 Å and z=20 Å the bilayer expands to accommodate the hydrophobic pairs. The membrane deformation largely disappears when the pairs are placed even further away from the center at z=24 Å.
Figure 1.
Local membrane thickness of the upper leaflet as a function of the radial distance from the center of the amino acid analog pairs at different distances from the center of the membrane. A: sampling in forward direction; B: sampling in backward direction.
Local thickness is calculated as average z of phosphorous atoms in the upper leaflet which fall into radial slabs of width 4 Å.
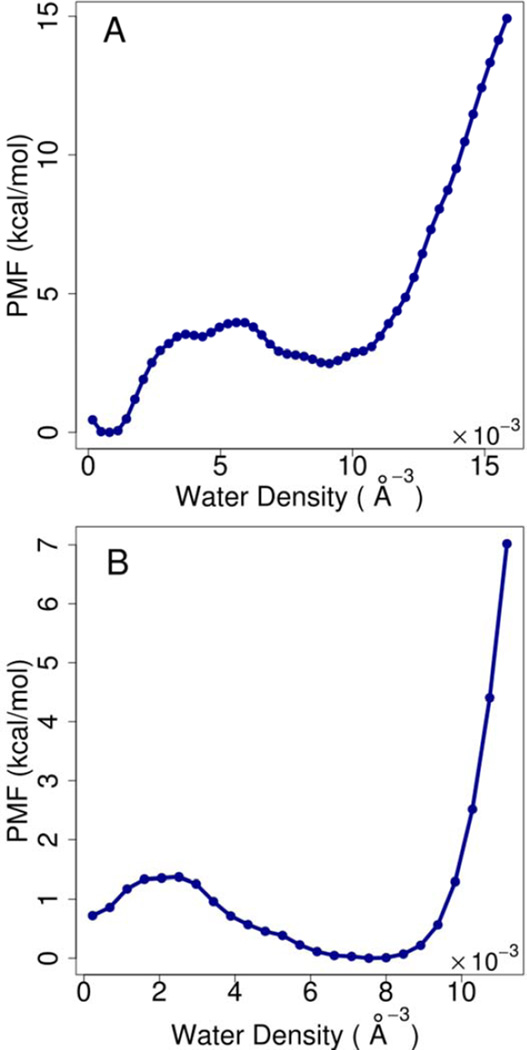
In order to further understand the bi-stable membrane deformation states for acetamide and methanol, we carried out additional density-biasing umbrella sampling simulations along the deformation reaction coordinate for acetamide and methanol pairs at z=0 and z=4 Å and at short pairwise distances where the bi-stable behavior was observed. The results are shown in Figure 2. In both cases, two states are found, separated by a kinetic barrier. In the case of acetamide, the undeformed membrane appears more favorable than deformed bilayer at z=0 Å; for methanol the deformed membrane appears to be slightly more favorable when the pair is placed at z=4 Å. Water density biasing simulations were also carried out for additional pair distances of 5 and 6 Å for acetamide in order to be able to connect the forward and backward umbrella sampling sets (see below).
Figure 2.
Potentials of mean force as a function of water density to reflect membrane deformation. A: acetamide pair at z=0 and d=5.5 Å; B: methanol pair at z=0 and d=4.5 Å.
Association Free Energy Profiles
A main goal of this study is to obtain free energy profiles for amino acid side chain analog association within lipid bilayer environments. Umbrella sampling along the pair distance reaction coordinate was carried out at different membrane insertion depths and a comparison between forward and backward sampling umbrella runs was used to assess satisfactory convergence. As shown in Figure S2, convergence, defined as an RMSD of less than 0.2 kcal/mol between forward and backward runs, was achieved for almost all windows except for acetamide and methanol at certain short distances and deep membrane insertions. These cases correspond to the bi-stable membrane deformation scenario described above where both deformed and undeformed membranes are favorable but transitions between the two states are not sampled in the pair distance umbrella simulations. The additional water-density biasing simulations described above provide access to that transition and a combination of the pair distance umbrella runs with the water-density umbrella runs was necessary to obtain a complete energetic picture. In order to do so, two-dimensional PMFs as a function of pairwise distance and water density were constructed from the combined sampling (see Fig. S3 and S4) and then integrated using Boltzmann averaging along the density reaction coordinate to obtain correct one-dimensional PMFs as a function of the pair distance. When compared to the naïve case where the pair distance umbrella runs are simply combined without considering that in fact disconnected states are sampled, the corrected PMFs differ by 0.25–0.5 kcal/mol (see Fig. S3 and S4). For other pairs, distances, and membrane insertions, such a correction was not necessary because forward and backward sampling umbrella appear to have reached convergence.
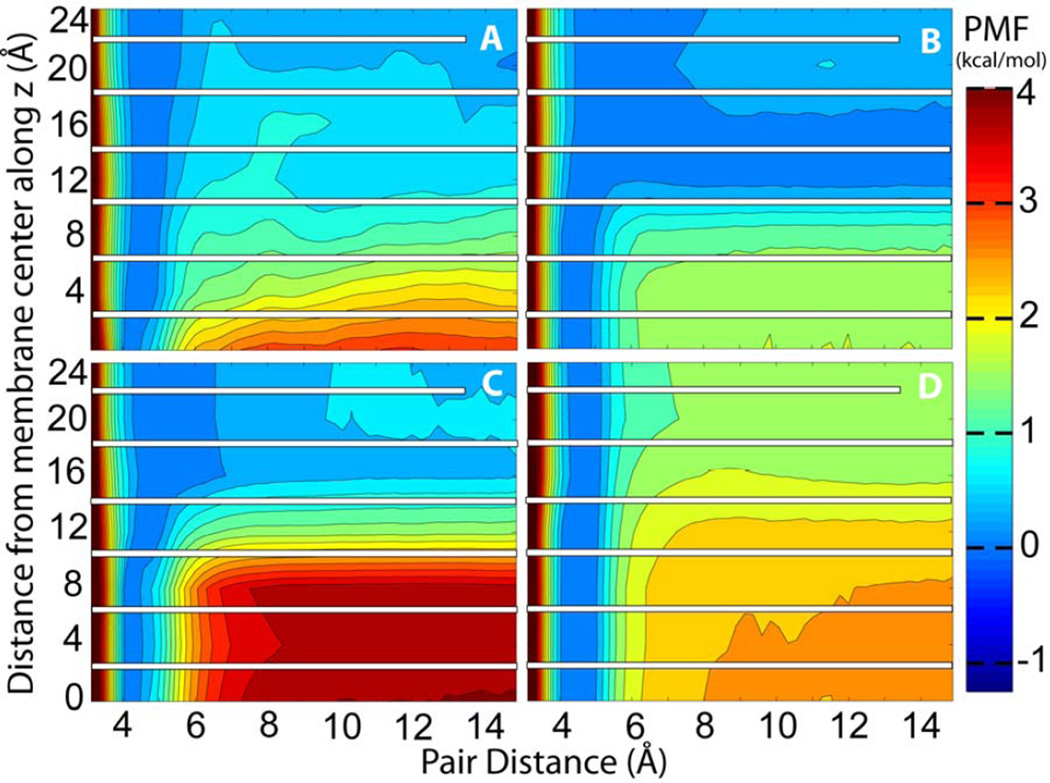
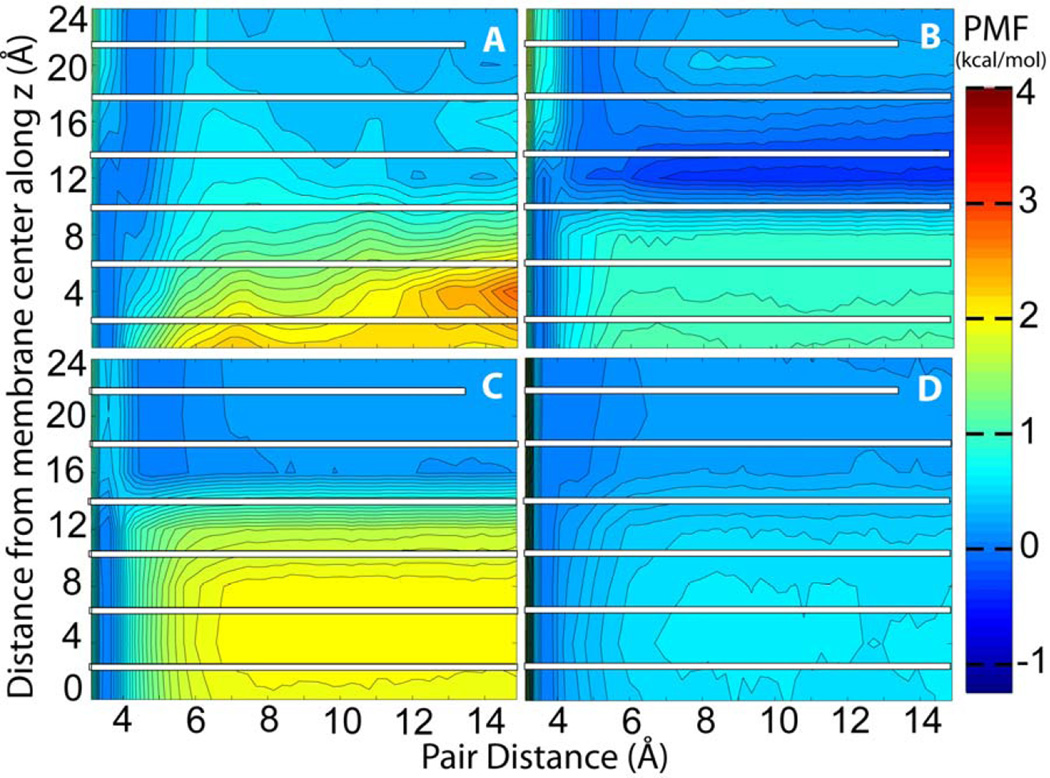
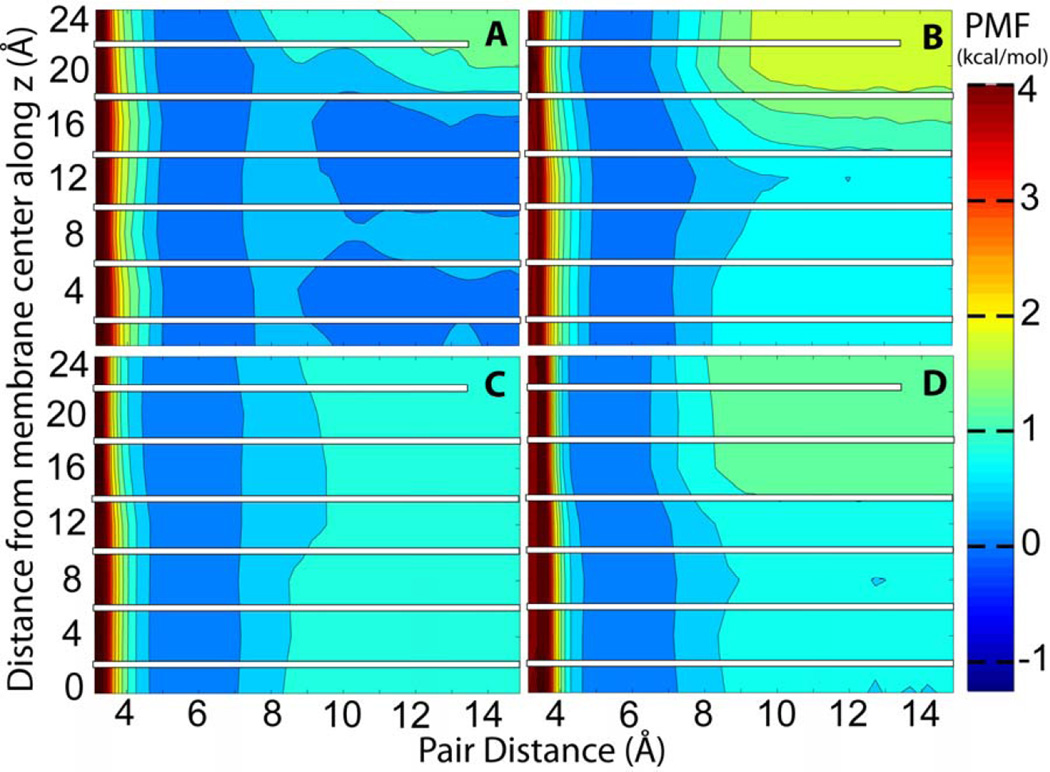
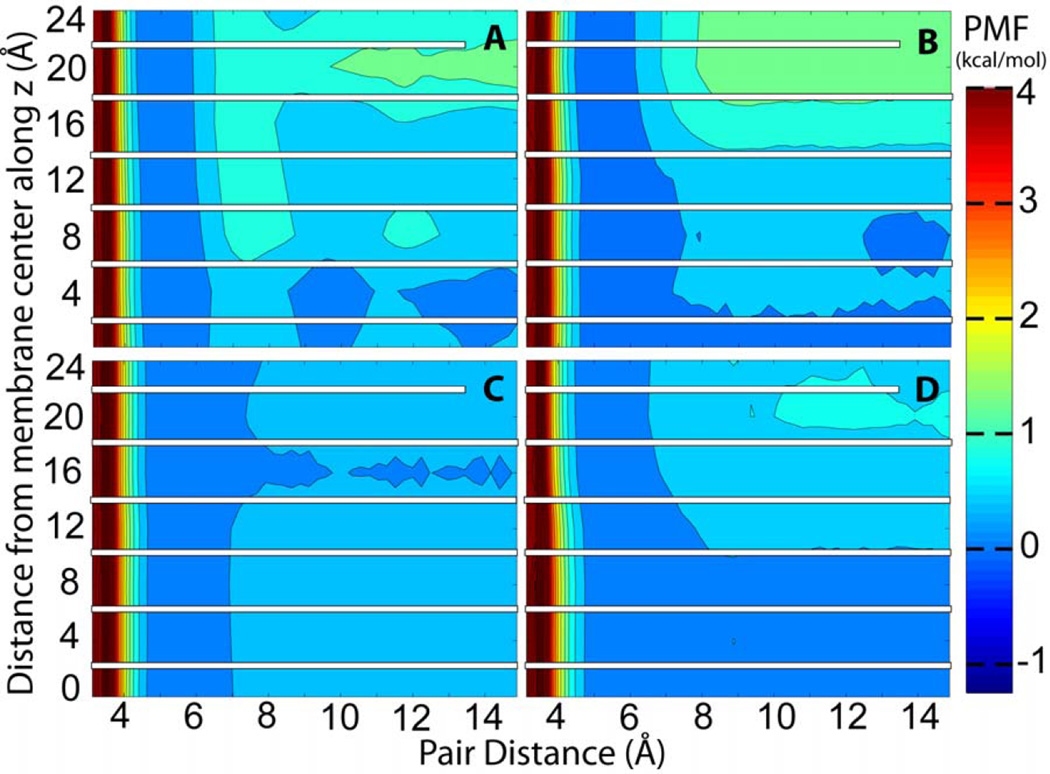
The complete association energy profiles as a function of pair distance and membrane insertion are presented in Figures 3A, 4A, 5A, and 6A. These profiles include the corrected PMF profiles for acetamide at z=0 Å and for methanol at z=4 Å. We note that because the pairs were fixed at certain insertion depths the present simulations do not provide information about the relative free energies along the z direction. Instead, the PMFs are combined so that the contact pair has the same free energy at all values of z. Information about membrane insertion free energies is available from previous studies while adequate sampling of membrane insertion along with separation within the membrane would have greatly increased the need for additional sampling beyond what we can accomplish with the resources available to us. Overall, the free energy analysis confirms what would be expected qualitatively: both acetamide and methanol have a deep minimum when forming a contact pair inside the membrane but separating the pair becomes increasingly favorable towards the edge of the bilayer where the polar molecules can interact with water rather than with each other. At z=0 Å the acetamide pair is stabilized by as much as 3.20 kcal/mol while the methanol pair is stabilized by about 2.16 kcal/mol. Toluene and propane pairs on the other hand are weakly favoring association in the membrane while show stronger association at the edge of the bilayer as would be expected for hydrophobic compounds. For all compounds there is a ‘desolvation’ peak immediately after separating the contact pair with an energetic penalty of 0.5 to 1 kcal/mol.
Figure 3.
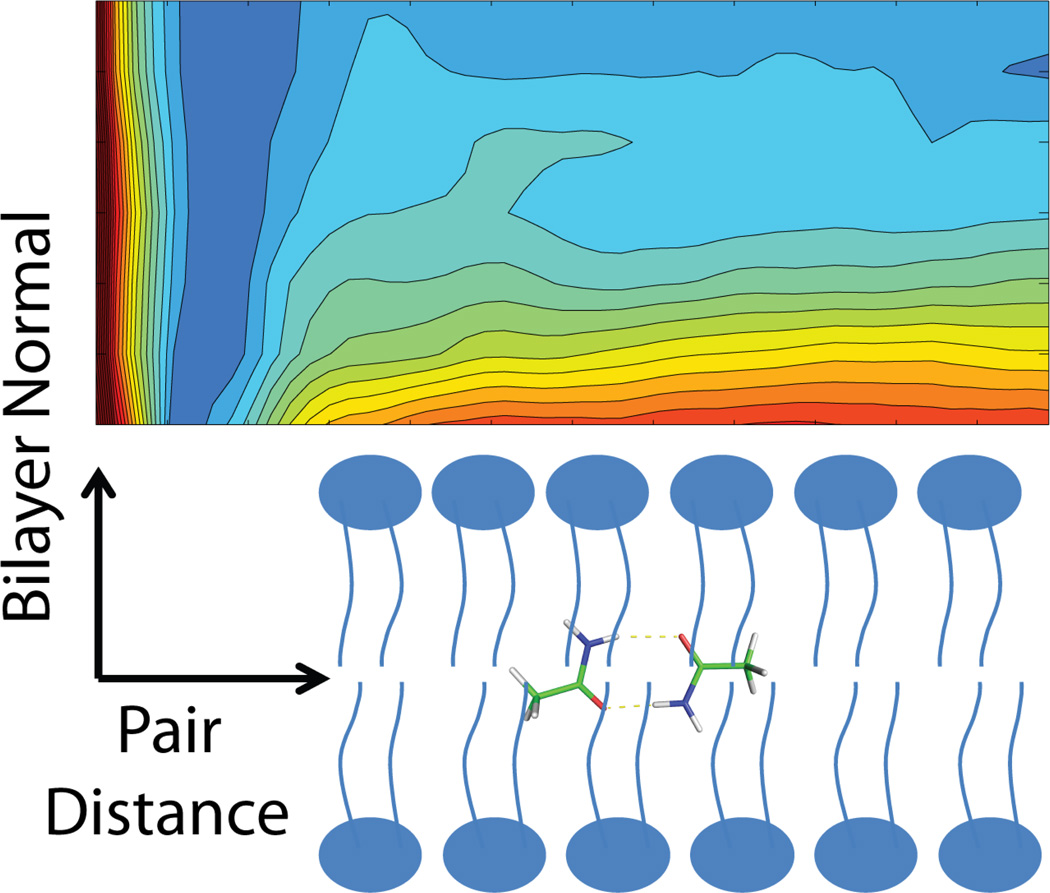
Potential of mean force for acetamide as a function of pair distance at different insertion depth into the lipid bilayer from simulations with A) explicit solvent and lipids B) HDGB implicit membrane C) GBSW implicit membrane and D) IMM1 implicit membrane models; For each insertion depth, the bound state was used as the reference with an energy of zero. The white bars indicate a lack of sampling overlap along the z direction.
Figure 4.
PMF of methanol as in Fig. 3.
Figure 5.
PMF of toluene as in Fig. 3.
Figure 6.
PMF of propane as in Fig. 3.
The pair binding free energies obtained from the PMF profiles as the difference between the free energy at the contact pair and at the greatest pair distance considered here can be compared to previous results for pair formation in different solvents by de Jong et al29 with GROMOS42 and OPLS43 force fields (Table 1). More specifically, we compare our results at z=0, 12, and 24 Å insertion depths to the values obtained in decane, octanol and water, respectively. Overall, the agreement is good especially if one considers differences in force fields, the oversimplification of using decane and octanol as mimics of lipid bilayer environments, and the missing contribution due to membrane deformations with the simple hydrophobic solvents. However, taking the data at face value, it appears that the agreement with the OPLS results is better while GROMOS may be overestimating contact pair formation in decane except for propane.
Table 1.
Binding free energies in kcal/mol obtained from explicit simulations (CHARMM) at different Z distances as the difference between the free energy for the contact pair and the average energy for distances greater than 10 Å. Standard errors are given in parentheses. Values obtained at z=0, 12 Å, and 24 Å are compared with values obtained previously in decane, octanol, and water by de Jong et al.29.
| 0 | 4 | 8 | 12 | 16 | 20 | 24 | ||
|---|---|---|---|---|---|---|---|---|
| Acetamide | CHARMM | −3.20 (0.02) |
−2.23 (0.04) |
−1.22 (0.05) |
−0.64 (0.03) |
−0.68 (0.06) |
−0.46 (0.03) |
−0.39 (0.01) |
| GROMOS29 | −4.21 | 0.06 | 0.13 | |||||
| OPLS29 | NA | −0.31 | 0.04 | |||||
| Methanol | CHARMM | −2.16 (0.03) |
−2.31 (0.06) |
−1.27 (0.11) |
−0.43 (0.03) |
−0.54 (0.05) |
−0.32 (0.02) |
−0.35 (0.01) |
| GROMOS | −2.72 | −0.10 | 0.34 | |||||
| OPLS | −1.37 | −0.19 | 0.32 | |||||
| Toluene | CHARMM | −0.35 (0.01) |
−0.23 (0.02) |
−0.57 (0.03) |
−0.09 (0.05) |
−0.22 (0.02) |
−1.09 (0.03) |
−1.33 (0.08) |
| GROMOS | −1.09 | 0.21 | −0.29 | |||||
| OPLS | −0.31 | −0.03 | −0.47 | |||||
| Propane | CHARMM | −0.45 (0.02) |
−0.34 (0.03) |
−0.74 (0.04) |
−0.57 (0.09) |
−0.64 (0.09) |
−1.41 (0.05) |
−0.85 (0.02) |
| GROMOS | −0.04 | −0.38 | −0.06 | |||||
| OPLS | −0.06 | −0.11 | −0.06 |
Contact Pair Formation of Polar Compounds
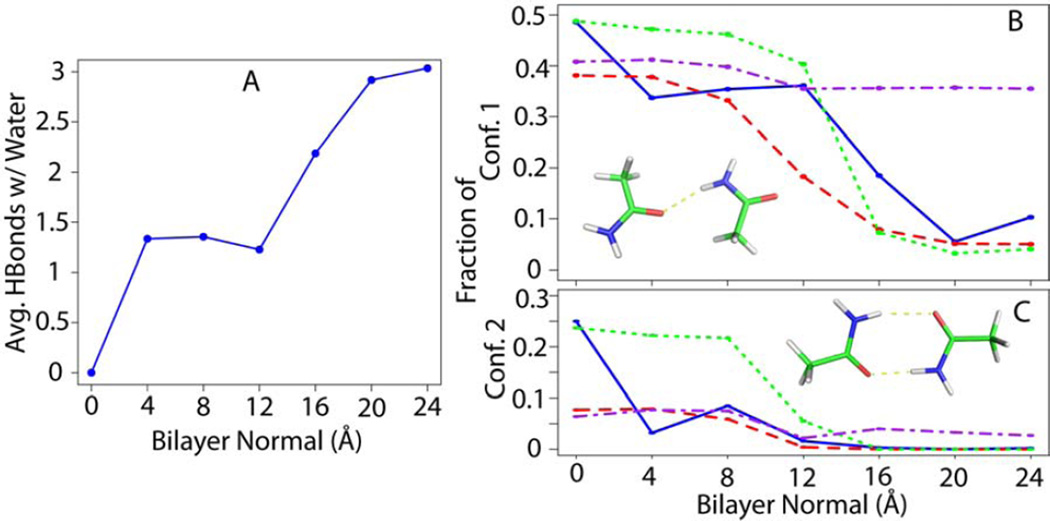
Closer inspection of the conformations of the polar side-chain pairs (acetamide and methanol) indicate a conformational bias at the bound state as a function of the presence or absence of water molecules around the pair, while conformational analysis of the hydrophobic compounds, on the other hand, did not reveal any noticeable difference along the bilayer normal. We refer to the bound state as the closest pair distance where the association profile is still favorable, while the longest pair distance is referred to as the free state. We observed that relative population of different conformations of acetamide and methanol pairs at the bound state are directly related to the number of hydrogen bonds they form with water molecules. By clustering acetamide pair conformations at the local minimum of the free energy profiles (d=4 Å), we distinguished three different conformations that could form 0, 1 and 2 hydrogen bonds within the pair. Figure 7 shows the relative population of conformations that form two or one hydrogen bond, as a function of the distance from the bilayer center. At z=0, no hydrogen bond is formed with water molecules because the membrane is not deformed, and as a result the percentage of conformations forming two hydrogen bonds within the pair is 25%. This value decreases as the pair moves to z=4 Å, due to membrane deformation that allow the formation of hydrogen bonds with water.
Figure 7.
Conformational analysis of acetamide pair at the bound state; A) average hydrogen bonds formed between acetamide pair and water molecules as a function of bilayer normal distance, B) fraction of conformations that form one intra-pair hydrogen bond, C) fraction of conformations forming two intra-pair hydrogen bonds; The results of explicit (blue), HDGB (red), GBSW (green), and IMM1 (purple) are compared.
Methanol shows a shift in the contact pair distance from 3.5 Å for z values below 10 Å to a distance of 4.5 Å for z values above 12 Å (see Fig. 4A). The corresponding conformations are shown in Figure 8. At deeper insertion depths the methyl groups are exposed to the hydrophobic environment while self-interactions between the two hydroxyl groups are maximized, leading to a shorter center of mass distance. On the other hand, at shallower insertion depths, the hydroxyl groups is exposed to the environment while the methyl groups interact with each other so that they are shielded from the more polar environment.
Figure 8.
Two representative bound conformation for methanol pair resulting in a different binding distance.
Comparison with Implicit Membrane Models
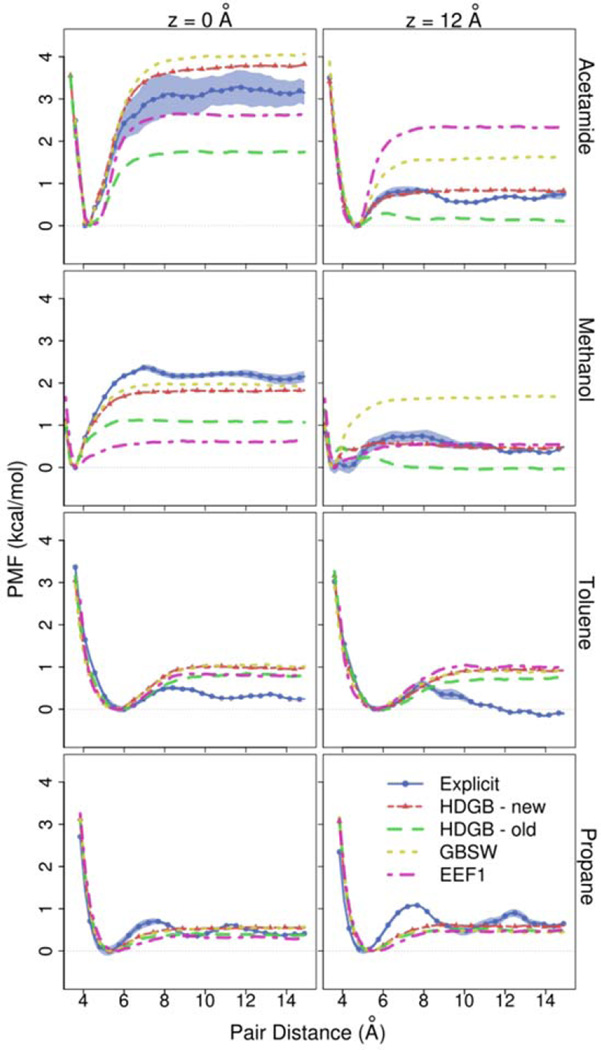
The data presented here is especially useful for parameterizing simplified models of membrane environment. Implicit membrane models have been previously parameterized using amino acid side chain insertion free energies but so far little attention has been paid to how well implicit membrane models can capture interactions of solutes within the membrane. Figures 3–6 compare the association free energy PMFs for acetamide, methanol, toluene, and propane with HDGB, GBSW, and IMM1 to the explicit solvent results. Note, that the insertion profiles given by MacCallum et al.22 show that the most favorable region along bilayer normal for acetamide and methanol is around z=12 Å, while toluene and propane favor the bilayer center. Very qualitatively, the main trends are more or less reproduced, but, in detail, there are quite significant differences. For example, GBSW overestimates the binding free energy of acetamide in the membrane. In the case of methanol, both HDGB and IMM1 do not find a significant favorable binding energy at z=0, only GBSW captures the explicit lipid trend correctly. HDGB and GBSW do capture the shift from favoring the hydroxyl-interacting close distance contact pairs at deep insertion to the methyl-interacting longer contact pair beyond 10–12 Å while IMM1 does not. For the non-polar compounds the differences are less dramatic but nevertheless significant when compared to the explicit lipid simulations. For example, GBSW shows little variation as a function of z while HDGB appears to overemphasize the attraction of hydrophobic pairs near the aqueous phase.
Based on the new data from this study we attempted to improve the parameterization of the HDGB model that was previously developed in our group. Specifically, we adjusted the dielectric profile as well as the overall scaling factor γ for the non-polar contribution to improve agreement with the pair distance free energies within the membrane while maintaining good agreement with membrane insertion free energies of single amino acid side chain analogs. The overall scaling factor was set to 0.02 kcal/mol/Å2. The optimized dielectric profile is given in Table S2 along with the (unmodified) non-polar profile. Figure 9 focuses on the distance profiles at z=0 and z=12 Å for the four analog pairs with the original and improved HDGB model. As can be seen, it is possible to significantly improve the agreement between the implicit membrane model and the explicit lipid results. At the same time, amino acid insertion profiles for 14 amino acid side-chain analogs are in similar agreement with results from explicit simulation22 and experimental measurements44 as for the previous HDGB parameterization (see Fig. S5). Nevertheless, with the modified parameters, the association free energy is now overestimated for acetamide at z=0 while dissociated toluene is still not favorable enough, especially for z=12 Å. The use of an implicit model that would allow membrane deformations such as the DHDGB model9 that may improve the agreement with the explicit lipid results. Another possibility is the inclusion of implicit van der Waals interactions that are expected to become more important in the membrane environment as the role of electrostatics decreases due to the hydrophobic environment.
Figure 9.
PMF profiles for acetamide, methanol, toluene, and propane at Z=0 and Z=12 as a function of the pair distance obtained from explicit, HDGB, GBSW, and EEF1 models
Conclusions
In this study, we are presenting a detailed energetic and structural analysis of amino acid side chain analog interactions within lipid bilayer environments which has received little attention in previous studies. Qualitatively, we confirm expected trends of polar compounds associating strongly inside lipid bilayers compared to hydrophobic compounds. Furthermore, we present detailed quantitative data about the energetics of pair formation at different membrane insertion depths that required a careful analysis of the coupling between amino acid pair interactions and membrane deformations.
The presented data is especially useful for the validation and parameterization of simplified membrane models. We show that established implicit membrane models have difficulties to reproduce the association energetics described here. However, it was possible to improve the HDGB model to better reproduce the new data from this study while maintaining good insertion free energy profiles. In future studies we will aim to further improve the implicit membrane model by considering membrane deformations and implicit van der Waals terms.
Supplementary Material
Acknowledgements
This work was supported in part by National Institute of Health Grant GM084953. Computational resources for this work were provided by XSEDE facilities (TG-MCB090003) and the High Performance Computing Center at Michigan State University (HPCC@MSU).
Footnotes
Supporting Information Available
Additional tables and figures with details of the umbrella sampling, the new HDGB profile, structures of amino-acid analogs, evidence for sampling convergence, and details about free energy components are provided. This information is available free of charge via the Internet at http://pubs.acs.org.
References
- 1.Ostrom RS, Insel PA. The evolving role of lipid rafts and caveolae in G protein-coupled receptor signaling: implications for molecular pharmacology. British Journal of Pharmacology. 2004;143(2):235–245. doi: 10.1038/sj.bjp.0705930. [DOI] [PMC free article] [PubMed] [Google Scholar]
- 2.Bennett WFD, Tieleman DP. Computer simulations of lipid membrane domains. Biochimica et Biophysica Acta (BBA) - Biomembranes. 2013;1828(8):1765–1776. doi: 10.1016/j.bbamem.2013.03.004. [DOI] [PubMed] [Google Scholar]
- 3.Andersen OS, Koeppe RE. Bilayer Thickness and Membrane Protein Function: An Energetic Perspective. Annual Review of Biophysics and Biomolecular Structure. 2007;36(1):107–130. doi: 10.1146/annurev.biophys.36.040306.132643. [DOI] [PubMed] [Google Scholar]
- 4.Marrink SJ, Risselada HJ, Yefimov S, Tieleman DP, de Vries AH. The MARTINI force field: Coarse grained model for biomolecular simulations. J. Phys. Chem. B. 2007;111(27):7812–7824. doi: 10.1021/jp071097f. [DOI] [PubMed] [Google Scholar]
- 5.Kar P, Gopal SM, Cheng Y-M, Predeus A, Feig M. PRIMO: A Transferable Coarse-Grained Force Field for Proteins. J. Chem. Theory Comput. 2013 doi: 10.1021/ct400230y. [DOI] [PMC free article] [PubMed] [Google Scholar]
- 6.Im W, Feig M, Brooks CL. An Implicit Membrane Generalized Born Theory for the Study of Structure, Stability, and Interactions of Membrane Proteins. Biophysical Journal. 2003;85(5):2900–2918. doi: 10.1016/S0006-3495(03)74712-2. [DOI] [PMC free article] [PubMed] [Google Scholar]
- 7.Lazaridis T. Effective energy function for proteins in lipid membranes. Proteins: Structure, Function, and Bioinformatics. 2003;52(2):176–192. doi: 10.1002/prot.10410. [DOI] [PubMed] [Google Scholar]
- 8.Tanizaki S, Feig M. A generalized Born formalism for heterogeneous dielectric environments: Application to the implicit modeling of biological membranes. The Journal of Chemical Physics. 2005;122(12):124706–124713. doi: 10.1063/1.1865992. [DOI] [PubMed] [Google Scholar]
- 9.Panahi A, Feig M. Dynamic Heterogeneous Dielectric Generalized Born (DHDGB): An Implicit Membrane Model with a Dynamically Varying Bilayer Thickness. J. Chem. Theory Comput. 2013;9(3):1709–1719. doi: 10.1021/ct300975k. [DOI] [PMC free article] [PubMed] [Google Scholar]
- 10.Sayadi M, Tanizaki S, Feig M. Effect of Membrane Thickness on Conformational Sampling of Phospholamban from Computer Simulations. Biophysical Journal. 2010;98(5):805–814. doi: 10.1016/j.bpj.2009.11.015. [DOI] [PMC free article] [PubMed] [Google Scholar]
- 11.Panahi A, Feig M. Conformational Sampling of Influenza Fusion Peptide in Membrane Bilayers as a Function of Termini and Protonation States. The Journal of Physical Chemistry B. 2009;114(3):1407–1416. doi: 10.1021/jp907366g. [DOI] [PubMed] [Google Scholar]
- 12.Latorraca NR, Callenberg KM, Boyle JP, Grabe M. Continuum Approaches to Understanding Ion and Peptide Interactions with the Membrane. J Membrane Biol. 2014;247(5):395–408. doi: 10.1007/s00232-014-9646-z. [DOI] [PMC free article] [PubMed] [Google Scholar]
- 13.Brannigan G, Brown FLH. Contributions of Gaussian Curvature and Nonconstant Lipid Volume to Protein Deformation of Lipid Bilayers. Biophysical Journal. 2007;92(3):864–876. doi: 10.1529/biophysj.106.094953. [DOI] [PMC free article] [PubMed] [Google Scholar]
- 14.Esteban-Martín S, Salgado J. The Dynamic Orientation of Membrane-Bound Peptides: Bridging Simulations and Experiments. Biophysical Journal. 2007;93(12):4278–4288. doi: 10.1529/biophysj.107.113043. [DOI] [PMC free article] [PubMed] [Google Scholar]
- 15.Kim T, Im W. Revisiting Hydrophobic Mismatch with Free Energy Simulation Studies of Transmembrane Helix Tilt and Rotation. Biophysical Journal. 2010;99(1):175–183. doi: 10.1016/j.bpj.2010.04.015. [DOI] [PMC free article] [PubMed] [Google Scholar]
- 16.Lee J, Im W. Transmembrane Helix Tilting: Insights from Calculating the Potential of Mean Force. Physical Review Letters. 2008;100(1) doi: 10.1103/PhysRevLett.100.018103. [DOI] [PubMed] [Google Scholar]
- 17.Park SH, Opella SJ. Tilt Angle of a Trans-membrane Helix is Determined by Hydrophobic Mismatch. Journal of Molecular Biology. 2005;350(2):310–318. doi: 10.1016/j.jmb.2005.05.004. [DOI] [PubMed] [Google Scholar]
- 18.Castillo N, Monticelli L, Barnoud J, Tieleman DP. Free energy of WALP23 dimer association in DMPC, DPPC, and DOPC bilayers. Chem. Phys. Lipids. 2013;169:95–105. doi: 10.1016/j.chemphyslip.2013.02.001. [DOI] [PubMed] [Google Scholar]
- 19.Lagüe P, Zuckermann MJ, Roux B. Lipid-Mediated Interactions between Intrinsic Membrane Proteins: Dependence on Protein Size and Lipid Composition. Biophysical Journal. 2001;81(1):276–284. doi: 10.1016/S0006-3495(01)75698-6. [DOI] [PMC free article] [PubMed] [Google Scholar]
- 20.de Meyer FJM, Venturoli M, Smit B. Molecular simulations of lipid-mediated protein-protein interactions. Biophysical Journal. 2008;95(4):1851–1865. doi: 10.1529/biophysj.107.124164. [DOI] [PMC free article] [PubMed] [Google Scholar]
- 21.Benjamini A, Smit B. Robust Driving Forces for Transmembrane Helix Packing. Biophysical Journal. 2012;103(6):1227–1235. doi: 10.1016/j.bpj.2012.08.035. [DOI] [PMC free article] [PubMed] [Google Scholar]
- 22.MacCallum JL, Bennett WFD, Tieleman DP. Distribution of Amino Acids in a Lipid Bilayer from Computer Simulations. Biophysical Journal. 2008;94(9):3393–3404. doi: 10.1529/biophysj.107.112805. [DOI] [PMC free article] [PubMed] [Google Scholar]
- 23.Im W, Brooks CL. Interfacial folding and membrane insertion of designed peptides studied by molecular dynamics simulations. Proceedings of the National Academy of Sciences of the United States of America. 2005;102(19):6771–6776. doi: 10.1073/pnas.0408135102. [DOI] [PMC free article] [PubMed] [Google Scholar]
- 24.Choe S, Hecht KA, Grabe M. A Continuum Method for Determining Membrane Protein Insertion Energies and the Problem of Charged Residues. The Journal of General Physiology. 2008;131(6):563–573. doi: 10.1085/jgp.200809959. [DOI] [PMC free article] [PubMed] [Google Scholar]
- 25.Aranda-Espinoza H, Berman A, Dan N, Pincus P, Safran S. Interaction between inclusions embedded in membranes. Biophysical Journal. 1996;71(2):648–656. doi: 10.1016/S0006-3495(96)79265-2. [DOI] [PMC free article] [PubMed] [Google Scholar]
- 26.Mondal S, Khelashvili G, Weinstein H. Not Just an Oil Slick: How the Energetics of Protein-Membrane Interactions Impacts the Function and Organization of Transmembrane Proteins. Biophysical Journal. 2014;106(11):2305–2316. doi: 10.1016/j.bpj.2014.04.032. [DOI] [PMC free article] [PubMed] [Google Scholar]
- 27.Tieleman DP, MacCallum JL, Ash WL, Kandt C, Xu Z, Monticelli L. Membrane protein simulations with a united-atom lipid and all-atom protein model: lipid–protein interactions, side chain transfer free energies and model proteins. Journal of Physics: Condensed Matter. 2006;18(28):S1221–S1234. doi: 10.1088/0953-8984/18/28/S07. [DOI] [PubMed] [Google Scholar]
- 28.Lee J, Im W. Role of Hydrogen Bonding and Helix–Lipid Interactions in Transmembrane Helix Association. Journal of the American Chemical Society. 2008;130(20):6456–6462. doi: 10.1021/ja711239h. [DOI] [PubMed] [Google Scholar]
- 29.de Jong DH, Periole X, Marrink SJ. Dimerization of Amino Acid Side Chains: Lessons from the Comparison of Different Force Fields. J. Chem. Theory Comput. 2012;8(3):1003–1014. doi: 10.1021/ct200599d. [DOI] [PubMed] [Google Scholar]
- 30.Knight JL, Brooks CL. Surveying implicit solvent models for estimating small molecule absolute hydration free energies. J. Comput. Chem. 2011;32(13):2909–2923. doi: 10.1002/jcc.21876. [DOI] [PMC free article] [PubMed] [Google Scholar]
- 31.Im W, Lee MS, Brooks CL. Generalized born model with a simple smoothing function. J. Comput. Chem. 2003;24(14):1691–1702. doi: 10.1002/jcc.10321. [DOI] [PubMed] [Google Scholar]
- 32.Lazaridis T, Karplus M. Effective energy function for proteins in solution. Proteins: Structure, Function, and Bioinformatics. 1999;35(2):133–152. doi: 10.1002/(sici)1097-0134(19990501)35:2<133::aid-prot1>3.0.co;2-n. [DOI] [PubMed] [Google Scholar]
- 33.Torrie GM, Valleau JP. Nonphysical sampling distributions in Monte Carlo free-energy estimation: Umbrella sampling. Journal of Computational Physics. 1977;23(2):187–199. [Google Scholar]
- 34.Phillips JC, Braun R, Wang W, Gumbart J, Tajkhorshid E, Villa E, Chipot C, Skeel RD, Kalé L, Schulten K. Scalable molecular dynamics with NAMD. J. Comput. Chem. 2005;26(16):1781–1802. doi: 10.1002/jcc.20289. [DOI] [PMC free article] [PubMed] [Google Scholar]
- 35.Best RB, Zhu X, Shim J, Lopes PEM, Mittal J, Feig M, MacKerell AD. Optimization of the Additive CHARMM All-Atom Protein Force Field Targeting Improved Sampling of the Backbone ϕ, ψ and Side-Chain χ1 and χ2 Dihedral Angles. J. Chem. Theory Comput. 2012;8(9):3257–3273. doi: 10.1021/ct300400x. [DOI] [PMC free article] [PubMed] [Google Scholar]
- 36.Vanommeslaeghe K, Hatcher E, Acharya C, Kundu S, Zhong S, Shim J, Darian E, Guvench O, Lopes P, Vorobyov I, Mackerell AD. CHARMM general force field: A force field for drug-like molecules compatible with the CHARMM all-atom additive biological force fields. J. Comput. Chem. 2010;31(4):671–690. doi: 10.1002/jcc.21367. [DOI] [PMC free article] [PubMed] [Google Scholar]
- 37.Jorgensen WL, Chandrasekhar J, Madura JD, Impey RW, Klein ML. Comparison of simple potential functions for simulating liquid water. The Journal of Chemical Physics. 1983;79(2):926–935. [Google Scholar]
- 38.Kumar S, Rosenberg JM, Bouzida D, Swendsen RH, Kollman PA. The weighted histogram analysis method for free-energy calculations on biomolecules. I. The method. J. Comput. Chem. 1992;13(8):1011–1021. [Google Scholar]
- 39.Brooks BR, Brooks CL, Mackerell AD, Nilsson L, Petrella RJ, Roux B, Won Y, Archontis G, Bartels C, Boresch S, Caflisch A, Caves L, Cui Q, Dinner AR, Feig M, Fischer S, Gao J, Hodoscek M, Im W, Kuczera K, Lazaridis T, Ma J, Ovchinnikov V, Paci E, Pastor RW, Post CB, Pu JZ, Schaefer M, Tidor B, Venable RM, Woodcock HL, Wu X, Yang W, York DM, Karplus M. CHARMM: The biomolecular simulation program. J. Comput. Chem. 2009;30(10):1545–1614. doi: 10.1002/jcc.21287. [DOI] [PMC free article] [PubMed] [Google Scholar]
- 40.Lee MS, Feig M, Salsbury FR, Brooks CL. New analytic approximation to the standard molecular volume definition and its application to generalized Born calculations. J. Comput. Chem. 2003;24(11):1348–1356. doi: 10.1002/jcc.10272. [DOI] [PubMed] [Google Scholar]
- 41.Mirjalili V, Feig M. Density-Biased Sampling: A Robust Computational Method for Studying Pore Formation in Membranes. J. Chem. Theory Comput. 2014;11(1):343–350. doi: 10.1021/ct5009153. [DOI] [PMC free article] [PubMed] [Google Scholar]
- 42.Oostenbrink C, Villa A, Mark AE, Van Gunsteren WF. A biomolecular force field based on the free enthalpy of hydration and solvation: The GROMOS force-field parameter sets 53A5 and 53A6. J. Comput. Chem. 2004;25(13):1656–1676. doi: 10.1002/jcc.20090. [DOI] [PubMed] [Google Scholar]
- 43.Jorgensen WL, Maxwell DS, Tirado-Rives J. Development and Testing of the OPLS All-Atom Force Field on Conformational Energetics and Properties of Organic Liquids. Journal of the American Chemical Society. 1996;118(45):11225–11236. [Google Scholar]
- 44.Radzicka A, Wolfenden R. Comparing the polarities of the amino acids: side-chain distribution coefficients between the vapor phase, cyclohexane, 1-octanol, and neutral aqueous solution. Biochemistry. 1988;27(5):1664–1670. [Google Scholar]
Associated Data
This section collects any data citations, data availability statements, or supplementary materials included in this article.


