Abstract
We recently extended the classic flow–diffusion equation, which relates blood flow to tissue oxygenation, to take capillary transit time heterogeneity (CTH) into account. Realizing that cerebral oxygen availability depends on both cerebral blood flow (CBF) and capillary flow patterns, we have speculated that CTH may be actively regulated and that changes in the capillary morphology and function, as well as in blood rheology, may be involved in the pathogenesis of conditions such as dementia and ischemia-reperfusion injury. The first extended flow–diffusion equation involved simplifying assumptions which may not hold in tissue. Here, we explicitly incorporate the effects of oxygen metabolism on tissue oxygen tension and extraction efficacy, and assess the extent to which the type of capillary transit time distribution affects the overall effects of CTH on flow–metabolism coupling reported earlier. After incorporating tissue oxygen metabolism, our model predicts changes in oxygen consumption and tissue oxygen tension during functional activation in accordance with literature reports. We find that, for large CTH values, a blood flow increase fails to cause significant improvements in oxygen delivery, and can even decrease it; a condition of malignant CTH. These results are found to be largely insensitive to the choice of the transit time distribution.
Keywords: capillary transit time heterogeneity, CBF, Michaelis–Menten, microcirculation, neurovascular coupling, oxygen transport
Introduction
The brain's high resting metabolism is fuelled almost entirely by oxidative phosphorylation of glucose, and normal brain function is therefore contingent on a steady supply of oxygenated blood supply to meet the associated metabolic demands. Oxygen consumption (CMRO2) has traditionally been inferred from the cerebral blood flow. Accordingly, the equation CMRO2=CA × CBF × OEF, where CA is the arterial concentration of oxygen and OEF is the oxygen extraction fraction in tissue, states that if OEF =1, then increases in metabolic demands can be met by a proportionate increase in CBF. In normal brain, OEF is only 30%, and several studies show that in many cases, CMRO2 increases can be supported by increases in OEF, independent of CBF changes.1, 2, 3 The biophysical mechanisms that permit flow-independent changes in OEF have not yet been established. For example, cellular oxygen utilization could reduce oxygen levels in the tissue and create more efficient oxygen concentration gradients. To this day, it remains unclear whether neurovascular coupling mechanisms closely match the metabolic needs of neural activation by increases in the cerebral blood flow.2, 4
The kinetics of oxygen extraction for a given CBF is traditionally based on the work by Christian Bohr, Seymour S Kety, Christian Crone, and Eugene Renkin.5 This formalism, now referred to as the ‘flow–diffusion equation', ‘Bohr–Kety–Crone–Renkin equation' (BKCR equation), or simply ‘Crone–Renkin equation', uses well-established extraction properties of freely diffusible substances, as they pass through single capillaries, to describe the extraction to entire tissue volumes.5 The ‘tissue-version' of the formalism thereby inherits the extraction properties of single capillaries, for example, the intuitive notion that an increase in blood flow leads to better tissue oxygenation. The generalization of the single capillary formalism to tissue assumes, however, that all capillaries within a given tissue volume are identically perfused. In brain tissue, this is rarely so; for example, during rest, the flux of erythrocytes in rat brain capillaries is known to be highly heterogeneous.6, 7 Kuschinsky and Paulson proposed the hypothesis that this redistribution of the blood flow could affect OEF to support the changes in CMRO2, even without a noticeable change in CBF.8 This hypothesis is corroborated by rat studies which show redistribution of capillary flows as CBF increases during neural activation6, 9, 10 and hypoxia,11, 12 and further suggest that both CBF and blood flow patterns may influence the resulting oxygen availability and hence CMRO2.
Jespersen and Østergaard recently extended the BKCR equations in a three-parameter model13 to investigate the relation between oxygen extraction and blood flow, taking into account the transit time heterogeneity and the blood–tissue oxygen concentration gradient. The model allows estimation of OEF by assuming that the distribution h(τ) of transit times in the capillary bed is described by a gamma variate distribution. Using this distribution, capillary transit time heterogeneity (CTH) can be quantified by its standard deviation, and oxygen consumption can be characterized by its dependence on CBF and CTH. Under these model assumptions, the oxygen consumption depends to a large extent on CTH: a CTH reduction improves tissue oxygenation by counteracting the inherent reduction in OEF as CBF increases. This reduction in oxygen extraction efficacy toward high CBF is inherent to the extraction of solutes from individual capillaries: As capillary transit times become short, an increasing proportion of blood is effectively shunted through the capillary bed, and its oxygen unavailable to the tissue. The introduction of transit time heterogeneity leads to a striking prediction, namely that this loss may exceed the benefits of increasing CBF if capillary flows become sufficiently heterogeneous; a condition of malignant CTH. Under such conditions, any increase in the CBF under fixed CTH was predicted to decrease oxygenation. If this biophysical phenomenon exists, it would imply that neurovascular coupling must involve mechanisms that limit vasodilation in disease conditions where the regulation of capillary flow patterns is disturbed. The role of capillary flow patterns in neurovascular coupling has prompted the formulation of new hypotheses for understanding Alzheimer's disease14 and stroke.15 Although there is no direct evidence yet that malignant CTH states occur in the brain, we believe that disease processes, such as tissue injuries during ischemia, reperfusion injury, and the luxury perfusion syndrome, might be more fully understood by considering the effects of capillary flow patterns.15
The extended BKCR equation13 was based on several simplifying assumptions which may not be met in biological systems. The aim of this paper is to extend the original model by using more realistic physiologic descriptions wherever possible. Specifically, we realize that tissue oxygen tension is determined by the balance between net oxygen transfer from plasma to tissue and oxygen metabolism in the tissue. This is in contrast to the original model, where tissue oxygen tension was treated as an independent parameter, which was considered to be uniform and constant. In addition, we implement a number of different transit time distributions to ascertain that crucial model predictions are not related to peculiarities of the gamma distribution used in Jespersen and Østergaard.13 We then discuss the validity of the conclusions and predictions of the original model in the context of the new and more realistic model. We compare the predictions of the new model to in vivo rat data, and discuss possible clinical applications of the model.
Materials and Methods
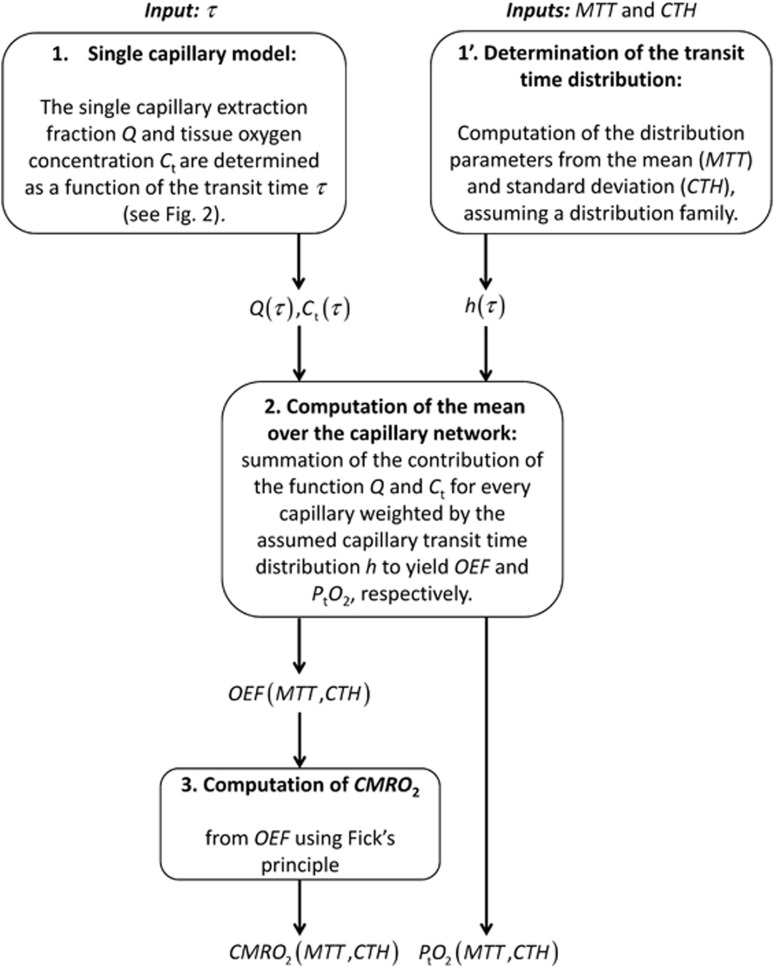
A schematic illustrating the procedure for computing CMRO2 and the mean tissue oxygen tension (PtO2), along with the variables needed for this computation is outlined in Figure 1. The individual steps are described in detail below.
Figure 1.
Schematic illustrating the procedure for computing CMRO2 and PtO2, given MTT and CTH, assuming a distribution family (e.g. gamma distribution) and a single capillary model (see Figure 2). CMRO2, oxygen consumption; CTH, capillary transit time heterogeneity; MTT, mean transit time; OEF, oxygen extraction fraction.
Oxygen Extraction Function for a Single Capillary
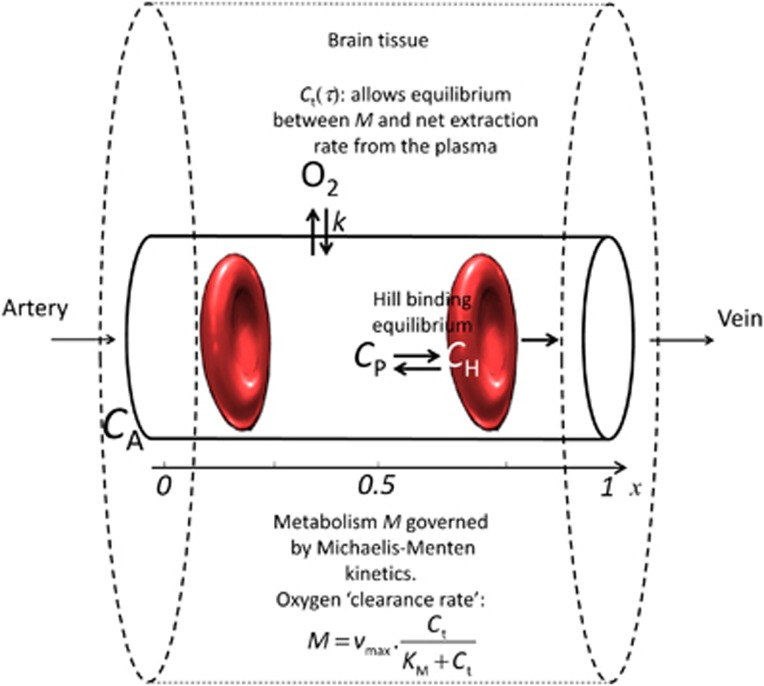
The extraction of oxygen from a single capillary is modeled as in Jespersen and Østergaard.13 Figure 2 gives an overview of this model. Briefly, oxygen is considered in three compartments; hemoglobin, plasma, and extravascular tissue. The oxygen concentration C in the blood includes oxygen cooperatively bound to hemoglobin (concentration CB) and oxygen dissolved in the blood plasma (concentration Cp). The cooperativity of oxygen binding to hemoglobin is approximated by the phenomenological Hill equation:
Figure 2.
Single capillary model overview. It consists of three compartments, oxygen bound to hemoglobin, oxygen in plasma, and oxygen in tissue. Oxygen metabolism M depends on vmax (fixed) and on tissue oxygen tension Ct around the capillary. In this model, Ct is the equilibrium oxygen tension which allows M to equal the net oxygen extraction rate across the capillary membrane, which is modeled as a first order exchange process with the rate constant k. This single capillary model allows computing, for a given transit time τ, the oxygen extraction fraction for a single capillary Q(τ) along with the equilibrium oxygen tension. CA, arterial oxygen concentration; CH, oxygen concentration bound to hemoglobin; CP, oxygen concentration in the plasma.
Figure 3.
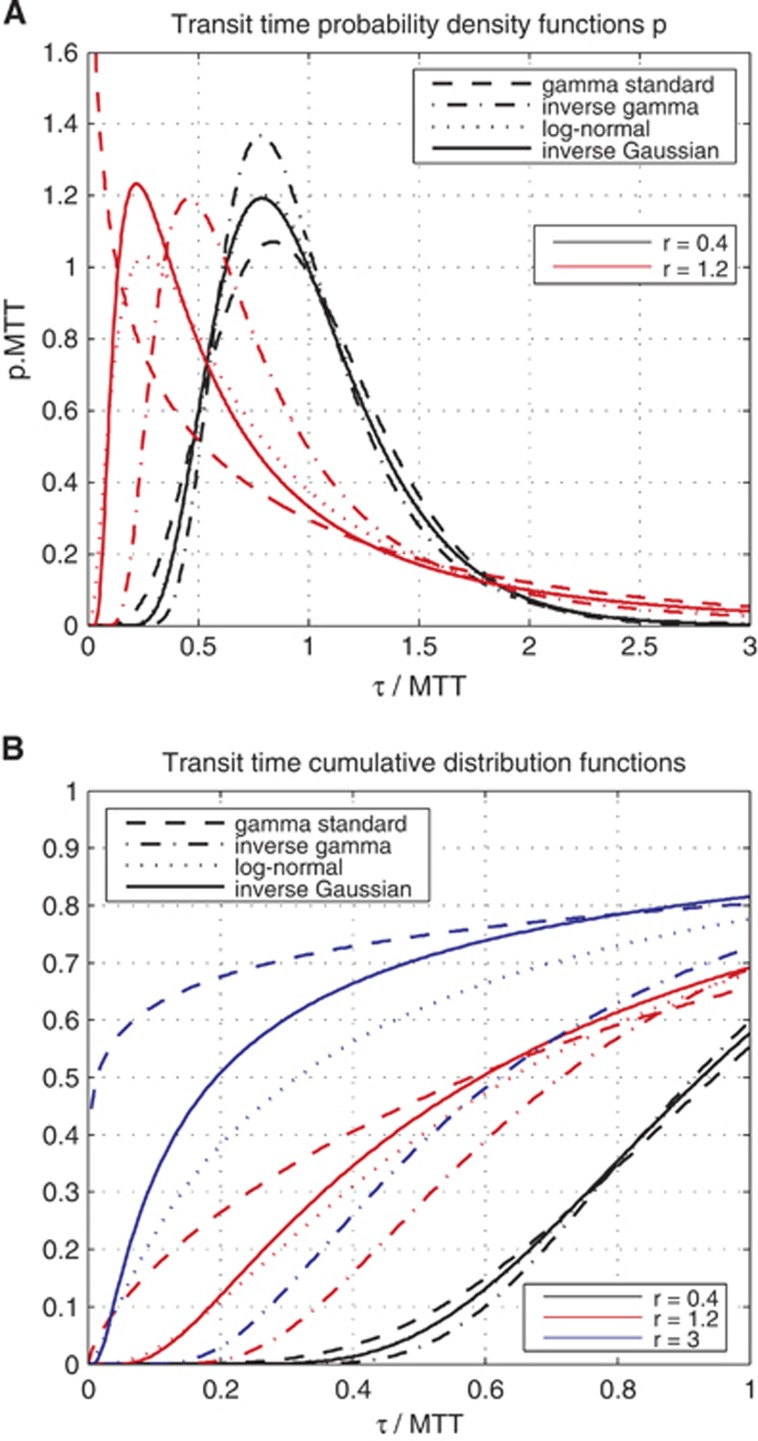
(A) Plot of the probability density function—gamma, inverse gamma, log-normal, inverse Gaussian—used throughout this paper to compute the oxygen extraction fraction (OEF) and other quantities derived from OEF. Relative dispersions r equal to 0.4 and 1.2 are considered. (B) Plot of the corresponding cumulative distribution functions, for relative dispersions r equal to 0.4, 1.2, and 3. For A and B, abscissae unit is expressed in terms of transit time normalized with respect to the mean transit time (MTT); and A's ordinate is expressed in terms of the product between the density of probability p and MTT.
 |
where CB is the concentration of bound oxygen, B is the maximum amount of oxygen that can be bound to hemoglobin, P is the oxygen partial pressure in plasma, P50 is the oxygen partial pressure at half hemoglobin saturation, and h is the Hill coefficient. The net flux of oxygen across the capillary membrane is assumed to be proportional to the difference between plasma oxygen concentration (Cp) and tissue oxygen concentration (Ct),16, 17 with an equal forward and reverse rate constant k. We assume that in the capillary, axial diffusion can be neglected compared with advective transport. Considering only steady-state situations and choosing the capillary to be oriented along the z-axis, the notation is simplified by letting C(z), Cp(z), and Ct denote blood, plasma, and tissue oxygen concentration, respectively. Following Jespersen and Østergaard,13 the system is then described by the equation
 |
where αH is Henry's constant and x∈[0;1] a normalized axial coordinate. The model constants were assigned generally accepted literature values: h=2.8, B=0.1943 mL/mL blood, CA=0.95 × B, αH=3.1 × 10⁻³ per mm Hg, P50=26 mm Hg.17 The oxygen extraction fraction for a single capillary is defined by the ratio
 |
and depends on the transit time τ.
Integration over the Capillary Network
To compute the mean value of any function over the capillary network, we will sum the contribution of the function for every capillary weighted by the assumed capillary transit time distribution h. In particular, OEF corresponds simply to the mean of the single capillary oxygen extraction fraction:
 |
For the two-parameter probability density functions (pdfs) we consider, the dependence on transit time distribution h(τ) can be summarized by the dependence on its mean (MTT) and standard deviation (CTH).
Computation of Oxygen Consumption
CMRO2 is finally derived directly from the OEF using the simple formula CMRO2=CA × CBF × OEF (Fick's principle) and the central volume theorem which relates CBF to the mean transit time and the capillary volume through the relation CBF=Vcap/MTT; assuming that the relative volume of capillaries in the brain Vcap is constant. Throughout all this paper, the capillary volume will be fixed to 1.6 mL/100 mL tissue.
Oxygen Metabolism Kinetics
We assume that the rate of oxygen metabolism M in the tissue is governed by Michaelis–Menten kinetics, i.e., M=vmax × Ct/(KM+Ct), where vmax is the maximum rate at which oxygen can be metabolized and KM is the concentration at which the metabolism equals vmax/2. Hence, balancing delivery and consumption yields:
 |
Here, CA × Q(τ) × Vcap/τ represents the flux of oxygen crossing the membrane of a capillary, with CA being the arterial oxygen concentration, Q the oxygen extraction fraction for a single capillary, and τ the transit time for the capillary.
Summarizing, we must solve the following system of coupled equations:
 |
for C and Ct for any value of the transit time τ. The computation is done numerically in two different steps, as no analytical solution exists for this system.
In the first step, we solve equation (6) independently over a grid of values (τ,Ct). Denoting the solution of this by Cf, where the superscript f stands for ‘fixed tissue oxygen tension', we compute the corresponding Qf function on the same grid (τ,Ct):
 |
This function is then appropriately interpolated to get sufficiently high resolution of Qf(τ,Ct) while minimizing the amount of numerical computation.
In the second step, we numerically solve the equation:
 |
for relevant values of τ to obtain Ct(τ) in steady-state. Having determined the specific value of Ct(τ), we use a previously interpolated Qf to determine Q(τ) for any transit time τ.
Note that in this model, we assume the diffusion distance of oxygen in the tissue to be of the same order of magnitude as the intercapillary distance. Accordingly, we assume that oxygen transfer among capillaries is negligible. As a result, oxygen tensions are not necessarily identical around the capillaries in our tissue compartment and tissue oxygen tension may be heterogeneous on the intercapillary scale. This is in accordance with observations reviewed by Ndubuizu and LaManna,18 where it is pointed out that tissue oxygen tension depends in particular on the oxygen tension at the nearest capillary wall.
Adjustment of the Model Parameters
The model parameters vmax and KM from the Michaelis–Menten kinetics as well as the bidirectional rate constant k must be calibrated. As in the original model,13 k is calibrated against measurements of MTT, CTH, and OEF from OEF(MTT = 1.4 seconds, CTH = 1.33 seconds, k) = 0.3, which corresponds to CMRO2=3.8 mL/100 mL per minute. The state (MTT=1.4 seconds, CTH=1.33 seconds) is taken as a reference for resting state, in accordance with an experiment involving functional activation in rat.10 Throughout this paper, unless differently stated, it will be referred to as resting state or rest and will be labeled in Figures 4, 5, 6 with the symbol (+0). As noted earlier, the absence of an analytical solution for the single capillary oxygen extraction fraction Q as a function of the transit time τ compels us to perform the calibration of k iteratively. OEF for MTT=1.4 seconds and CTH=1.33 seconds is computed for a given k, which is then adjusted in a direction to bring OEF closer to the desired value of 0.3. This procedure is repeated until convergence, defined by a precision of 10−4.
Figure 4.
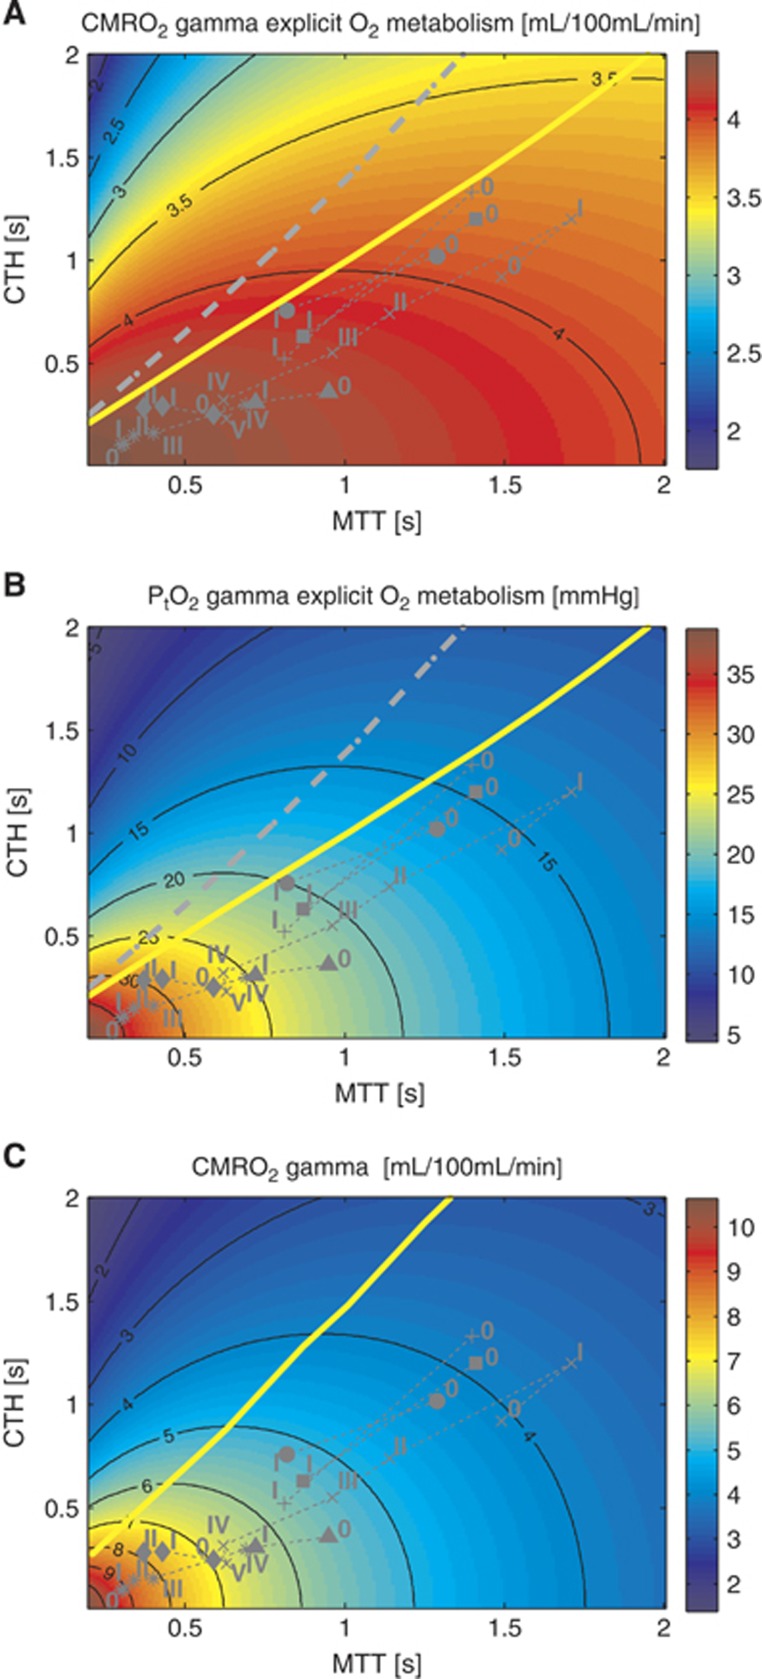
Model of the effects of transit time and capillary transit time heterogeneity (CTH) on oxygen extraction (CMRO2). Contour plot of CMRO2 (A) for a given mean transit time (MTT) and CTH. The corresponding tissue oxygen tension (B) has been computed assuming that all capillaries have the same volume. (C) Shows CMRO2 under the original model assumptions. (A) CMRO2 map, assuming oxygen metabolism to be governed by Michaelis–Menten kinetics, with parameters KM=2.71 mm Hg (3.5 μmol/L) and vmax=4.75 mL/100 mL per minute. (C) CMRO2 map obtained without explicit oxygen metabolism and with tissue oxygen tension assumed to be fixed and equal to 25 mm Hg. (MTT,CTH) values obtained in the range of physiologic conditions are also shown, and refers to conditions listed in Table 2. The capillary transit time distribution is assumed to follow a gamma variate function. The yellow line and the dotted gray line in the three different panels separate states where a flow increase given a fixed CTH will lead to an increased (right side of the line) or decreased (left side of the line) oxygen consumption (A and C) and tissue oxygen tension (B), respectively. The roman numeral accompanying each symbol identifies the corresponding physiologic data in Table 2. Symbols: x: cortical electrical stimulation;9 +: functional activation;10 *: hypotension;40 Δ: mild hypoxemia;11 ◊: severe hypercapnia;11 ●: Mild hypercapnia;7 □: Severe hypoxemia.12
Figure 5.
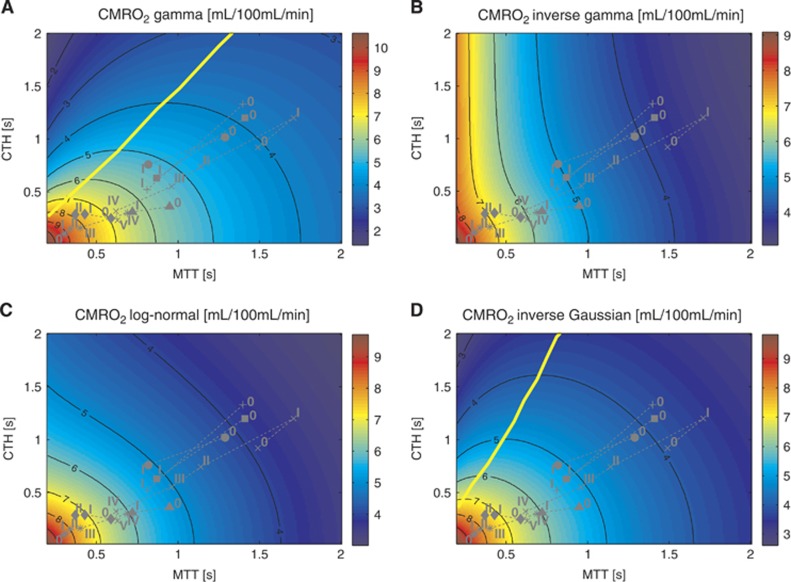
CMRO2 maps under the original model assumptions13 but with different transit time distribution. (A to D) assume a gamma, inverse gamma, log-normal, and inverse Gaussian distribution, respectively. Tissue oxygen tension is fixed at 25 mm Hg. The upper left map is similar to the one obtained in the original model. The yellow line refers to the malignant CTH state. See legend of Figure 4 for the details concerning the symbols. CMRO2, oxygen consumption; CTH, capillary transit time heterogeneity.
Figure 6.
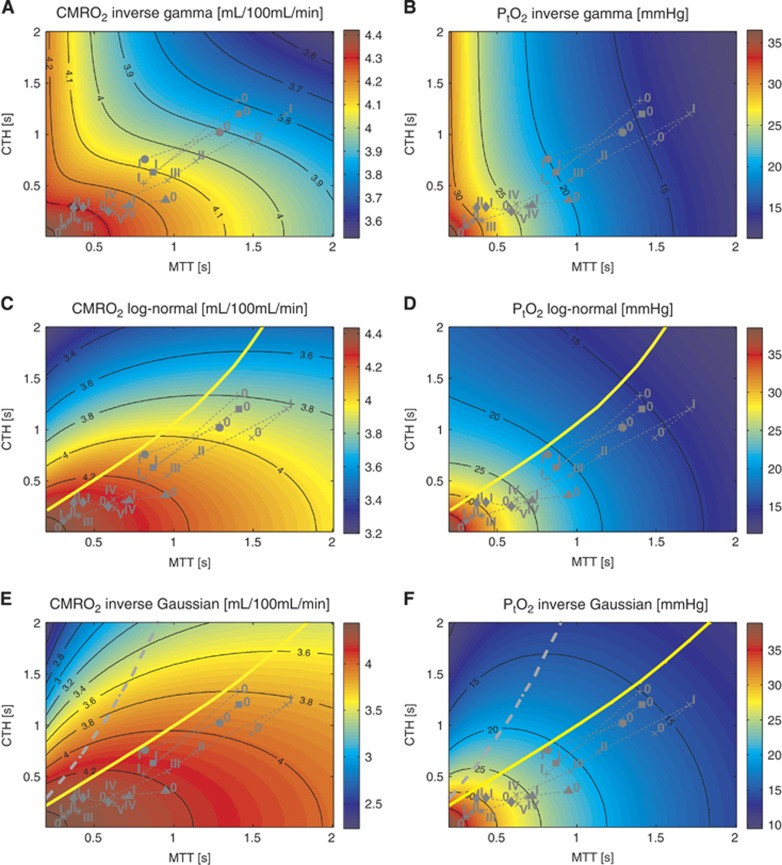
CMRO2 maps assuming oxygen metabolism to be governed by Michaelis–Menten kinetics, with parameters KM=2.71 mm Hg(3.5 μmol/L) and vmax=4.75 mL/100 mL per minute. (A, C, and E) on the left show oxygen consumption assuming an inverse gamma (A), log-normal (C), and inverse Gaussian (E) transit time distribution. (B, D, and F) on the right show the corresponding tissue oxygen tension, assuming that all capillaries have the same volume. The yellow and grey lines refer to the malignant CTH state. See legend of Figure 4 for the details concerning the symbols. CMRO2, oxygen consumption; CTH, capillary transit time heterogeneity.
In the literature on mitochondrial oxygen kinetics, reported values of KM vary considerably, and this calibration step is therefore somewhat uncertain. Several reports suggest that at rest, the rate of oxygen metabolism is approximately 80%–85% of its maximum value.19 Accordingly, we set vmax to 4.75 mL/100 mL per minute in order for the metabolic rate during rest (3.8 mL/100 mL per minute) to equal 80% of vmax. KM primarily influences the value of tissue oxygen tension: We chose KM equal to 2.71 mm Hg (3.5 μM), yielding a realistic mean tissue oxygen tension of 15 mm Hg at rest—see review by Ndubuizu and LaManna.18
Computation of the Mean Tissue Oxygen Tension
To compute the mean tissue oxygen tension PtO2, we consider the distribution h̃ derived from h according to the relation  is a fraction of capillaries, as opposed to a fraction of the flow (implicit for h). Note that h̃ can be determined under the assumption that all the capillaries have identical volumes. PtO2 is computed as:
 |
In this model, both CMRO2 and PtO2 are thus computed, and the results are presented as two separate maps for a range of MTT and CTH values.
Distributions used in the Model
In the literature, the capillary transit time is often assumed to follow a gamma variate distribution.13, 20, 21, 22 This is corroborated with experimental studies for small relative dispersion (ratio CTH:MTT) values.10 The transit time distribution for larger relative dispersion values (CTH:MTT ratio typically larger than 1) however, remains unknown, and therefore we tested four different distributions. We found four different two-parameter distributions with appropriate properties, namely the gamma distribution (as in the original model), the inverse gamma distribution, the inverse Gaussian distribution, and the log-normal distribution.
Although all these pdfs approach a normal distribution as the relative dispersion tends to zero, they behave in different ways in the regime of large relative dispersion. Table 1 lists the distributions along with selected properties, and Figure 3A plots the pdfs for relative dispersions equal to 0.4 and 1.2. Figure 3B presents the cumulative distribution function (cdf) for relative dispersion values equal to 0.4, 1.2, and 3, offering a qualitative view of the weight given to high speed flows from one distribution to the other. If we consider the case where the relative dispersion is equal to 1.2, the proportion of small transit times, e.g., smaller than 0.2 × MTT, differs considerably among the distributions. For example, more than 10% of the blood has a transit time shorter than 0.2 × MTT for all distributions except the inverse gamma, for which less than one percent of the blood has transit times below this value.
Table 1. Characteristics of the different transit time distributions considered.

Increase in Maximum Metabolic Rate during Activation and Stimulation
We also tested our model assuming that the maximum metabolic rate of oxygen vmax increased slightly during functional activation and electrical stimulation. The bidirectional rate constant k as well as the Michaelis–Menten parameters KM and vmax,0 (where ‘0' stands for the value before the increase) were calibrated as previously and therefore had the same values. The single capillary oxygen extraction fraction Q(τ), the equilibrium tissue oxygen tension Ct(τ), CMRO2, and PtO2 were then computed for physiologic states during the activation and stimulation (indicated with Schulte et al9 and Stefanovic et al10 in Table 2, respectively) assuming vmax=vmax,0·(1+F), with F being a factor proportional to the intensity of the stimulation, ranging from 0 (control state) to 0.1/0.2 for the most stimulated state (referred to as state I in Stefanovic et al10 and state V in Schulte et al9) to reflect a maximum increase in vmax equal to 10%/20%. The expected CMRO2 and PtO2 values assuming an increase in vmax during the activation and stimulation are shown in Figure 8.
Table 2. Transit time characteristics during activation, estimated from literature red blood cell velocity data.
| MTT (seconds) | CTH (seconds) | CMRO2 original model | CMRO2 new model | PtO2 new model | CBF | |
|---|---|---|---|---|---|---|
| Functional activation10 | ||||||
| Control (0) | 1.4 | 1.33 | 1.00 | 1.00 | 1.00 | 1.00 |
| Activation (I) | 0.81 | 0.52 | 1.50 (1.46) | 1.10 (7.3) | 1.55 (1.32) | 1.73 |
| Cortical electrical stimulation9 | ||||||
| Control (0) | 1.49 | 0.92 | 1.00 | 1.00 | 1.00 | 1.00 |
| 1.0 mA (I) | 1.71 | 1.20 | 0.89 (1.2) | 0.97 (3.9) | 0.88 (1.1) | 0.87 |
| 2.0 mA (II) | 1.14 | 0.74 | 1.17 (1.8) | 1.03 (11) | 1.17 (1.8) | 1.31 |
| 3.0 mA (III) | 0.96 | 0.55 | 1.31 (1.8) | 1.05 (11) | 1.33 (1.7) | 1.55 |
| 4.0 mA (IV) | 0.62 | 0.32 | 1.64 (2.2) | 1.08 (17) | 1.66 (2.1) | 2.40 |
| 5.0 mA (V) | 0.63 | 0.23 | 1.64 (2.1) | 1.09 (16) | 1.70 (2.0) | 2.36 |
| Hypotension40 | ||||||
| 115 mm Hg (0) | 0.30 | 0.10 | 1.00 | 1.00 | 1.00 | 1.00 |
| 90 mm Hg (I) | 0.31 | 0.11 | 0.99 (2.3) | 0.99 (34) | 0.99 (2.7) | 0.97 |
| 75 mm Hg (II) | 0.34 | 0.15 | 0.94 (2.0) | 0.99 (27) | 0.95 (2.3) | 0.88 |
| 50 mm Hg (III) | 0.40 | 0.16 | 0.89 (2.3) | 0.99 (32) | 0.91 (2.7) | 0.75 |
| 30 mm Hg (IV) | 0.69 | 0.30 | 0.70 (1.9) | 0.97 (20) | 0.73 (2.1) | 0.43 |
| Mild hypoxemia11 | ||||||
| Control (0) | 0.95 | 0.36 | 1.00 | 1.00 | 1.00 | 1.00 |
| 40 mm Hg (I) | 0.72 | 0.31 | 0.89 (−2.9) | 0.90 (−3,2) | 0.46 (−0.59) | 1.32 |
| Severe hypoxemia12 | ||||||
| Control (0) | 1.41 | 1.20 | 1.00 | 1.00 | 1.00 | 1.00 |
| 26 mm Hg (I) | 0.87 | 0.63 | 0.69 (−2) | 0.77 (−1.8) | 0.29 (−0.87) | 1.62 |
| Mild hypercapnia7 | ||||||
| 33 mm Hg (0) | 1.29 | 1.02 | 0.31 | 1.00 | 1.00 | 1.00 |
| 50 mm Hg (I) | 0.82 | 0.76 | 0.24 (2.5) | 1.04 (15) | 1.24 (2.4) | 1.57 |
| Severe hypercapnia11 | ||||||
| 35 mm Hg (0) | 0.59 | 0.25 | 1.00 | 1.00 | 1.00 | 1.00 |
| 67 mm Hg (I) | 0.43 | 0.29 | 1.09 (4.2) | 1.00 (88) | 1.07 (5.2) | 1.37 |
| 97 mm Hg (II) | 0.37 | 0.29 | 1.13 (4.6) | 1.01 (93) | 1.10 (5.7) | 1.59 |
Oxygen consumption (CMRO2) and tissue oxygen tension (PtO2) predicted by the original and the new model (relative to control) are indicated. Cerebral blood flow (CBF) (relative to baseline) is given assuming a fixed capillary volume and derived from the central volume theorem. Transit time distribution is assumed to be described by a gamma variate function. As it is discussed in the main text, neurovascular coupling indices are reported in parenthesis, and correspond to the ratio of the increase in CBF over the increase in CMRO2. For PtO2, the number in parenthesis corresponds to the increase in CBF over the increase in PtO2, and can be seen as a coupling index analogy for PtO2. Physiologic conditions were assigned symbols and roman numerals to allow identification in Figures 4, 5, 6.
In the following, we will refer to functional activation or electrical stimulation simply as ‘activation'.
Original Model Assumptions
Note that the original model in Jespersen and Østergaard13 is recovered by assuming a gamma distribution and a fixed tissue oxygen tension of Ct(τ) = αH × 25 mm Hg.
Results
Explicit Incorporation of Oxygen Metabolism
We first present the results of including explicit oxygen metabolism by means of Michaelis–Menten kinetics. Figure 4 compares contour plots of CMRO2 maps obtained with the new model to those obtained with the original model (Figure 4A and 4C). Figure 4B shows the resulting PtO2 for the new model and Table 2 gives corresponding quantitative information, including a comparison between CMRO2 for different physiologic states for the two models. Note that PtO2 map is not presented under the original assumptions, as PtO2 was assumed to be fixed and equal to 25 mm Hg. In Figure 4 and Table 2, the numeral ‘0' stands for control or resting state, whereas other numerals refer to states of altered basal physiology. One of the most striking observations in the new model is the much smaller variations in CMRO2 as function of MTT and CTH compared with the original model. In the new model, considering data from Stefanovic et al10 (symbol (+) in Figure 4), a 73% increase in CBF is associated with a 10.2% CMRO2 increase, corresponding to a coupling index (defined in Buxton23 as the ratio between the relative increase in flow and CMRO2 during an activation) of approximately 7. In comparison, the same increase in CBF with the original model generated a CMRO2 increase equal to 50% which corresponds to a coupling index of 1.5. For stimulations leading to a larger flow increase9 (symbol (x) in Figure 4), a plateau phenomenon occurs in which CMRO2 increases little despite a large flow increase. We see from Figure 7 and Table 2 that almost two-thirds of the net CMRO2 increase during hyperemia results from the first two-fifths of the CBF increase. This comes from the assumption that the oxygen metabolism is governed by Michaelis–Menten kinetics, and that metabolism at rest is at 80% of the maximum; this de facto limits any oxygen utilization increase to 25%. With the new model, PtO2 (Figure 4B) is expected to increase to a larger extent than CMRO2 during an increase in CBF. Table 2 depicts the change in PtO2 for different physiologic states and permits the comparison of this value with the increase in CBF (number in parenthesis in the corresponding column). The ratio 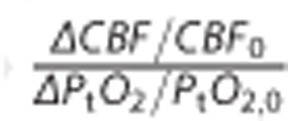 is generally found to be less than 2.
The malignant CTH effect predicted in the original model (Figure 4C) is observed in the new model. Accordingly, for states on the left hand side of the yellow line in Figure 4A, CMRO2 decreases if flow increases under conditions of constant CTH. Figure 4B shows a bell-shaped iso-contour for PtO2 as well, which shows a similar phenomenon, only for PtO2. Note however, that these phenomena do not occur exactly at the same location in the MTT, CTH plane. Accordingly, the observation of increasing blood flow being accompanied by decreasing tissue oxygen tension is not completely faithful as a proxy of malignant CTH, nor as a biologic feedback signal to attenuate upstream vasodilation.
Effects of the Choice of Transit Time Distribution (without Explicit Incorporation of Metabolism)
With the assumptions of the original model, i.e., a constant tissue oxygen tension equal to 25 mm Hg, we investigated the influence of different transit time distributions. Figure 5 presents results obtained with the four distributions. The malignant CTH effect is observed when assuming inverse Gaussian distributions. However, log-normal and inverse gamma distributions do not result in a malignant CTH state. Considering the log-normal distribution, CMRO2 iso-contour slopes decrease as the transit time increases; they are, in this sense, ‘close' to showing a malignant CTH pattern in that even large flow increases fail to cause significant improvements in oxygen tension or oxygen consumption. Of note, compared with the gamma and inverse Gaussian distributions, the log-normal and inverse gamma distributions have a lower proportion of short transit times (see Materials and Methods) as the relative dispersion increases. This may in part explain the absence of malignant CTH state for these two distributions.
Influence of the Choice of Transit Time Distribution (with Tissue Metabolism Explicitly Incorporated)
Figure 6 shows CMRO2 and PtO2 maps for the inverse Gaussian, log-normal, and inverse gamma distributions when considering tissue oxygen consumption which affects the oxygen concentration gradient between plasma and tissue. The sub-linear Michaelis–Menten kinetics, with near-saturation of oxygen utilization (80%) during rest (see the Materials and Methods section, ‘adjustment of the model parameters'), predicts that moderately larger oxygen utilization rates correspond to much larger tissue oxygen tensions. The higher tissue oxygen tension in turn decreases the blood–tissue concentration gradient, rendering flow increases even less efficient in terms of supporting increased oxygen metabolism. As a result, OEF decreases more quickly as the relative dispersion increases, enhancing the malignant CTH phenomenon. This is evident from the CMRO2 maps of Figure 4, where the malignant CTH is even observed for the log-normal distribution. The effect on the oxygen extraction efficiency induced by the incorporation of the metabolism is not strong enough to cause the malignant CTH effect for the inverse gamma distribution, but the CMRO2 iso-contour slopes become lower. Accordingly, also for this distribution, blood flow increases are expected to be less efficient as a means of increasing oxygen consumption for a given CTH value.
Predicted Oxygenation Changes based on Experimental Data from the Literature
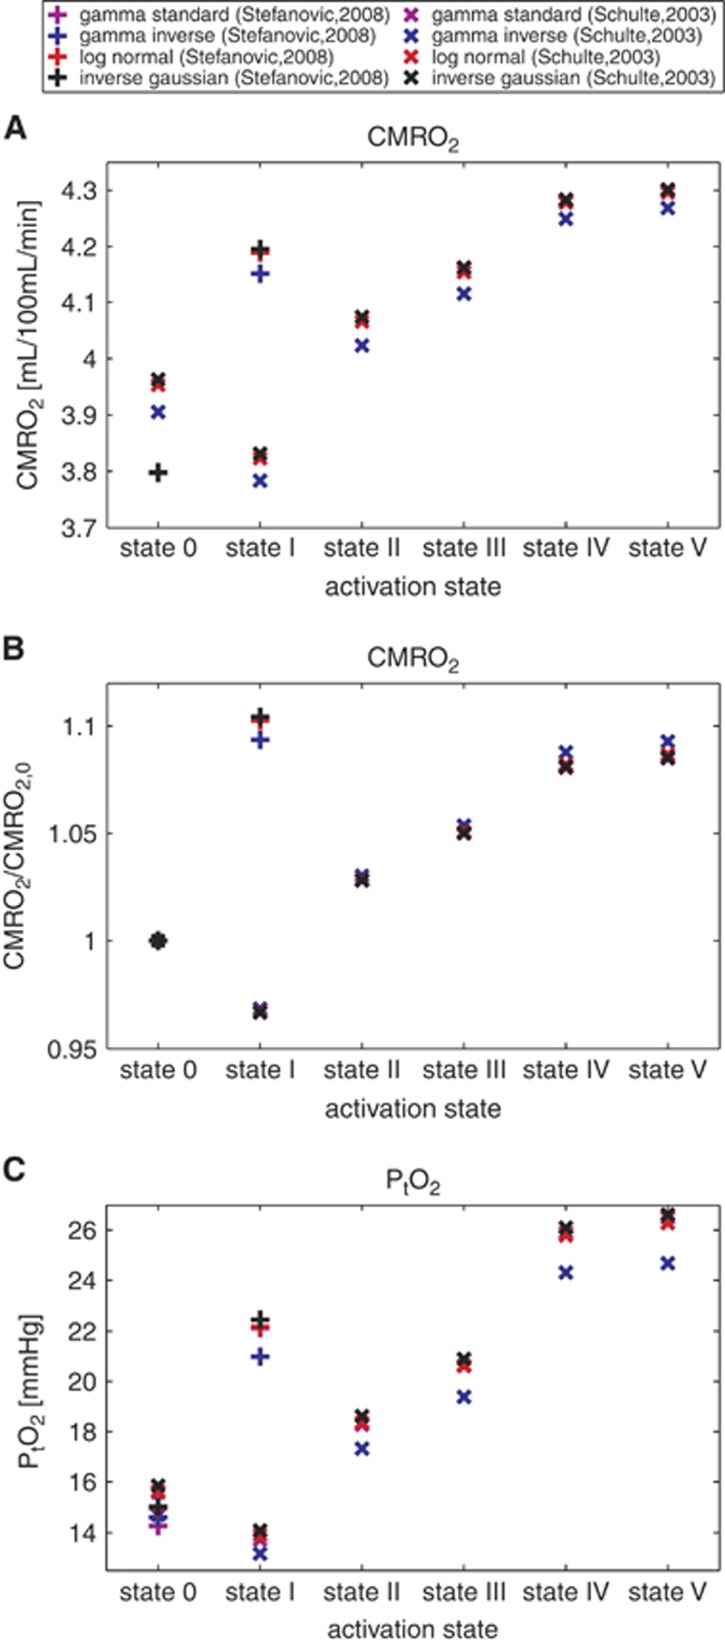
We used data from Schulte et al9 and Stefanovic et al10 and compared the expected CMRO2 and PtO2 values and their dependence on the transit time distribution. The different (MTT,CTH) states considered appear as symbols on the CMRO2 and PtO2 maps of Figures 6 and 7 and present CMRO2 values, non-normalized (Figure 7A), and normalized with respect to the baseline value (Figure 7B), along with PtO2 values (Figure 7C) in these states. The expected CMRO2 and oxygen tension values are very similar across the different distributions, with the inverse gamma distribution differing somewhat from the others in terms of its predictions. Considering the data from Stefanovic et al10 (symbol (+) on the figure), the CMRO2 increases from rest to activation are between 10.26% to 10.45% when assuming the gamma, log-normal, and inverse Gaussian distributions, but only 9.36% for the inverse gamma distribution. Concerning the oxygen tension in tissue, similar observations apply. If we consider (MTT,CTH) states throughout the two studies, the difference between the expected oxygen tension across the different distributions is never larger than 1 mm Hg, except for the inverse gamma distribution, where it is 2 mm Hg.
Figure 7.
CMRO2 in different physiological conditions listed in Table 2, using several transit time distributions and assuming oxygen metabolism to be governed by Michaelis–Menten kinetics, with parameters KM = 2.71 mm Hg (3.5 μmol/L) and vmax=4.75 mL/100 mL per minute. (A) CMRO2 depending on the physiological conditions. (B) Shows the same data with normalized values with respect to the CMRO2 baseline value (state 0). This allows to compare the activation amplitudes assuming one or the other distribution. (C) Shows tissue oxygen tension for the same physiological conditions. Roman numerals on the abscissa refer to the physiologic conditions in Table 2. Symbols: (+) refers to the data from Stefanovic et al;10 (x) refers to the data from Schulte et al.9
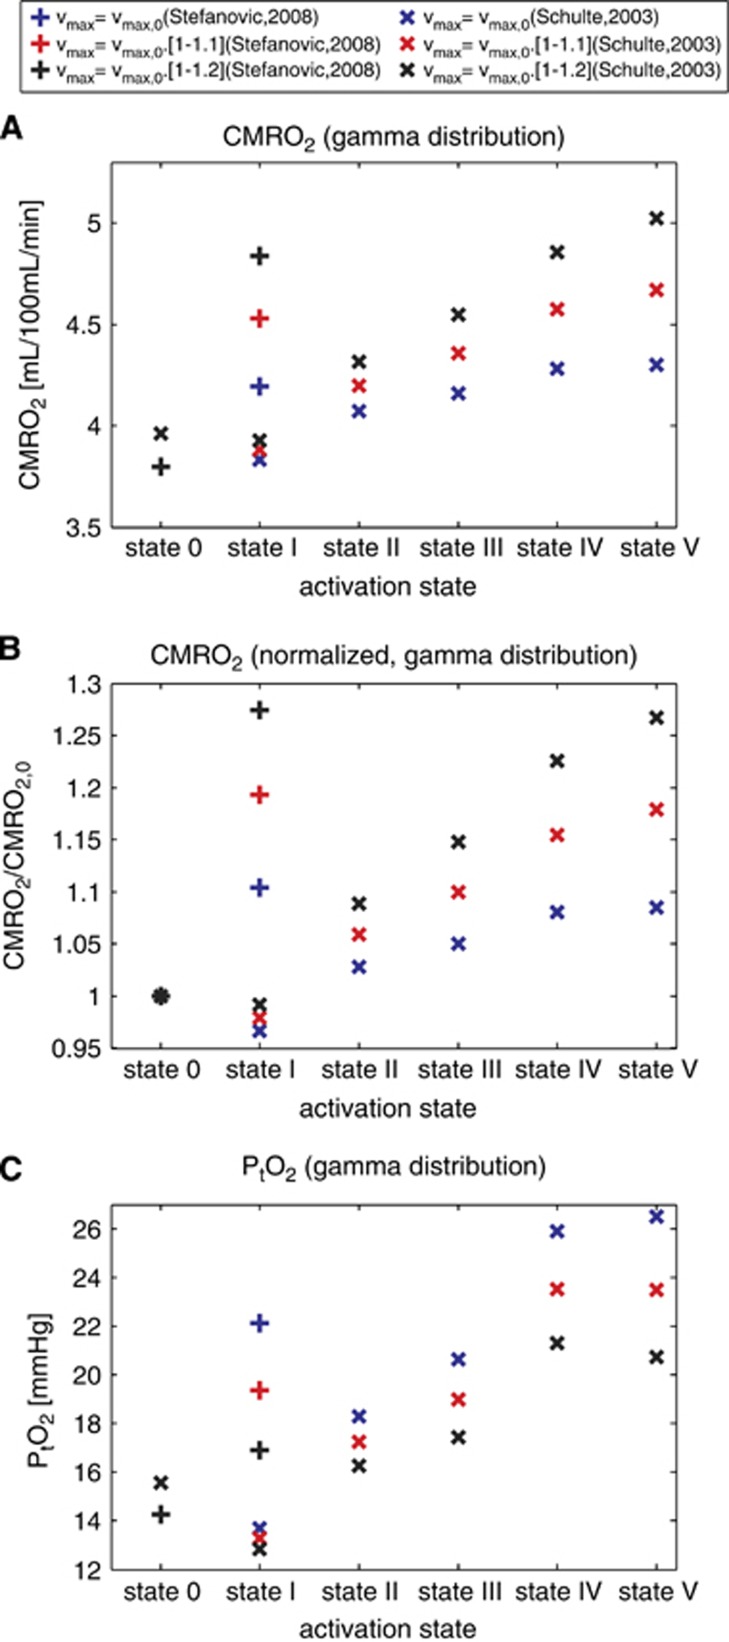
We then computed the expected CMRO2 and PtO2 for these same physiologic states, assuming that the maximum metabolic rate of oxygen vmax increased during functional activation or electrical stimulation (collectively referred to as activation). Figure 8 shows CMRO2 values, non-normalized (Figure 8A), and normalized with respect to the baseline value (Figure 8B), along with changes in PtO2 (Figure 8C), considering vmax to be constant, to increase by 10%, and by 20% throughout activation. Compared with constant vmax, an increase in vmax during activation leads to a higher metabolism of oxygen in the tissue compartment and a decreased tissue oxygen tension. The oxygen gradient thus becomes higher and CMRO2 increases. Assuming a vmax increase of 10% throughout activation leads to an increase in CMRO2 83% and 110% larger, and an increase in PtO2 29% and 35% smaller than when vmax is kept constant, considering data from Schulte et al9 and Stefanovic et al,10 respectively.
Figure 8.
CMRO2 in different physiologic conditions listed in Table 2, assuming a gamma transit time distribution and oxygen metabolism to be governed by Michaelis–Menten kinetics, with parameters at baseline states KM = 2.71 mm Hg (3.5 μmol/L) and vmax=4.75 mL/100 mL per minute. vmax is assumed to be constant (black), to be increased progressively of 10% (red) and 20% (blue) from baseline condition to state I (+) or state V (x). (A) CMRO2 depending on the physiologic conditions. (B) Shows the same data with normalized values with respect to the CMRO2 baseline value (state 0). (C) Shows PtO2 using the same data as previously. Roman numerals on the abscissa refer to the condition detailed in Table 2. Symbols : (+) refers to the data from Stefanovic et al,10 and (x) refers to the data from Schulte et al.9
In summary, the predicted CMRO2 and PtO2 changes on the basis of realistic (MTT, CTH) values do not depend very much on the particular distribution used, but a slight increase in vmax during activation leads to a substantially higher CMRO2 and lower PtO2 increase.
Discussion
In this study, we refined the extended BKCR model13 to include oxygen metabolism using Michaelis–Menten kinetics, and tested its robustness to the underlying capillary transit time distribution. The first main finding of our study is that the explicit incorporation of tissue metabolism by a Michaelis–Menten term tends to increase tissue oxygen tension and reduce the CMRO2 increase that can be supported for a given CBF compared with the original model in which PtO2 was assumed to be constant. The second main finding is that the relation between MTT, CTH, and CMRO2 is robust across transit time distributions, and hence the malignant CTH phenomenon appears to be an inherent property of the heterogeneity of capillary transit times for some combinations of MTT, CTH, for which a higher CBF leads to a decreased oxygen consumption.
It is generally accepted that relative CBF responses are larger than the relative increases in oxygen metabolism they support. Reported ratios—known as the neurovascular coupling index—range between 2 and 10,24 and some have even observed activations without increases in CMRO2.25 The physiologic underpinnings of this wide range are poorly understood, but may imply that CBF responses are driven by factors other than oxygen demand.26 Buxton23 reviewed a range of studies and reported coupling indices in the range from 1.5 to 5 with a clear tendency for fMRI studies to find lower values than PET, suggesting that methodological issues are also involved.23 Our model predicted neurovascular coupling index ranging from approximately 7 to 15, compared with 1.5 to 2.2 in the original model. We believe the high ratios predicted by the new model relate to the Michaelis–Menten approximation in describing the kinetics of oxygen metabolism. In particular, the high degree of saturation in oxygen consumption already in the resting state (CMRO2=0.8 × vmax at rest) combined with the fixed value for the parameters vmax and KM inherently limits how much the rate of oxygen metabolism can increase. We examined how CMRO2 and PtO2 changes depend on vmax: a 10% increase in vmax during activation would be enough to yield an increase in CMRO2 twice as large (i.e., coupling index only half as large), compared with the case where vmax is considered to be constant. We discuss the appropriateness of Michaelis–Menten kinetics further below.
Our model predicts PtO2 on the basis of tissue metabolism and oxygen supply as determined by local hemodynamics. Similar to the CMRO2 iso-contours, the PtO2 iso-contours are bell shaped, and their slopes become zero at places when using the gamma and inverse Gaussian distribution to model capillary transit times. CBF increases can therefore, in theory, be accompanied by a decrease in PtO2 for some combinations of CBF and CTH. Note that the shape of PtO2 iso-contours differs from those of CMRO2: Therefore, our model predicts that CMRO2 may increase although PtO2 decreases, and vice versa. We note from Figure 7 that for realistic (MTT,CTH) states, PtO2 changes can be used as a proxy for parallel changes in CMRO2 as they vary in the same manner. Moreover, Figures 4 and 6 show that while the contrary is not always true, a decrease in tissue oxygen tension when CBF is increased always corresponds to a malignant CTH state. Dynamic recordings of PtO2, cerebral perfusion pressure, and carotid flow velocities are routinely monitored after traumatic brain injury, and interventions that reduce PtO2 are typically discouraged on grounds that findings of low PtO2 in these patients carries a poor prognosis.27 Our model predicts that reductions in PtO2 may, in fact, improve oxygen extraction and thus CMRO2 by increasing blood–tissue concentration gradients in cases where CTH is disturbed by edema and elevated intracranial pressure, and we speculate that our model may prove useful in future interpretation of dynamic autoregulation data as part of neurointensive care—see Østergaard et al27 for further discussions.
During activation, the ratio 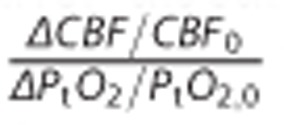 which reflects the relation between changes in CBF and tissue oxygen tension, was predicted by our model to be less than 2 (see Table 2). It is inherently difficult to measure oxygen tension in tissues, and a large range of values have been reported in the literature—see review by Ndubuizu and LaManna.18 Furthermore, increases in PtO2 during functional activation seemingly depend on the nature of the stimulation.28 Nevertheless, our model predictions are consistent with data recorded during stimulation of transcallosal28 and parallel29 fibres, and during forepaw stimulation30 in rat brain, where the aforementioned ratios were less than 2. Other studies have reported smaller PtO2 changes during activation or stimulation, however—see review by Buxton.23 Again, the choice of Michaelis–Menten kinetics to describe tissue metabolism lead us to predict relatively large increases in PtO2 for a given increase in CBF. Increasing vmax by 10% would thus decrease the ratio above by one-third, and a 20% increase in vmax even more. See discussions below.
Robustness of the Model to the Choice of Transit Time Distribution
We implemented and tested several transit time distributions to assess the robustness of our model and to investigate the extent to which its predictions depend on the assumed, analytical distributions. For states related to activation, no CMRO2/PtO2 differences larger than 2%/4% were observed when using the gamma, log-normal, or inverse Gaussian distributions to distribute capillary flow patterns. The differences between control state and activation were larger when using the inverse gamma distribution. By definition, the inverse gamma distribution corresponds to the distribution of the reciprocal of a variable distributed according to the gamma distribution. In this context, this means that if the transit time is assumed to follow an inverse gamma distribution, then flow velocity (note that, with constant capillary volume, blood flow velocity is inversely proportional to its transit time) is implicitly assumed to follow a gamma distribution. This seems to be in contradiction with literature that assumes,20, 21, 22 reports10 or explain theoretically31 that the transit time (but not the speed) follows a gamma variate function. At least in the case of low relative dispersion values (typically smaller than 1), many experimental studies report a good fit for the transit time histogram to a gamma distribution. Among the three other different distributions tested, the log-normal and inverse Gaussian distributions are more similar to the gamma distribution than the inverse gamma distribution. Further experimental studies are necessary to determine the appropriate capillary flow distribution(s) in states of large relative dispersion.
The Malignant CTH Condition
Perhaps the most surprising property of the original extended flow–diffusion model is its prediction that CTH can become so high that increases in CBF no longer improves tissue oxygenation—or even reduces it. Although this property is inherent to the nonlinear flow–diffusion relation for individual capillaries (Figure 2 in Jespersen and Østergaard13), the phenomenon might not occur for realistic transit time distributions. We tested several distributions here with the purpose of ruling out that the malignant CTH effect presented in the original model was not related to the τ →0 divergence of the gamma variate function when the relative dispersion is larger than one, but more to the rate at which the OEF decreases as the relative dispersion increases. None of the three distributions we used here displays such divergence, and it should be kept in mind that the distributions describe the fraction of the flow, rather than the fraction of capillaries, with a given transit time. In other words, the probability density function h that we use describes the probability for a blood particle in the network—not for the particles in a capillary—to have a given transit time. Therefore, the contribution (to the total flow) of each capillary with transit time between τ and τ + dτ is weighted by its flow and there is hence no physical requirement for the distribution h to converge toward zero as the transit time tends to zero.
Malignant CTH is predicted to occur if CTH is elevated, and remains constant during an increase in CBF.13 On the basis of a vascular model inspired from the work of Boas and colleagues,32 we have observed that a blood flow increase through a passive microvascular network with realistic capillary compliances leads to a CTH reduction, so that the relative dispersion, CTH:MTT, remain almost constant. In fact, this ratio remains constant for any network topology when capillary compliance is neglected (Results not shown). Because of these properties, network topology and/or resistance must be severely disturbed for CTH to remain constant while flow increases, and hence to cause malignant CTH. In normal brain, the relative dispersion is close to constant during various stimuli, as shown by the in vivo data listed in Table 2. In Figure 4, we notice that a straight line passing through the origin corresponds to constant relative dispersion. Given that CTH and MTT appear to co-vary in this manner, we propose that relative dispersion, CTH:MTT, rather than CTH, should be used when comparing two different capillary networks. This quantity is predicted to be more sensitive to their topological differences than CTH, which depends on the mean tissue flow.
Michaelis–Menten Parameter Values
The neurovascular coupling indices predicted by our model agreed better with experimental data if we assumed vmax to increase during enhanced oxidative metabolism. Such an increase may at first appear counterintuitive by implying that the maximum capacity of tissue to metabolize oxygen increases ‘on demand' during functional activation.
In humans, mitochondrial respiratory capacity is generally thought to exceed the maximum metabolic rate of tissue.33 Although this property has mainly been studied in muscle,33 we speculate that it applies to brain as well. Jones34 pointed out that mitochondria in cerebral tissues are organized in clusters, giving rise to micro-heterogeneity in the magnitude and location of oxygen concentration gradients at the cellular scale. Accordingly, mitochondria experience different oxygen tensions, contrary to the implicit assumptions of the Michaelis–Menten kinetics applied here. We speculate that both this micro-heterogeneity, and the heterogeneity of oxygen tensions across the capillary bed caused by their heterogeneous flow distribution, would give rise to an apparent increase in vmax during activation: Although some mitochondria might reach saturation during episodes of enhanced oxidative metabolism, others are likely to be exposed to higher oxygen concentrations than during rest and contribute more toward net tissue metabolism, giving rise to an apparent recruitment of additional mitochondria.
Reported values for the Michaelis–Menten constant KM range from 0.5 μmol/L to 1 μmol/L (0.4 mm Hg to 0.8 mm Hg) in most studies, but sometimes vary even more from one study to another. The reported values are generally KM values in the mitochondrial compartment, often observed in vitro in closed systems, and often taken from muscle or liver cells. The value of KM is directly related to the substrate's affinity for an enzyme and therefore affects both substrate concentration and the rate of metabolism. Oxygen tension close to mitochondria is likely to be significantly lower than closer to the capillary. On the basis of PET measurement of CBF and CMRO2, Gjedde et al35 predicted a fourfold difference between tissue oxygen tension close to the capillary and in the mitochondria, respectively. By a similar approach, Bailey et al36 obtained a smaller gradient, and Leithner and Royl24 have suggested that great variability between cerebral tissue types could account for the difference in metabolic rate and oxygen capillary density.34 In our model, we consider a single membrane/interface (from the plasma to the tissue), where oxygen is well stirred. As a result, there is no oxygen gradient from the blood–brain barrier to mitochondria, and the oxygen concentration at the site of conversion is artificially large. The apparent KM value should thus be proportionately increased to compensate for this effect. For these reasons, we chose an apparent KM value equal to 2.71 mm Hg, which is approximately fourfold higher than values classically reported: with this KM value, tissue oxygen tension at rest does not limit oxidative metabolism (as it has been calibrated to be 80% of its maximum value at rest), but states of lower oxygen tension could limit it.
Diffusion Distance
We assumed negligible oxygen transfer among capillaries. The validity of this assumption depends on the oxygen diffusion distance in the tissue, and is valid only if this distance is sufficiently small so that oxygen diffusion is limited to the tissue immediately surrounding it. No direct measurement has been made to determine this diffusion distance, but on the basis of CMRO2 and PtO2, the diffusion distance for oxygen is estimated to be approximately 50 μm, close to the generally accepted intercapillary distance in brain tissue. It is therefore likely that tissue oxygen tension at a given location is influenced primarily by the rate of incoming oxygen from the nearest capillary, and to a certain extent, from the second nearest capillary; and that the rate of oxygen coming from further capillaries is likely to have a negligible contribution. The incorporation of contributions from capillaries further away into our model would require the introduction of a new parameter, as well as additional assumptions to describe how capillaries with different transit times are distributed in space. For example, oxygenation would be highly dependent on whether capillaries with similar transit times are more likely to be nearby or not. This parameter would be hard to adjust, as we do not have access to the experimental data to inform such models yet.
Future Work
In the current extended BKCR model, net oxygen transport across the capillary membrane is assumed to be proportional to the oxygen gradient, but differences in oxygen solubility in the plasma and in tissue was neglected. Moreover, we assumed a linear relation between tissue oxygen tension and the quantity of oxygen in tissue. In future work, we would like to include nonlinear binding to neuroglobin37 in the parenchyma, as well as additional physiologic effects that are known to affect oxygen binding to hemoglobin, such as pH and CO2 level (the Bohr effect).
The investigation of capillary blood flow and its physiologic regulation is an active area of research. Recently, effort has been made to measure in vivo red blood cells transit time characteristics, and some techniques allow to get these measurements over a large number of capillaries located at different depths at the same time.38 We hope to apply our model to such measurements, or to transit time characteristics obtained by perfusion techniques,39 as we feel it would provide a new insight into the significance of microcirculation in health and disease.
We tested our model assuming that the local maximum metabolic rate of oxygen vmax increased during enhanced oxidative metabolism. For future work, one might test an alternative scenario in which vmax would be kept constant but redistributed at the microscopic level, either according to capillary transit times or independently, rather than being identical for all capillaries as assumed here. This approach could account specifically for the apparent mitochondria recruitment that we discussed above.
Conclusion
In this model, we chose to follow an approach similar to that used by Jespersen and Østergaard,13 based on observable properties of red blood cells transit time characteristics. We presented a new model by adding a single extra parameter, allowing to incorporate explicitly oxygen metabolism and hence using a more realistic description of oxygen extraction. We showed in particular that, when CBF increases, increases in CMRO2 are found to be smaller in the new model than in the original model. This results in neurovascular coupling in better agreement with experimental data, especially when the maximum metabolic rate of oxygen vmax slightly increases. Although malignant CTH state does not occur with the inverse gamma distribution, we showed that for the other distributions we used, the expected tissue oxygen tension and oxygen consumption are largely insensitive to the particular choice of distribution, especially when considering physiologic values. Furthermore, we emphasized the importance of capillary blood flow heterogeneity when considering oxygen delivery, and showed that, under the new model assumptions, a blood flow increase fails to cause significant improvements in tissue oxygen tension or oxygen consumption for large CTH values, supporting the conclusions of the original model.
Acknowledgments
The authors wish to thank Peter Mondrup Rasmussen for fruitful discussions, and Richard Buxton for helpful discussions and suggestions during the preparation of the manuscript.
The authors declare no conflict of interest.
Footnotes
This study was supported by the Danish National Research Foundation (CFIN), the Danish Ministry of Science, Innovation, and Education (MINDLab), and the VELUX Foundation (ARCADIA).
References
- Derdeyn CP, Videen TO, Yundt KD, Fritsch SM, Carpenter DA, Grubb RL, et al. Variability of cerebral blood volume and oxygen extraction: stages of cerebral haemodynamic impairment revisited. Brain J Neurol. 2002;125 (Pt 3:595–607. doi: 10.1093/brain/awf047. [DOI] [PubMed] [Google Scholar]
- Donahue MJ, Stevens RD, de Boorder M, Pekar JJ, Hendrikse J, van Zijl PCM. Hemodynamic changes after visual stimulation and breath holding provide evidence for an uncoupling of cerebral blood flow and volume from oxygen metabolism. J Cereb Blood Flow Metab. 2009;29:176–185. doi: 10.1038/jcbfm.2008.109. [DOI] [PMC free article] [PubMed] [Google Scholar]
- Leithner C, Royl G, Offenhauser N, Fuchtemeier M, Kohl-Bareis M, Villringer A, et al. Pharmacological uncoupling of activation induced increases in CBF and CMRO2. J Cereb Blood Flow Metab. 2010;30:311–322. doi: 10.1038/jcbfm.2009.211. [DOI] [PMC free article] [PubMed] [Google Scholar]
- Hoge RD, Atkinson J, Gill B, Crelier GR, Marrett S, Pike GB. Linear coupling between cerebral blood flow and oxygen consumption in activated human cortex. Proc Natl Acad Sci USA. 1999;96:9403–9408. doi: 10.1073/pnas.96.16.9403. [DOI] [PMC free article] [PubMed] [Google Scholar]
- Renkin EM. B. W. Zweifach Award lecture. Regulation of the microcirculation. Microvasc Res. 1985;30:251–263. doi: 10.1016/0026-2862(85)90057-3. [DOI] [PubMed] [Google Scholar]
- Kleinfeld D, Mitra PP, Helmchen F, Denk W. Fluctuations and stimulus-induced changes in blood flow observed in individual capillaries in layers 2 through 4 of rat neocortex. Proc Natl Acad Sci USA. 1998;95:15741–15746. doi: 10.1073/pnas.95.26.15741. [DOI] [PMC free article] [PubMed] [Google Scholar]
- Villringer A, Them A, Lindauer U, Einhäupl K, Dirnagl U. Capillary perfusion of the rat brain cortex. An in vivo confocal microscopy study. Circ Res. 1994;75:55–62. doi: 10.1161/01.res.75.1.55. [DOI] [PubMed] [Google Scholar]
- Kuschinsky W, Paulson OB. Capillary circulation in the brain. Cerebrovasc Brain Metab Rev. 1992;4:261–286. [PubMed] [Google Scholar]
- Schulte ML, Wood JD, Hudetz AG. Cortical electrical stimulation alters erythrocyte perfusion pattern in the cerebral capillary network of the rat. Brain Res. 2003;963:81–92. doi: 10.1016/s0006-8993(02)03848-9. [DOI] [PubMed] [Google Scholar]
- Stefanovic B, Hutchinson E, Yakovleva V, Schram V, Russell JT, Belluscio L, et al. Functional reactivity of cerebral capillaries. J Cereb Blood Flow Metab. 2008;28:961–972. doi: 10.1038/sj.jcbfm.9600590. [DOI] [PMC free article] [PubMed] [Google Scholar]
- Hudetz AG, Biswal BB, Fehér G, Kampine JP. Effects of hypoxia and hypercapnia on capillary flow velocity in the rat cerebral cortex. Microvasc Res. 1997;54:35–42. doi: 10.1006/mvre.1997.2023. [DOI] [PubMed] [Google Scholar]
- Krolo I, Hudetz AG. Hypoxemia alters erythrocyte perfusion pattern in the cerebral capillary network. Microvasc Res. 2000;59:72–79. doi: 10.1006/mvre.1999.2185. [DOI] [PubMed] [Google Scholar]
- Jespersen SN, Østergaard L. The roles of cerebral blood flow, capillary transit time heterogeneity, and oxygen tension in brain oxygenation and metabolism. J Cereb Blood Flow Metab. 2012;32:264–277. doi: 10.1038/jcbfm.2011.153. [DOI] [PMC free article] [PubMed] [Google Scholar]
- Østergaard L, Aamand R, Gutiérrez-Jiménez E, Ho Y-CL, Blicher JU, Madsen SM, et al. The capillary dysfunction hypothesis of Alzheimer's disease. Neurobiol Aging. 2013;34:1018–1031. doi: 10.1016/j.neurobiolaging.2012.09.011. [DOI] [PubMed] [Google Scholar]
- Østergaard L, Jespersen SN, Mouridsen K, Mikkelsen IK, Jonsdottír KÝ, Tietze A, et al. The role of the cerebral capillaries in acute ischemic stroke: the extended penumbra model. J Cereb Blood Flow Metab. 2013;33:635–648. doi: 10.1038/jcbfm.2013.18. [DOI] [PMC free article] [PubMed] [Google Scholar]
- Mintun MA, Lundstrom BN, Snyder AZ, Vlassenko AG, Shulman GL, Raichle ME. Blood flow and oxygen delivery to human brain during functional activity: theoretical modeling and experimental data. Proc Natl Acad Sci USA. 2001;98:6859–6864. doi: 10.1073/pnas.111164398. [DOI] [PMC free article] [PubMed] [Google Scholar]
- Hayashi T, Watabe H, Kudomi N, Kim KM, Enmi J-I, Hayashida K, et al. A theoretical model of oxygen delivery and metabolism for physiologic interpretation of quantitative cerebral blood flow and metabolic rate of oxygen. J Cereb Blood Flow Metab. 2003;23:1314–1323. doi: 10.1097/01.WCB.0000090506.76664.00. [DOI] [PubMed] [Google Scholar]
- Ndubuizu O, LaManna JC. Brain tissue oxygen concentration measurements. Antioxid Redox Signal. 2007;9:1207–1220. doi: 10.1089/ars.2007.1634. [DOI] [PubMed] [Google Scholar]
- Gjedde A, Johannsen P, Cold GE, Østergaard L. Cerebral metabolic response to low blood flow: possible role of cytochrome oxidase inhibition. J Cereb Blood Flow Metab. 2005;25:1183–1196. doi: 10.1038/sj.jcbfm.9600113. [DOI] [PubMed] [Google Scholar]
- Buxton RB, Frank LR. A model for the coupling between cerebral blood flow and oxygen metabolism during neural stimulation. J Cereb Blood Flow Metab. 1997;17:64–72. doi: 10.1097/00004647-199701000-00009. [DOI] [PubMed] [Google Scholar]
- King RB, Raymond GM, Bassingthwaighte JB. Modeling blood flow heterogeneity. Ann Biomed Eng. 1996;24:352–372. doi: 10.1007/BF02660885. [DOI] [PMC free article] [PubMed] [Google Scholar]
- Schabel MC. A unified impulse response model for DCE-MRI. Magn Reson Med. 2012;68:1632–1646. doi: 10.1002/mrm.24162. [DOI] [PubMed] [Google Scholar]
- Buxton RB.Interpreting oxygenation-based neuroimaging signals: the importance and the challenge of understanding brain oxygen metabolism Front Neuroenergetics 201028Available from http://www.ncbi.nlm.nih.gov/pmc/articles/PMC2899519/ . [DOI] [PMC free article] [PubMed] [Google Scholar]
- Leithner C, Royl G. The oxygen paradox of neurovascular coupling. J Cereb Blood Flow Metab. 2014;34:19–29. doi: 10.1038/jcbfm.2013.181. [DOI] [PMC free article] [PubMed] [Google Scholar]
- Fujita H, Kuwabara H, Reutens DC, Gjedde A. Oxygen consumption of cerebral cortex fails to increase during continued vibrotactile stimulation. J Cereb Blood Flow Metab. 1999;19:266–271. doi: 10.1097/00004647-199903000-00004. [DOI] [PubMed] [Google Scholar]
- Lin A-L, Fox PT, Hardies J, Duong TQ, Gao J-H. Nonlinear coupling between cerebral blood flow, oxygen consumption, and ATP production in human visual cortex. Proc Natl Acad Sci USA. 2010;107:8446–8451. doi: 10.1073/pnas.0909711107. [DOI] [PMC free article] [PubMed] [Google Scholar]
- Østergaard L, Engedal TS, Aamand R, Mikkelsen R, Iversen NK, Anzabi M, et al. Capillary transit time heterogeneity and flow-metabolism coupling after traumatic brain injury J Cereb Blood Flow Metab 2014341585–1598.Available from http://www.nature.com/jcbfm/journal/vaop/ncurrent/full/jcbfm2014131a.html . [DOI] [PMC free article] [PubMed] [Google Scholar]
- Enager P, Piilgaard H, Offenhauser N, Kocharyan A, Fernandes P, Hamel E, et al. Pathway-specific variations in neurovascular and neurometabolic coupling in rat primary somatosensory cortex. J Cereb Blood Flow Metab. 2009;29:976–986. doi: 10.1038/jcbfm.2009.23. [DOI] [PubMed] [Google Scholar]
- Thomsen K, Piilgaard H, Gjedde A, Bonvento G, Lauritzen M. Principal cell spiking, postsynaptic excitation, and oxygen consumption in the rat cerebellar cortex. J Neurophysiol. 2009;102:1503–1512. doi: 10.1152/jn.00289.2009. [DOI] [PubMed] [Google Scholar]
- Vazquez AL, Masamoto K, Kim S-G. Dynamics of oxygen delivery and consumption during evoked neural stimulation using a compartment model and CBF and tissue PO2 measurements. Neuroimage. 2008;42:49–59. doi: 10.1016/j.neuroimage.2008.04.024. [DOI] [PMC free article] [PubMed] [Google Scholar]
- Thompson HK, Starmer CF, Whalen RE, Mcintosh HD. Indicator transit time considered as a gamma variate. Circ Res. 1964;14:502–515. doi: 10.1161/01.res.14.6.502. [DOI] [PubMed] [Google Scholar]
- Boas DA, Jones SR, Devor A, Huppert TJ, Dale AM. A vascular anatomical network model of the spatio-temporal response to brain activation. Neuroimage. 2008;40:1116–1129. doi: 10.1016/j.neuroimage.2007.12.061. [DOI] [PMC free article] [PubMed] [Google Scholar]
- Boushel R, Gnaiger E, Calbet JAL, Gonzalez-Alonso J, Wright-Paradis C, Sondergaard H, et al. Muscle mitochondrial capacity exceeds maximal oxygen delivery in humans. Mitochondrion. 2011;11:303–307. doi: 10.1016/j.mito.2010.12.006. [DOI] [PubMed] [Google Scholar]
- Jones DP. Intracellular diffusion gradients of O2 and ATP. Am J Physiol. 1986;250 (5 Pt 1:C663–C675. doi: 10.1152/ajpcell.1986.250.5.C663. [DOI] [PubMed] [Google Scholar]
- Gjedde A, Bauer WR, Wong D. Neurokinetics: the dynamics of neurobiology in vivo. Springer: New York, USA; 2011. [Google Scholar]
- Bailey DM, Taudorf S, Berg RMG, Lundby C, Pedersen BK, Rasmussen P, et al. Cerebral formation of free radicals during hypoxia does not cause structural damage and is associated with a reduction in mitochondrial PO2; evidence of O2-sensing in humans. J Cereb Blood Flow Metab. 2011;31:1020–1026. doi: 10.1038/jcbfm.2011.2. [DOI] [PMC free article] [PubMed] [Google Scholar]
- Burmester T, Weich B, Reinhardt S, Hankeln T. A vertebrate globin expressed in the brain. Nature. 2000;407:520–523. doi: 10.1038/35035093. [DOI] [PubMed] [Google Scholar]
- Lee J, Wu W, Lesage F, Boas DA. Multiple-capillary measurement of RBC speed, flux, and density with optical coherence tomography. J Cereb Blood Flow Metab. 2013;33:1707–1710. doi: 10.1038/jcbfm.2013.158. [DOI] [PMC free article] [PubMed] [Google Scholar]
- Mouridsen K, Hansen MB, Østergaard L, Jespersen SN.Reliable estimation of capillary transit time distributions using DSC-MRI J Cereb Blood Flow Metab 2014341511–1521.Available from http://www.nature.com/doifinder/10.1038/jcbfm.2014.111 . [DOI] [PMC free article] [PubMed] [Google Scholar]
- Hudetz AG, Feher G, Weigle CG, Knuese DE, Kampine JP. Video microscopy of cerebrocortical capillary flow: response to hypotension and intracranial hypertension. Am J Physiol. 1995;268:H2202–H2210. doi: 10.1152/ajpheart.1995.268.6.H2202. [DOI] [PubMed] [Google Scholar]


