

Abstract
Muscle dysfunction is a common feature of severe sepsis and multiorgan failure. Recent evidence implicates bioenergetic dysfunction and oxidative damage as important underlying pathophysiological mechanisms. Increased abundance of uncoupling protein-3 (UCP3) in sepsis suggests increased mitochondrial proton leak, which may reduce mitochondrial coupling efficiency but limit reactive oxygen species (ROS) production. Using a murine model, we examined metabolic, cardiovascular, and skeletal muscle contractile changes following induction of peritoneal sepsis in wild-type and Ucp3−/− mice. Mitochondrial membrane potential (Δψm) was measured using two-photon microscopy in living diaphragm, and contractile function was measured in diaphragm muscle strips. The kinetic relationship between membrane potential and oxygen consumption was determined using a modular kinetic approach in isolated mitochondria. Sepsis was associated with significant whole body metabolic suppression, hypothermia, and cardiovascular dysfunction. Maximal force generation was reduced and fatigue accelerated in ex vivo diaphragm muscle strips from septic mice. Δψm was lower in the isolated diaphragm from septic mice despite normal substrate oxidation kinetics and proton leak in skeletal muscle mitochondria. Even though wild-type mice exhibited an absolute 26 ± 6% higher UCP3 protein abundance at 24 h, no differences were seen in whole animal or diaphragm physiology, nor in survival rates, between wild-type and Ucp3−/− mice. In conclusion, this murine sepsis model shows a hypometabolic phenotype with evidence of significant cardiovascular and muscle dysfunction. This was associated with lower Δψm and alterations in mitochondrial ATP turnover and the phosphorylation pathway. However, UCP3 does not play an important functional role, despite its upregulation.
Keywords: mitochondria, metabolism, uncoupling protein 3
muscle dysfunction is a common feature of severe sepsis and other critical illnesses, and a major cause of both prolonged intensive care stay (21) and long-term disability (7, 34). Neuropathic and myopathic features are well recognized (7, 38, 40, 50), yet the underlying pathophysiology remains incompletely understood. A net catabolic state, impaired cellular and calcium signaling, bioenergetic dysfunction, and oxidative damage are all implicated (30, 33, 50). In both patients and animal models, sepsis is associated with decreased skeletal muscle mitochondrial respiratory capacity, reduced mitochondrial protein levels, and increased rates of generation of reactive oxygen (ROS) and nitrogen species (12, 13, 16, 18, 20, 26), all of which may impair muscle function.
The proton electrochemical gradient created by activity of the mitochondrial respiratory chain generates a transmembrane potential (Δψm) that is used by the FoF1 ATP synthase to phosphorylate ADP to ATP (coupled respiration). However, a variable proportion of protons is uncoupled from ATP synthesis by leaking back into the mitochondrial matrix, with the rate of proton flux being dependent on the magnitude of Δψm. Proton leak rate is variable and considered to constitute ∼20% of the basal metabolic rate of hepatocytes, and up to 50% in rat skeletal muscle (53). Uncoupled respiration has basal and inducible components (35), with the inducible part forming the mechanism of heat generation in brown adipose tissue through uncoupling protein (UCP) 1 (44). Other uncoupling proteins (UCP2 to -5) have been identified, but their physiological role and biochemical mechanisms remain controversial. One suggestion is that, following activation by ROS and by-products of ROS damage, these UCPs may induce a mitochondrial proton leak (11, 25) that, in turn, may downregulate ROS production, forming a negative feedback loop (42).
Processes interfering with maintenance of Δψm may impact on cellular energy supply and mitochondrial ROS production (23, 45). Sepsis is associated with high levels of nitric oxide production, which impairs respiratory enzyme function (12, 27). Increased expression of UCP2 and UCP3, reported in septic mouse models (60, 66), suggests a possible increase in proton leak with a reduction in mitochondrial coupling efficiency (the proportion of mitochondrial oxygen consumption used to drive ATP synthesis). A consequential decrease in mitochondrial ATP production could have significant impact on muscle contractile function.
The traditional approach of measuring whole body oxygen consumption as a marker of metabolic rate in sepsis does not take into account the proportion of oxygen use that is uncoupled from oxidative phosphorylation. This proportion may fluctuate considerably over time, particularly in view of the significant thermoregulatory and inflammatory disturbances that occur in this condition.
The aim of our study was to determine changes in metabolism, muscle function, and the influence of UCP3 in an established rodent model of sepsis. We hypothesized that sepsis leads to metabolic suppression and muscle dysfunction as a result of decreased capacity of mitochondrial ATP synthesis, and that UCP3, an uncoupling protein restricted to muscle and adipose tissue, offers protection to ROS-induced muscle contractile dysfunction at the expense of mitochondrial efficiency.
METHODS
Mouse Septic Model
All experiments were performed under the UK Animals (Scientific Procedures) Act 1986 with approval from the University College London Ethics Committee. Ten-week-old male C57 black mice were purchased from Charles River (Margate, UK) and maintained in the university animal facility until they reached 25–35 wk of age. They were housed in cages (maximum 6/cage) with standard bedding, environment-enhancing objects, and free access to water and chow diet. Cages were maintained at room temperature with 12:12-h light-dark cycles. Comparison was made against age-matched litter mice from three Ucp3−/− homozygote breeding pairs [originally produced by Gong et al. (29) and back-crossed 10 generations with wild-type C57 mice]. Confirmatory genotyping was carried out using tail snips. All Ucp3−/− mice were kept in individually ventilated cages with littermates of the same sex kept in the same cage after weaning. Mice were allowed to acclimate to the laboratory for 1 wk before the start of experiments.
The model of sepsis has been described in detail elsewhere (67). In summary, sepsis was induced by intraperitoneal injection of diluted cecal slurry (20 ml/kg) under a brief period of isoflurane anesthesia. Sham mice received 20 ml/kg of 0.9% saline intraperitoneally. As septic mice stop eating, a further sham-starved group was added to account for this potential confounding factor. Starvation commenced after intraperitoneal injection of saline. Mice were block-randomized to each treatment group for each set of experiments.
All mice received 0.9% saline 10 ml/kg subcutaneously at time 0 h, and 50 ml/kg of 5% dextrose/0.81% saline solution at 6, 18, 30, and 42 h. Initial experiments observed 72-h survival, serum biochemical markers of organ failure, blood gases, and echocardiography (Vivid 7; GE Healthcare, Chalfont St. Giles, Bucks, UK) at 24 h. Clinical variables comprising behavior, appearance temperature, and acidemia were used to score sepsis severity (67). Severity scoring was carried out by two observers, one of whom was blinded to the randomization process. The scores given by the two observers were consistently equal. Subsequent studies are outlined below.
Whole Animal Metabolism
Whole body metabolic rate of sham and septic mice was measured for 24 h in individual metabolic chambers (Oxymax; Columbus Instruments, Columbus, OH). Gas samples from each box were sampled for 90 s at 8-min intervals. Oxygen consumption (V̇o2) and CO2 production (V̇co2) were calculated using standard formulas. The respiratory exchange ratio was calculated as the ratio of V̇co2 to V̇o2. Values near 1 indicate a predominance of carbohydrate metabolism while values approaching 0.7 indicate fatty acid oxidation (36). Rectal temperature was measured at 0, 6, 18, and 24 h, and animals were weighed at 0- and 24-h time points.
Assessment of Cardiac Function
Echocardiography was performed at 0, 6, and 24 h in sham and septic wild-type and Ucp3−/− mice using a 14-MHz probe connected to a Vivid 7 Dimension device as previously described (67). Aortic blood flow velocity was measured in the proximal ascending aorta immediately before the bifurcation of the right carotid artery using pulse-wave Doppler. Stroke volume was calculated by multiplying the velocity time integral from six consecutive cycles (equivalent to one respiratory cycle) by aortic cross-sectional area (using an aortic diameter of 0.26 cm). Average peak-to-peak distance and maximum velocity over six consecutive systolic cycles were used to measure heart rate and peak velocity, the latter being a marker of left ventricular contractility (12). Cardiac output was calculated as the product of stroke volume and heart rate.
Western Blotting for UCP3 Protein
UCP3 protein abundance was measured in snap-frozen heart and skeletal muscle tissue at 10 and 24 h following induction of sepsis in the wild-type mice. After SDS protein precipitation, 10 μg protein were separated on a 12% SDS polyacrylamide gel and transferred to nitrocellulose. Membranes were probed overnight at 4°C with the primary antibody (Rabbit anti-UCP3: PA1-055 Pierce antibodies; ThermoFisher Scientific, Loughborough, Leics, UK) at 1:1,000 dilutions in blocking buffer. Each sample was loaded two times in the same gel, and each gel was repeated one time. Following incubation with secondary antibody (goat-anti-rabbit antibody: DAKO, Ely, Cambs, UK), cross-reacted proteins were visualized by enhanced chemiluminescence (Amersham Biosciences, Little Chalfont, Bucks, UK). Densitometry measurements were made using Image J image processing and National Institutes of Health analysis software. A single control sample was used in each gel, and all results were normalized to this control allowing comparison between samples in different gels. α-Tubulin (1:5,000 dilution; Abcam 7291 Cambridge, Cambs, UK) was used to ensure equal loading of gels and transfer of proteins from gel to membrane. Each membrane was also Coomassie stained to ensure equal loading and transfer.
Diaphragm Preparation
At 24 h, under terminal isoflurane anesthesia, a midline laparotomy was performed, and the diaphragm was excised en bloc (still attached to ribs laterally) and pinned (taut without excess stretch) at its edges in a petri dish filled with physiological saline [containing (in mmol/l): 145 Na+, 5 K+, 5 Ca2+, 1 Mg2+, 25 HCO3−, 118 Cl−, 1 SO42−, 1 PO43−, 10 glucose, 10 pyruvate, and equilibrated with 95% O2 and 5% CO2 (pH 7.4)]. Tubocurarine (2.5 μm) was added to stop spontaneous neuromuscular junction activity. Diaphragm strips (∼1 mm wide) were dissected using stereomicroscopy; a strip consisted of muscle fibers with the ribs at one end and central tendon at the other. Strips were allowed to rest in physiological saline for at least 30 min before experimentation. All experiments were performed within 5 h of tissue harvest.
Force and Power Measurements
Aluminium foil T-clips were attached to the rib and central tendon at the ends of the diaphragm strips using cyanoacrylate gel glue. The muscle strips were transferred to a temperature-controlled (23°C) Perspex bath through which physiological saline was continuously circulated. At one end the strip was attached to a combined motor and force transducer (model 300B; Cambridge Technology, Watertown, MA) and the other end to a hook mounted on a micrometer allowing alteration of resting muscle length. Electrical stimulation (MultiStim System-D330; Digitimer, Welwyn Garden City, Herts, UK) was delivered by two platinum electrodes placed in the bath just above and below the belly of the muscle fibers. A program written in TestPoint (Keithley Instruments, Bracknell, Berks, UK) controlled stimulation and motor arm position and recorded force, length, and stimulation. A DAS-1800AO Series A/D board (Keithley Instruments) was used. The computer program could be altered to achieve complex protocols such as force recording during repeated phased cyclical tetanic stimulations while making controlled changes to muscle length.
Following system calibration and zeroing, optimal stimulation voltage (at 96 Hz) was found for the muscle strip; these stimulus parameters were used throughout the experiment. The length/tension relationship was explored by increasing the muscle length in 0.2- to 0.4-mm increments to identify L0, the muscle length at which filament overlap was optimal for isometric tetanic force development. A single 350-ms tetanic stimulation was used to measure the maximal achievable tetanic isometric force. The maximum force generated was expressed relative to muscle cross-sectional area (CSA) to take account of muscle size.
where 4.9 is the wet-to-dry ratio (65), d is density (assumed to be 1 mg/mm3), M is dry mass of the muscle, and L0 is muscle length as defined above. M and L0 were measured at the end of the experiment.
The ability of the muscle to produce work and power was measured using a pattern of sinusoidal movement and stimulation that mimics diaphragm muscle action in vivo. This pattern was described and optimized by Stevens and Faulkner for diaphragm muscle strips from C57 black mice (59). The amplitude of the length change was ±0.4 mm. Stimulation was applied for ∼30% of each movement cycle and was approximately centered on the time at which the muscle length was longest. The maximum power was measured in one cycle of movement at a frequency of 4 Hz. The initial muscle strip length was incrementally increased to find the optimal range. To measure the effects of fatigue on power, cycles of length change with stimulation were repeated over a 1-min period. The frequency of movement was 2 Hz, which is equivalent to 120 breaths/min, close to the average respiratory rate measured in septic mice.
The net work performed by the muscle strip is the “positive work” performed during muscle shortening and contraction, minus the “negative work” to bring the muscle back to its original length (59). We evaluated net work as follows: passive force was recorded during movement without electrical stimulation, and then during the same movement with electrical stimulation. The unstimulated record was subtracted from the stimulated record to give the active force value. Net work performed during the movement cycle was evaluated as the area circumscribed by the active force vs. length change graph, referred to as work loop (Fig. 5C). The average power output during the movement cycle was calculated by dividing net work by cycle duration, and is expressed relative to the muscle strip wet weight to take account of size.
Fig. 5.

A: maximal isometric force generated by 350-ms tetanic stimulation in diaphragm strips taken from WT and Ucp3−/− mice and normalized to cross-sectional area. B: power generated by the muscle strips during sinusoidal length change at 4 Hz with phasic tetanic stimulation simulating in vivo muscle function. Power is expressed relative to muscle wet weight. C: example of a work loop generated by muscle strips from WT-fed sham, starved sham, and septic mice (optimal muscle lengths: 8.4, 9.5, and 9.7; muscle dry weight: 0.665, 0.627, and 0.578 mg, respectively). D: power performance of diaphragm strips taken from fed sham and septic WT and Ucp3−/− mice undertaking 120 repeated work-loop cycles at 2 Hz over a 1-min period. Values are the average power per cycle; for clarity, some values are not shown. The initial rapid decline is shallower, and the first plateau ends earlier (marked by broken vertical line), in the septic groups in both genotypes compared with the sham group. Values are means ± 1 SE.
Diaphragm Muscle Δψm
Diaphragm muscle strips (3–4 mm wide) taken at 24 h from paired fed sham and septic wild-type mice were pinned on a Sylgard imaging chamber and continuously superfused with oxygenated saline solution at 23°C on the stage of an upright epifluorescent microscope (Zeiss Axioskop; Carl Zeiss, Cambridge, Cambs, UK) with a ×63 Achroplan water-dipping objective and 0.9 numerical aperture. The strips were incubated for 45 min with the lipophilic cationic dye tetramethylrhodamine methyl ester (TMRM) (Invitrogen, Paisley, Renfrewshire, UK) added to the circulating saline solution at low concentration (100 nM). Fluorophore excitation was achieved using a femtosecond pulsed Ti;sapphire tunable multiphoton laser (Coherent Chameleon, Santa Clara, CA) set at wavelength 720 nm. A photomultiplier tube detected the emitted light, which was first split by a long-pass 510-nm dichroic mirror before passing through a band-pass filter 560–615 nm.
Accumulation of TMRM in cells and mitochondria depends on both plasma membrane potential and Δψm. At low loading concentrations, TMRM fluorescence intensity is linear to its concentration (24). The baseline fluorescence intensity of TMRM in muscle strips isolated from sham and septic mice was measured and directly compared. Fluorescence intensity was also determined in the presence of the ATP synthase inhibitor oligomycin (10 μg/ml; Sigma-Aldrich, Gillingham, Dorset, UK) and the protonophore carbonyl cyanide 4-(trifluoromethoxy)phenylhydrazone (FCCP, 1 μM; Sigma-Aldrich). The addition of oligomycin can differentiate states where mitochondria are depolarized as a result of high ATP production and flux through the respiratory chain, from other states where a pathological process has resulted in ATP synthase to switch back to its native ATPase activity (17, 28). The addition of FCCP results in dissipation of Δψm, confirming that the TMRM signal is truly mitochondrial and unquenched.
Stepped z-stacked images (10 at 4μm apart) were taken in all three states (baseline, after oligomycin, after FCCP) and assimilated to form a single projection for measurement of TMRM fluorescence intensity. Three different fields of muscle cells corresponding to the brightest regions of the muscle strip with at least five cells per field were analyzed using Zeiss LSM software, and values from the three fields were averaged to give a single result per specimen. Because it was unclear how Δψm would vary between subjects and in sepsis, eight subjects per group were arbitrarily chosen. Statistical comparison was made within the group (i.e., sham or septic) using ANOVA with repeated measures, and between groups using Student's t-test for each state (baseline, +oligomycin, +FCCP).
Isolation of Mitochondria from Total Skeletal Muscle
At the 24-h time point, lower limb, back, and respiratory skeletal muscle were taken from wild-type fed sham, starved sham, and septic mice, with clinical severity scoring performed beforehand. Mitochondria were then isolated as described by Bhattacharya et al. (8) at 4°C. In brief, muscles were rapidly removed, weighed, and placed in ice-cold isolation solution (100 mM KCl, 50 mM Tris·HCl, and 2 mM EGTA, pH 7.4 at 4°C). The muscle was minced, and the muscle slurry was washed and protease-digested in digestion buffer {(in mM) 100 KCl, 50 Tris·HCl, 2 EGTA, 1 ATP, 5 MgCl2·6H2O, 0.5% defatted BSA, and protease type VIII (245.7 U/100 ml; Sigma P 5380), pH 7.4}. The mixture was Dounce homogenized and spun for 10 min at 490 g. Supernatant was filtered and spun in two to three stages for 10 min each at 10,400 g. The final pellet (mitochondria) was resuspended in a small volume of isolation medium (0.6–0.8 ml), and protein concentration was measured using a BCA protein assay kit (ThermoFisher Scientific).
To determine percentage recovery of mitochondria from skeletal muscle homogenate from all three groups of mice, citrate synthase activity was assayed at each step of the isolation process by spectrophotometric determination of oxaloacetate-dependent coenzyme A-coupled reduction of 5,5′-dithiobis-(2-nitrobenzoic acid) at 412 nm (57), in an assay adapted for 96-well plates.
Respiratory Activity of Isolated Mitochondria and Modular Kinetic Analysis
Respiratory activity of isolated mitochondria was determined using a Clark electrode chamber (Rank Brothers, Bottisham, Cambs, UK) surrounded by a thermostatically controlled water jacket at 30°C and calibrated with air-saturated assay medium. Mitochondria (0.35 mg/ml) were incubated in assay medium [(in mM) 120 KCl, 5 KH2PO4, 3 HEPES, 1 EGTA, and 0.3% (wt/vol) defatted BSA, pH 7.4].
Respiratory control ratios were calculated as state 3 respiratory rate after addition of ADP (200 μM) divided by the state 4 rate after ADP phosphorylation with 5 mM pyruvate and 2 mM malate as substrates. Ratios of 3–10 have been quoted as acceptable respiratory control ratios (51, 58). FCCP (1–3 μM) was added at end-study to measure maximal oxygen consumption rate; a threefold rise in respiratory rate has been used to indicate good mitochondrial quality (58).
Modular Kinetic Analysis
This technique allows interrogation of mitochondrial pathways that generate Δψm (substrate oxidation), and pathways that utilize/dissipate it (proton leak and ATP turnover) (10, 15, 47, 48). The conceptual division of mitochondrial respiration into these three kinetic modules is further detailed in Fig. 1. The modules are divided into a substrate oxidation module (Δψm producing); an ATP turnover module, comprising phosphorylation and associated transport activity (Δψm dissipating); and a proton leak module (Δψm dissipating). Substrate oxidation and proton leak kinetics are determined directly, whereas ATP turnover is derived by subtracting proton leak from total Δψm-dissipating pathway activity. Studies were performed in a specially adapted 7-ml Clark electrode chamber that simultaneously measures oxygen consumption and Δψm using a methyltriphenylphosphonium (TPMP+) electrode in the presence of nigericin (0.1 μM) to abolish the pH gradient. Following addition of mitochondria (0.35 mg/ml) to the assay medium [(in mM) 120 KCl, 5 KH2PO4, 3 HEPES, 1 EGTA, 0.3% (wt/vol) defatted BSA, and 0.1 μM nigericin; pH 7.4], the TPMP+ electrode was calibrated with five sequential 0.5-μM additions of TPMP. Mitochondria were energized with 8 mM succinate (+5 μM rotenone). The starting oxygen level and the zero point were used for two-point calibration of the Clark electrode (100 and 0% points). FCCP was added at the end of all experimental runs to correct for any drift of the TPMP+ electrode. Because of the large number of mitochondria needed for each of the protocols, mitochondria isolated from two mice in the same group were pooled. Each protocol was run two times, and the results were averaged.
Fig. 1.
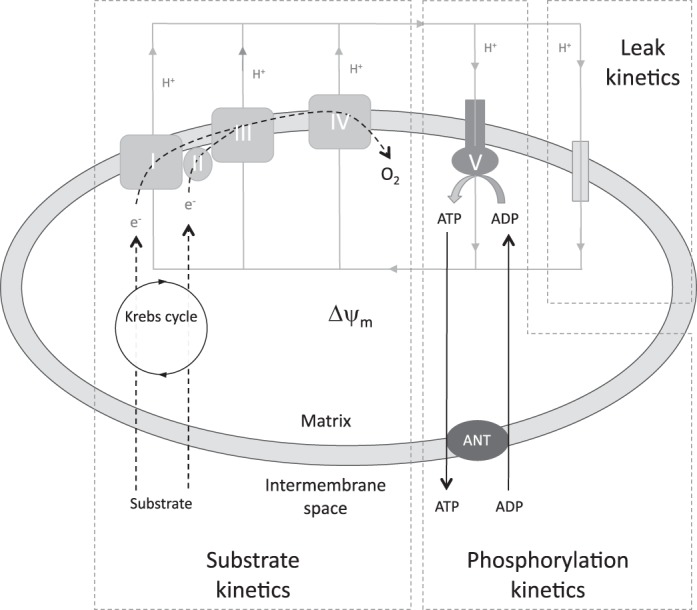
Simplified illustration of mitochondrial bioenergetic pathways split into three groups of reactions: 1) reactions that generate mitochondrial membrane potential (Δψm) (substrate kinetics), 2) reactions consuming Δψm to generate ATP (phosphorylation kinetics), and 3) reactions that consume Δψm without generating ATP (leak kinetics). ANT, adenine nucleotide translocator. Adapted from Ref. 45.
Because the kinetic response of each module to an effector reflects a change in the common intermediate, Δψm, the kinetic curves of modules that consume protonmotive force are independent of the respiratory substrate used to generate that Δψm (2). Succinate (8 mM) was used as a substrate in all experiments, since mitochondrial energization is more readily achieved than with NADH-linked substrates (41). The kinetic dependency of oxygen consumption towards Δψm was described for each kinetic pathway module by modulating Δψm using effectors targeted towards another module within the system. Substrate oxidation kinetics were measured in the presence of oligomycin (1.3 μM) by sequential depolarization with FCCP (0.2–1 μM). Proton leak kinetics were determined in the presence of 1.3 μM oligomycin by sequential additions of malonate (0.1–2.3 mM). The kinetics of total Δψm-dissipating activity (proton leak + ATP turnover reactions) were measured under state 3 conditions (2 mM ADP) by sequential additions of malonate (0.1–2.3 mM). ATP turnover kinetics (phosphorylation and transport reactions) were subsequently calculated by subtraction of proton leak rate from the state 3 respiratory rate at the corresponding value of Δψm. FCCP (1 μM) was added at the end of all experimental runs to correct for drift of the TPMP+ electrode.
To test for statistical significance, respiration rates between flanking values of Δψm were interpolated so that, for each curve, oxygen consumption at Δψm of −170 mV was calculated. This value was the highest Δψm common to all conditions. The higher the value of Δψm, the higher the flux of protons through the various Δψm-consuming modules, and therefore the more likely to see a result emerging through the inherent noise of the experimental setup. Additionally, uncoupling proteins (UCP3 in particular) may require a high Δψm to become active (48). One-way ANOVA was used to test for difference in V̇o2 between the groups at Δψm of −170 mV.
Statistical Analysis
Statistical analysis was performed using SPSS 18.0 (IBM) software. Data were normally distributed, unless stated. Student's t-test, Mann-Whitney U-tests, and ANOVA (with and without repeated-measures calculations) were used to test for statistical significance with the alpha error set to <5% (P < 0.05). Tukey and Dunnet post hoc tests were used to define significance.
RESULTS
Whole Body Physiology and Skeletal Muscle Function
Mortality and whole animal metabolism.
Mortality rates of the septic wild-type (n = 11) and Ucp3−/− (n = 12) mice at 24-, 48-, and 72-h time points were similar, at ∼20, 70, and 73%, respectively (Fig. 2). No deaths occurred in either wild-type (n = 10) or Ucp3−/− (n = 9) sham groups. Septic mice developed a mixed respiratory and metabolic acidosis with biochemical evidence of acute kidney and liver injury (Table 1). The degree of organ dysfunction and acidosis correlated with severity of illness and mortality.
Fig. 2.
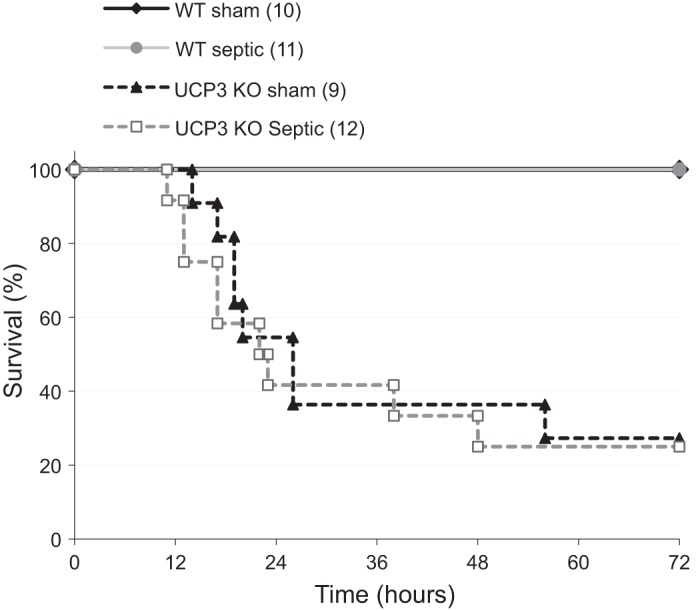
Survival curve of wild-type (WT, n = 11) and uncoupling protein-3-deficient (Ucp3−/−) mice (n = 12) after ip injection of fecal slurry. Sham mice (10 WT, 9 Ucp3−/−) received ip saline. All animals received sc fluids at 0-, 6-, 18-, 30-, and 42-h time points. KO, knockout.
Table 1.
Blood gas and serum biochemistry at 24 h in wild-type mice following induction of sepsis with comparison against sham controls
| pH | pCO2, kPa | pO2, kPa | Lactate, mmol/l | Hb, g/dl | Glucose, mmol/l | Urea, mmol/l | Creatinine, μmol/l | AST, IU/l | ALT, IU/l | |
|---|---|---|---|---|---|---|---|---|---|---|
| Sham | 7.33 ± 0.03 | 4.3 ± 0.3 | 13.4 ± 4.2 | 2.4 ± 0.9 | 13.2 ± 0.2 | 11.7 ± 4.0 | 6.5 ± 2.0 | 10 ± 6 | 61 ± 30 | 24 ± 14 |
| Septic | 6.96 ± 0.12* | 8.5 ± 4.1* | 12.2 ± 4.3 | 5.0 ± 1.2* | 15.1 ± 1.6* | 14.9 ± 2.4* | 34 ± 28* | 30 ± 15* | 266 ± 95* | 77 ± 28* |
Values are means ± SD. Hb, hemoglobin; AST, aspartate transaminase; ALT, alanine aminotransferase; IU international unit.
P < 0.05.
Sepsis produced a large and rapid drop in core temperature and metabolic rate with good correlation between temperature and V̇o2 (R2 = 0.95) (Fig. 3, A–C). Responses were similar in both wild-type and Ucp3−/− groups. In both genotypes, the sham-fed mice lost a small amount of weight over the first 24 h (−2 ± 1% SE body weight change; P = 0.08). This was more pronounced in the starved sham mice (−8 ± 1% SE body weight change; P < 0.0001). However, the septic mice gained weight (5 ± 1% SE body weight; P < 0.001) because of a combination of renal dysfunction and fluid sequestration in body cavities (pleural effusions and ascites) and subcutaneous tissues evident at postmortem examination (Fig. 3D).
Fig. 3.

Temperature (A) and oxygen consumption (B) of WT and Ucp3−/− mice following induction of sepsis (or sham controls). C: plot of oxygen consumption against core temperature of WT and Ucp3−/− mice. Line of best fit and correlation coefficient are noted. D: percentage weight change of sham and septic mice over 24 h. Statistical significance (P < 0.05) was seen between groups in each genotype. All mice received sc fluid at 0-, 6-, and 18-h time points; food was withdrawn from starved sham mice immediately after ip injection of saline. *P < 0.05 compared with sham fed using 2-way ANOVA for temperature data over time, and 1-way ANOVA for weight data. §P < 0.05 2-way ANOVA comparing both genotypes with the other groups.
Cardiac function.
Echocardiography was performed in 16 sham and 13 severe septic wild-type mice, and 9 sham and 7 severe septic Ucp3−/− mice (Fig. 4). Compared with baseline values, there was a marked reduction in cardiac output at 6 and 24 h in the severe septic mice in both genotypes (P < 0.02 within-group ANOVA, but no statistical significance between the two genotypes). Decreases were noted in left ventricular contractility (measured as peak flow velocity), stroke volume, and heart rate. No difference was seen between wild-type and Ucp3−/− groups.
Fig. 4.

Echocardiography results of WT and Ucp3−/− mice following ip injection of fecal slurry or n-saline. All septic mice were in the severe category according to the clinical scoring scale. Results are means ± SE. *P < 0.02 comparing sham values between the two genotypes; §P < 0.01 comparing septic and sham values in the same genotype using 2-way ANOVA repeated measures.
Diaphragm muscle force and power.
Measurements were made on diaphragm strips from both wild-type (9 fed sham, 8 starved sham, 9 septic wild type) and Ucp3−/− (6 fed sham, 8 starved sham, 7 septic) mice. The average ages (±SE) were 35 ± 2 wk for wild-type mice and 35 ± 3.5 wk for Ucp3−/− mice (P = 0.92), with average weights of 32 ± 4 and 34 ± 3 g, respectively (P = 0.048). At 24 h, maximal tetanic isometric force generated by diaphragm strips from septic wild-type mice was 28% lower than that produced by either fed or starved sham mice (P < 0.05) (Fig. 5A). Similarly, maximal power generated during a single-length cycle at 4 Hz (mimicking 240 breaths/min, typical for normal mice) was 36 and 28% lower in muscle strips from septic mice than from fed and starved sham mice, respectively (P < 0.05 1-way ANOVA) (Fig. 5B). Similar results were seen in the muscle strips from Ucp3−/− animals (Fig. 5, A and B). The work loop profiles generated by all sets of muscle strips showed a similar contraction-relaxation profile (Fig. 5C).
The effect of fatigue on power output was assessed during cycles of movement and stimulation repeated for 1 min. A movement frequency of 2 Hz was used to mimic the respiratory rate of 120 breaths/min in a septic mouse. A characteristic pattern of power fatigue was seen: an initial rapid decline was followed by a plateau phase, and then a second rapid decline to a lower plateau (Fig. 5D). The initial power in the fatigue test (Fig. 5D) was about one-half of the maximum power (shown in Fig. 5B) because of the difference in movement frequency, 2 and 4 Hz, respectively. For both genotypes, the power output throughout the fatigue test was lower in the septic group than in either of the sham groups. For both genotypes, the duration of the first plateau ended sooner in the septic group (35 ± 3 cycles) compared with both fed sham (41 ± 6 cycles) and starved sham (41 ± 4 cycles) strips (P = 0.02).
In summary, sepsis resulted in severe hypothermia and metabolic suppression associated with cardiovascular dysfunction, lower muscle force and power generation, and earlier fatigue. Because no differences were seen between wild-type and Ucp3−/− mice, this implies that UCP3 does not affect the response to sepsis either at the level of the whole animal or at the level of muscle (dys)function. Further experiments were thus performed using only wild-type animals.
Mitochondrial Physiology
A detailed analysis of mitochondrial function was performed to determine whether mitochondrial dysfunction, potentially including increased proton leak, could underlie the muscle dysfunction described above. Studies were performed using wild-type mice only.
UCP protein abundance.
UCP3 protein expression in diaphragms taken from wild-type sham (n = 6) and severe septic mice (n = 9) at 24 h was assessed by Western blot. UCP3 protein abundance increased by 26 ± 6% (SE) compared with sham (P < 0.05). The α-tubulin densitometry signal decreased in septic wild-type mouse diaphragms by 22 ± 7% at 10 h (P = 0.016) and by 12 ± 6% at 24 h (not significant). The ratio of UCP3 to α-tubulin change was 47 ± 13% (P < 0.05; Fig. 6). Coomassie staining confirmed equal protein loading and transfer. UCP2 was not detectable in these samples using three different commercially available antibodies.
Fig. 6.
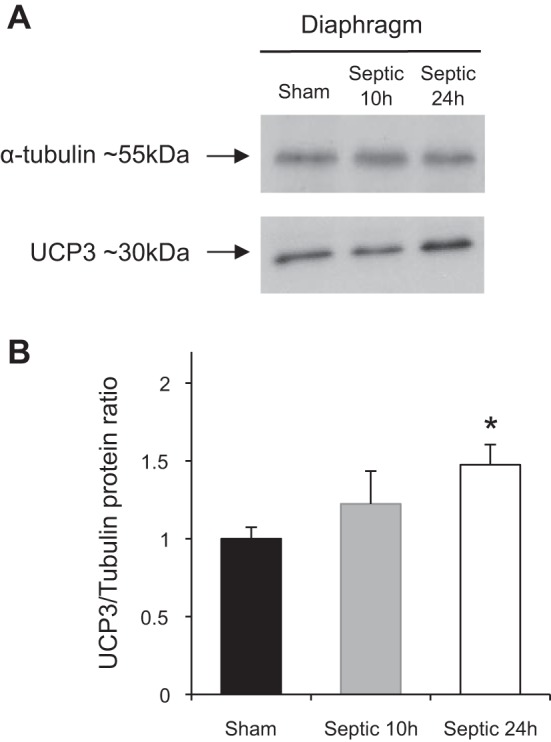
A: representative Western blots of UCP3 protein content of diaphragm muscles from sham (n = 6) and septic WT mice 24 h after injection of fecal slurry (n = 8). B: mean (±SD) densitometry values of UCP3 protein abundance at 10 and 24 h in diaphragm muscle. Values were normalized to α-tubulin content. *P < 0.05 compared with sham using 1-way ANOVA.
Mitochondrial membrane potential in diaphragm muscle strips.
Muscle strips from nine fed sham and nine septic wild-type mice were compared simultaneously. TMRM loading took 45 min to reach steady state before imaging. A typical double-row and subsarcolemmal high-intensity fluorescence pattern was observed in all muscle cells, representing interfibrillar and subsarcolemmal groups of mitochondria (Fig. 7, A–C). Baseline TMRM fluorescence in diaphragms from wild-type septic mice was significantly lower than diaphragms from sham mice, suggesting a decrease in Δψm (Fig. 7D). The ATP synthase inhibitor oligomycin was then added to observe changes in Δψm following inhibition of mitochondrial ATP production. This differentiates between states where mitochondria are depolarized as a result of high ATP production and flux through the respiratory chain, from other states where the ATP synthase switches into its native ATPase activity (17, 28). In the diaphragm strips, oligomycin increased TMRM fluorescence, with a greater relative increase above baseline in the septic group (increase of 30 ± 5% in septic diaphragm vs. 16 ± 8% in sham; P < 0.001). Absolute values of fluorescence postoligomycin were not statistically different between the two groups (P = 0.1), suggesting the differences are attributable to a difference in proton flux through the FoF1-ATP synthase. The addition of FCCP resulted in complete dissipation of Δψm in all specimens examined, confirming unquenched mitochondrial TMRM signal (24).
Fig. 7.

Live-cell images of tetramethylrhodamine methyl ester (TMRM, A) and Mitotracker green (B and C) fluorescence pattern in diaphragm muscle cells. Two distinct mitochondrial subpopulations of subsarcolemmal (SS) and intefibrillar (IF) are seen. Characteristic double-band pattern of interfibrillar mitochondria is shown in B (arrow). C: Z-stack 3-dimensional (3-D) image projection of a diaphragm strip loaded with Mitotracker green showing muscle and pleural cells on the surface. D: average TMRM fluorescence intensity of isolated diaphragm strips from sham and septic WT mice at 24 h bathed in 100 nM TMRM (baseline), and after addition of 5 μg/ml oligomycin (*P = 0.016 independent-sample t-test; **P < 0.01 paired t-test comparing fluorescence after oligomycin with baseline in the septic mice).
Citrate synthase activity and respiratory control of isolated mitochondria from skeletal muscle.
Mitochondria were isolated from muscles of 8 fed sham, 8 starved sham, and 13 severe septic wild-type mice (clinical severity 5–6). Fractional recovery (mean ± SD) of citrate synthase activity at each step of the mitochondrial preparation process compared with the initial muscle homogenate was similar in all three groups, with a final recovery in the mitochondrial pellet of 43 ± 11% (fed sham), 38 ± 23% (starved sham), and 41 ± 9% (septic) (P = 0.48). The respiratory control of the final mitochondrial pellet measured using the NADH-linked substrates pyruvate and malate was also similar (3.0 ± 0.6 fed sham, 3.5 ± 0.9 starved sham, 2.9 ± 0.5 septic; P = 0.47).
Modular kinetic analysis of isolated skeletal muscle mitochondria.
The effect of sepsis on the kinetic behavior of processes that govern Δψm was examined using modular kinetic analysis in 8 fed sham, 8 starved sham, and 13 severe septic mice. Substrate oxidation (Δψm-producing) and proton leak (Δψm-consuming) kinetics were determined directly, whereas ATP turnover (Δψm consuming) was derived by subtracting proton leak from total Δψm-dissipating pathway activity. Proton leak kinetics were similar in all three groups (Fig. 8, A and B). However, the kinetic behavior of total Δψm-dissipating processes (Fig. 8, C and D) and ATP turnover processes (Fig. 8, E and F) was significantly affected in the septic mice: for a given membrane potential (−170 mV), the oxygen consumption rate was significantly lower in mitochondria from septic animals (207 ± 26 fed sham, 157 ± 53 starved sham, and 120 ± 30 septic nmol oxygen·min−1·mg−1; P < 0.05). Whereas the substrate oxidation kinetic curves of the septic and fed sham mice were similar (Fig. 8, G and H), the curve for the starved sham group (316 ± 19 nmol oxygen·min−1·mg−1) was significantly different compared with both fed sham (230 ± 17) and septic (312 ± 22) groups (P < 0.05), with oxygen consumption rates lower at all values of Δψm.
Fig. 8.

Dependency of oxygen consumption rate on Δψm for different Δψm-producing and -dissipating kinetic modules (left), with oxygen consumption rates at Δψm of −170 mV (right), for mitochondria isolated from total skeletal muscle of septic, fed sham, and fasted sham mice. A and B: proton leak kinetics; C and D: total Δψm-dissipating pathways (proton leak + ATP turnover reactions) under state 3 conditions; E and F: ATP turnover kinetics (phosphorylation + transport reactions) - kinetic curves derived from subtraction of A from C; G and H: substrate (succinate) oxidation kinetics. *P < 0.05 1-way ANOVA significance of septic vs. both sham groups; **P < 0.05 1-way ANOVA starved sham vs. fed sham and septic groups.
DISCUSSION
In this rodent model of sepsis and multiorgan failure, we have shown early muscle dysfunction and fatigue associated with metabolic suppression, lower Δψm and phosphorylation capacity, but no change in mitochondrial proton leak despite an increase in UCP3 protein abundance. These changes were unaffected by the presence or absence of UCP3 protein.
The pathophysiology of multiorgan failure and muscle dysfunction in established sepsis is complex and multifactorial. Recent interest has focused on bioenergetic dysfunction: increased production of reactive oxygen species results in disruption of metabolic processes and cell damage (12, 13, 61), whereas decreased transcription of mitochondrial proteins affects respiratory capacity (18, 32). A decrease in cell metabolism may also occur for other reasons, e.g., secondary to a decrease in thyroid activity associated with critical illness (9).
Recent publications have highlighted limitations of mouse models of sepsis and the lack of translation of successful treatments from animal models to humans (31, 56). Indeed, significant disparity was reported between mice and humans in their gene expression profile response to inflammatory conditions, including sepsis (56). We reported marked differences in the metabolic response to sepsis between rats and mice (67). As seen in the present study, mice showed an early and severity-dependent hypometabolic, hypothermic phenotype with early myocardial depression. This presentation is seen in ∼10% of cases of human sepsis and is associated with a two- to threefold increased risk of mortality (4, 19). However, the ability to define the roles of specific genes by genetic manipulation and to study fully intact biological systems in complex diseases justify an ongoing role for rodent models in defining pathophysiological mechanisms (46). We did make considerable efforts to refine and optimize our murine septic model. These included using older mice equivalent to 30- to 40-yr-old humans (63), injecting a standardized septic inoculum, providing regular fluid administration to limit hypovolemia-induced tissue hypoperfusion, and performing a block randomization for group allocation in experiments (67).
Metabolic suppression and hypothermia are well-described phenomena in septic mice, and are influenced by age, septic insult, and ambient temperature (22, 54, 62, 67). We previously demonstrated that rewarming of septic mice to normothermia failed to increase metabolic rate (67), implying a primary metabolic suppression rather than a reactive response to hypothermia.
UCP3 is upregulated in sepsis (60, 66), prompting speculation about the role of this protein in decreasing mitochondrial coupling efficiency. This may, however, act as a negative feedback loop to reduce ROS production (11). We set out to establish the importance and functional consequence of this increase in UCP3 expression, but instead report no detectable differences in the responses of Ucp3−/− mice to sepsis. Rather than detecting effects on mitochondrial proton leak, our findings suggest that processes related to mitochondrial phosphorylation may be affected.
Previous studies in healthy Ucp3−/− mice also found little difference in thermoregulation and oxygen consumption rate compared with their wild-type controls (6, 64). Despite a fivefold increase in skeletal muscle UCP3 in mice given intraperitoneal endotoxin, Yu et al. in fact described a drop in core temperature to 30°C (66). While we too observed an increase in skeletal muscle UCP3, we found no impact of the lack of UCP3 protein upon metabolic changes, temperature, cardiovascular and muscle function, or mortality in sepsis. Similarly, although skeletal muscle mitochondria isolated from healthy Ucp3−/− mice showed more coupled respiration and increased ROS production (64), we could find no differences in force, power, and response to repeated stimulation between diaphragm muscle strips isolated from septic wild-type and Ucp3−/− mice. The original description of the Ucp3−/− mouse showed no compensatory upregulation of other UCPs (64), although it is conceivable that such upregulation may be seen with sepsis. In line with previous work, we were unable to detect UCP2 in muscle from either sham or septic mice using a number of commercially available UCP2 antibodies (data not shown).
We imposed repeated work-loop cycles to mimic in vivo diaphragm muscle activity to assess muscle fatigue (59). To our knowledge, the present study is the first description of this functional assessment in a septic model. The plots show a characteristic three-phase response (39); the second phase, a quasiplateau phase of reduced function, involves recruitment of oxidative metabolism and ends with depletion of high-energy substrates and accumulation of phosphate and other end-products of metabolism (5). We found that this second phase was significantly shorter in septic mice, was affected by hypoxia (data not shown), but was independent of UCP3 protein expression. This finding supports the notion of linkage between disorders of oxidative metabolism and an inability to maintain high levels of energy substrate.
A significantly lower Δψm was seen in the diaphragmatic myocytes of septic mice. While previously shown in cells (1, 55), to our knowledge this is the first demonstration of altered Δψm in sepsis in a complex muscle preparation. The low Δψm was a consistent finding in the septic mice and suggests either a decreased rate of Δψm generation (e.g., because of a respiratory chain defect) or an increase in turnover of pathways that dissipate the gradient such as proton leak or ATP production (23). Blocking ATP synthase with oligomycin increased fluorescence and hence Δψm. This rise was significant in the septic group and suggests higher ATP turnover in these diaphragm muscle cells. This was an unexpected finding, since previous studies had shown lower respiratory complex activity and lower oxygen consumption in tissues and cells taken from septic animals and humans (13, 16, 20).
Our interrogation of kinetic pathways involved in the maintenance of Δψm implies that the mitochondrial pathway that generates Δψm through succinate oxidation was unaffected in this model of sepsis. Substrate oxidation rates of mitochondria isolated from starved sham mice were depressed at all values of Δψm compared with the other groups. This implies either an altered sensitivity of these mitochondria to FCCP and/or that metabolic adaptations in sepsis do not simply reflect a stressed nutritional state. Previous descriptions of mitochondrial function in sepsis suggest complex I dysfunction (12, 13). Whereas a full kinetic description of NADH-linked substrate oxidation kinetics was not attempted here because of technical constraints, neither state 3 nor state 4 respiration was significantly different between groups when the mitochondria were energized with complex 1 substrates pyruvate and malate.
Proton leak kinetics were unaffected by the septic insult, despite the rise in UCP3 protein levels in the septic mice, although these experiments were not repeated in the presence of free fatty acids or GDP (47). However, ATP turnover kinetics were significantly affected in the septic mice with lower oxygen consumption rates at given values of Δψm when mitochondria were phosphorylating ADP. Defects in ATP synthase in sepsis have been described previously and may explain these observations (16, 37, 43, 52). The higher ATP turnover in the diaphragms of septic mice suggested by the Δψm experiments, in conjunction with the altered ATP turnover kinetics seen in muscle mitochondria isolated from septic mice, may explain, at least in part, the earlier fatigue observed in the diaphragm muscle strip studies.
An issue to consider with the use of isolated mitochondria, especially in conditions such as sepsis, is that removal from their usual cellular environment takes away the impact of local regulatory processes and high levels of inflammatory mediators, and also exposes them to a supranormal oxygen milieu. Such regulatory processes include energy-consuming pathways, resulting in altered ATP demand, or pathways that impose control over substrate trafficking into the mitochondria and substrate oxidation, thereby regulating respiratory chain function and, ultimately, ATP synthesis (14). Nitric oxide, pyruvate dehydrogenase kinase-4 and hypoxia-inducible factor-1α are all implicated in sepsis (3, 12, 49); these likely continue to impose control over mitochondrial function in the intact cell and tissues. Following mitochondrial isolation and washing, and exposure to hyperoxic conditions, such control may be lost. A comparison of our findings using in situ and isolated mitochondria implies that sepsis modifies both local regulatory processes and the oxidative phosphorylation machinery itself. These functional changes were not associated with swollen or ruptured mitochondria in an examination of electron micrographs of diaphragm muscles from a limited number of sham and septic mice (data not shown). Although no formal morphological examination of these was carried out, no gross changes in the shape, size, or distribution of mitochondria were noted.
In summary, the long-term, resuscitated septic mouse model that we have described exhibits metabolic suppression, hypothermia, and decreased cardiovascular activity. Diaphragm muscle strips from septic mice exhibit increased fatiguability ex vivo; this may be related in part to mitochondrial dysfunction. Despite increased UCP3 protein abundance in sepsis, kinetic analysis of isolated mitochondria from skeletal muscle revealed that proton leak kinetics were not different from sham controls, whereas the lack of UCP3 protein did not impact on mortality, physiological changes, or muscle functionality. However, ATP turnover kinetics were significantly altered, implying a defect with ATP synthesis at the level of the FoF1 synthase or an associated transport process.
GRANTS
This work was funded by a Medical Research Ccouncil Clinical Research Fellowship grant for P. S. Zolfaghari.
DISCLOSURES
No conflicts of interest, financial or otherwise, are declared by the authors.
AUTHOR CONTRIBUTIONS
Author contributions: P.S.Z., J.E.C., N.P., N.A.C., M.R.D., and M.S. conception and design of research; P.S.Z. performed experiments; P.S.Z. and N.P. analyzed data; P.S.Z., J.E.C., N.P., N.A.C., M.R.D., and M.S. interpreted results of experiments; P.S.Z. prepared figures; P.S.Z. drafted manuscript; P.S.Z., J.E.C., N.P., N.A.C., M.R.D., and M.S. edited and revised manuscript; P.S.Z., J.E.C., N.P., N.A.C., M.R.D., and M.S. approved final version of manuscript.
ACKNOWLEDGMENTS
We are grateful for the technical help and assistance of Raymond Stidwill and Valerie Taylor with the septic model.
GLOSSARY
- Δψm
Mitochondrial membrane potential
- TMRM
Tetramethylrhodamine methyl ester
- TPMP
Methyltriphenylphosphonium
- UCP
Uncoupling protein
- V̇o2
Whole body oxygen consumption
- V̇co2
Whole body carbon dioxide production
- WT
Wild-type
REFERENCES
- 1.Adrie C, Bachelet M, Vayssier-Taussat M, Russo-Marie F, Bouchaert I, Adib-Conquy M, Cavaillon JM, Pinsky MR, Dhainaut JF, Polla BS. Mitochondrial membrane potential and apoptosis peripheral blood monocytes in severe human sepsis. Am J Respir Crit Care Med 164: 389–395, 2001. [DOI] [PubMed] [Google Scholar]
- 2.Affourtit C, Quinlan CL, Brand MD. Measurement of proton leak and electron leak in isolated mitochondria. Methods Mol Biol 810: 165–182, 2012. [DOI] [PubMed] [Google Scholar]
- 3.Alamdari N, Constantin-Teodosiu D, Murton AJ, Gardiner SM, Bennett T, Layfield R, Greenhaff PL. Temporal changes in the involvement of pyruvate dehydrogenase complex in muscle lactate accumulation during lipopolysaccharide infusion in rats. J Physiol 586: 1767–1775, 2008. [DOI] [PMC free article] [PubMed] [Google Scholar]
- 4.Arons MM, Wheeler AP, Bernard GR, Christman BW, Russell JA, Schein R, Summer WR, Steinberg KP, Fulkerson W, Wright P, Dupont WD, Swindell BB. Effects of ibuprofen on the physiology and survival of hypothermic sepsis. Ibuprofen in Sepsis Study Group. Crit Care Med 27: 699–707, 1999. [DOI] [PubMed] [Google Scholar]
- 5.Barclay CJ, Constable JK, Gibbs CL. Energetics of fast- and slow-twitch muscles of the mouse. J Physiol 472: 61–80, 1993. [DOI] [PMC free article] [PubMed] [Google Scholar]
- 6.Barclay CJ, Woledge RC, Curtin NA. Effects of UCP3 genotype, temperature and muscle type on energy turnover of resting mouse skeletal muscle. Pflügers Arch 457: 857–864, 2009. [DOI] [PubMed] [Google Scholar]
- 7.Batt J, dos Santos CC, Cameron JI, Herridge MS. Intensive care unit-acquired weakness: clinical phenotypes and molecular mechanisms. Am J Respir Crit Care Med 187: 238–246, 2013. [DOI] [PubMed] [Google Scholar]
- 8.Bhattacharya SK, Thakar JH, Johnson PL, Shanklin DR. Isolation of skeletal muscle mitochondria from hamsters using an ionic medium containing ethylenediaminetetraacetic acid and nagarse. Anal Biochem 192: 344–349, 1991. [DOI] [PubMed] [Google Scholar]
- 9.Boelen A, Kwakkel J, Fliers E. Beyond low plasma T3: local thyroid hormone metabolism during inflammation and infection. Endocr Rev 32: 670–693, 2011. [DOI] [PubMed] [Google Scholar]
- 10.Brand MD. The proton leak across the mitochondrial inner membrane. Biochim Biophys Acta 1018: 128–133, 1990. [DOI] [PubMed] [Google Scholar]
- 11.Brand MD, Esteves TC. Physiological functions of the mitochondrial uncoupling proteins UCP2 and UCP3. Cell Metab 2: 85–93, 2005. [DOI] [PubMed] [Google Scholar]
- 12.Brealey D, Brand M, Hargreaves I, Heales S, Land J, Smolenski R, Davies NA, Cooper CE, Singer M. Association between mitochondrial dysfunction and severity and outcome of septic shock. Lancet 360: 219–223, 2002. [DOI] [PubMed] [Google Scholar]
- 13.Brealey D, Karyampudi S, Jacques TS, Novelli M, Stidwill R, Taylor V, Smolenski RT, Singer M. Mitochondrial dysfunction in a long-term rodent model of sepsis and organ failure. Am J Physiol Regul Integr Comp Physiol 286: R491–R497, 2004. [DOI] [PubMed] [Google Scholar]
- 14.Brown GC. Control of respiration and ATP synthesis in mammalian mitochondria and cells. Biochem J 284: 1–13, 1992. [DOI] [PMC free article] [PubMed] [Google Scholar]
- 15.Brown GC, Cooper CE. Bioenergetics: A Practical Approach. Oxford, UK: IRL, 1995. [Google Scholar]
- 16.Callahan LA, Supinski GS. Sepsis induces diaphragm electron transport chain dysfunction and protein depletion. Am J Respir Crit Care Med 172: 861–868, 2005. [DOI] [PubMed] [Google Scholar]
- 17.Campanella M, Parker N, Tan CH, Hall AM, Duchen MR. IF(1): setting the pace of the F(1)F(o)-ATP synthase. Trends Biochem Sci 34: 343–350, 2009. [DOI] [PubMed] [Google Scholar]
- 18.Carré JE, Orban JC, Re L, Felsmann K, Iffert W, Bauer M, Suliman HB, Piantadosi CA, Mayhew TM, Breen P, Stotz M, Singer M. Survival in critical illness is associated with early activation of mitochondrial biogenesis. Am J Respir Crit Care Med 182: 745–751, 2010. [DOI] [PMC free article] [PubMed] [Google Scholar]
- 19.Clemmer TP, Fisher CJ, Bone RC, Slotman GJ, Metz CA, Thomas FO. Hypothermia in the sepsis syndrome and clinical outcome. The Methylprednisolone Severe Sepsis Study Group. Crit Care Med 20: 1395–1401, 1992. [DOI] [PubMed] [Google Scholar]
- 20.Crouser ED, Julian MW, Blaho DV, Pfeiffer DR. Endotoxin-induced mitochondrial damage correlates with impaired respiratory activity. Crit Care Med 30: 276–284, 2002. [DOI] [PubMed] [Google Scholar]
- 21.De Jonghe B, Sharshar T, Lefaucheur JP, Authier FJ, Durand-Zaleski I, Boussarsar M, Cerf C, Renaud E, Mesrati F, Carlet J, Raphaël JC, Outin H, Bastuji-Garin S, Groupe de Réflexion et d'Etude des Neuromyopathies en Réanimation. Paresis acquired in the intensive care unit: a prospective multicenter study.J Am Med Assoc 288: 2859–2867, 2002. [DOI] [PubMed] [Google Scholar]
- 22.Dogan MD, Ataoglu H, Akarsu ES. Effects of different serotypes of Escherichia coli lipopolysaccharides on body temperature in rats. Life Sci 67: 2319–2329, 2000. [DOI] [PubMed] [Google Scholar]
- 23.Duchen MR. Mitochondria in health and disease: perspectives on a new mitochondrial biology. Mol Aspects Med 25: 365–451, 2004. [DOI] [PubMed] [Google Scholar]
- 24.Duchen MR, Surin A, Jacobson J. Imaging mitochondrial function in intact cells. Methods Enzymol 361: 353–389, 2003. [DOI] [PubMed] [Google Scholar]
- 25.Echtay KS, Roussel D, St-Pierre J, Jekabsons MB, Cadenas S, Stuart JA, Harper JA, Roebuck SJ, Morrison A, Pickering S, Clapham JC, Brand MD. Superoxide activates mitochondrial uncoupling proteins. Nature 415: 96–99, 2002. [DOI] [PubMed] [Google Scholar]
- 26.Fredriksson K, Hammarqvist F, Strigård K, Hultenby K, Ljungqvist O, Wernerman J, Rooyackers O. Derangements in mitochondrial metabolism in intercostal and leg muscle of critically ill patients with sepsis-induced multiple organ failure. Am J Physiol Endocrinol Metab 291: E1044–E1050, 2006. [DOI] [PubMed] [Google Scholar]
- 27.Frost MT, Wang Q, Moncada S, Singer M. Hypoxia accelerates nitric oxide-dependent inhibition of mitochondrial complex I in activated macrophages. Am J Physiol Regul Integr Comp Physiol 288: R394–R400, 2005. [DOI] [PubMed] [Google Scholar]
- 28.Garedew A, Henderson SO, Moncada S. Activated macrophages utilize glycolytic ATP to maintain mitochondrial membrane potential and prevent apoptotic cell death. Cell Death Differ 17: 1540–1550, 2010. [DOI] [PubMed] [Google Scholar]
- 29.Gong DW, Monemdjou S, Gavrilova O, Leon LR, Marcus-Samuels B, Chou CJ, Everett C, Kozak LP, Li C, Deng C, Harper ME, Reitman ML. Lack of obesity and normal response to fasting and thyroid hormone in mice lacking uncoupling protein-3. J Biol Chem 275: 16251–16257, 2000. [DOI] [PubMed] [Google Scholar]
- 30.Griffiths RD, Hall JB. Intensive care unit-acquired weakness. Crit Care Med 38: 779–787, 2010. [DOI] [PubMed] [Google Scholar]
- 31.Hackam DG, Redelmeier DA. Translation of research evidence from animals to humans. J Am Med Assoc 296: 1731–1732, 2006. [DOI] [PubMed] [Google Scholar]
- 32.Haden DW, Suliman HB, Carraway MS, Welty-Wolf KE, Ali AS, Shitara H, Yonekawa H, Piantadosi CA. Mitochondrial biogenesis restores oxidative metabolism during Staphylococcus aureus sepsis. Am J Respir Crit Care Med 176: 768–777, 2007. [DOI] [PMC free article] [PubMed] [Google Scholar]
- 33.Hermans G, De Jonghe B, Bruyninckx F, Van den Berghe G. Clinical review: Critical illness polyneuropathy and myopathy (Abstract). Crit Care 12: 238, 2008. [DOI] [PMC free article] [PubMed] [Google Scholar]
- 34.Iwashyna TJ, Ely EW, Smith DM, Langa KM. Long-term cognitive impairment and functional disability among survivors of severe sepsis. J Am Med Assoc 304: 1787–1794, 2010. [DOI] [PMC free article] [PubMed] [Google Scholar]
- 35.Jastroch M, Divakaruni AS, Mookerjee S, Treberg JR, Brand MD. Mitochondrial proton and electron leaks. Essays Biochem 47: 53–67, 2010. [DOI] [PMC free article] [PubMed] [Google Scholar]
- 36.Jéquier E, Acheson K, Schutz Y. Assessment of energy expenditure and fuel utilization in man. Ann Rev Nutr 7: 187–208, 1987. [DOI] [PubMed] [Google Scholar]
- 37.Kantrow SP, Taylor DE, Carraway MS, Piantadosi CA. Oxidative metabolism in rat hepatocytes and mitochondria during sepsis. Arch Biochem Biophys 345: 278–288, 1997. [DOI] [PubMed] [Google Scholar]
- 38.Kress JP, Hall JB. ICU-acquired weakness and recovery from critical illness. N Engl J Med 370: 1626–1635, 2014. [DOI] [PubMed] [Google Scholar]
- 39.Lännergren J, Westerblad H. Force decline due to fatigue and intracellular acidification in isolated fibres from mouse skeletal muscle. J Physiol 434: 307–322, 1991. [DOI] [PMC free article] [PubMed] [Google Scholar]
- 40.Latronico N, Bolton CF. Critical illness polyneuropathy and myopathy: a major cause of muscle weakness and paralysis. Lancet Neurol 10: 931–941, 2011. [DOI] [PubMed] [Google Scholar]
- 41.Lionetti L, Iossa S, Brand MD, Liverini G. Relationship between membrane potential and respiration rate in isolated liver mitochondria from rats fed an energy dense diet. Mol Cell Biochem 158: 133–138, 1996. [DOI] [PubMed] [Google Scholar]
- 42.Mailloux RJ, Harper ME. Mitochondrial proticity and ROS signaling: lessons from the uncoupling proteins. Trends Endocrinol Metab 23: 451–458, 2012. [DOI] [PubMed] [Google Scholar]
- 43.Mela L, Bacalzo LV, Miller LD. Defective oxidative metabolism of rat liver mitochondria in hemorrhagic and endotoxin shock. Am J Physiol 220: 571–577, 1971. [DOI] [PubMed] [Google Scholar]
- 44.Nicholls DG. A history of UCP1. Biochem Soc Trans 29: 751–755, 2001. [DOI] [PubMed] [Google Scholar]
- 45.Nicholls DG, Ferguson SJ. Bioenergetics (3rd ed). Orlando, FL: Academic, 2002. [Google Scholar]
- 46.Osuchowski MF, Remick DG, Lederer JA, Lang CH, Aasen AO, Aibiki M, Azevedo LC, Bahrami S, Boros M, Cooney R, Cuzzocrea S, Jiang Y, Junger WG, Hirasawa H, Hotchkiss RS, Li XA, Radermacher P, Redl H, Salomao R, Soebandrio A, Thiemermann C, Vincent JL, Ward P, Yao YM, Yu HP, Zingarelli B, Chaudry IH. Abandon the mouse research ship? Not just yet! Shock 41: 463–475, 2014. [DOI] [PMC free article] [PubMed] [Google Scholar]
- 47.Parker N, Affourtit C, Vidal-Puig A, Brand MD. Energization-dependent endogenous activation of proton conductance in skeletal muscle mitochondria. Biochem J 412: 131–139, 2008. [DOI] [PMC free article] [PubMed] [Google Scholar]
- 48.Parker N, Vidal-Puig A, Brand MD. Stimulation of mitochondrial proton conductance by hydroxynonenal requires a high membrane potential. Biosci Rep 28: 83–88, 2008. [DOI] [PMC free article] [PubMed] [Google Scholar]
- 49.Peyssonnaux C, Cejudo-Martin P, Doedens A, Zinkernagel AS, Johnson RS, Nizet V. Cutting edge: essential role of hypoxia inducible factor-1alpha in development of lipopolysaccharide-induced sepsis. J Immunol 178: 7516–7519, 2007. [DOI] [PubMed] [Google Scholar]
- 50.Puthucheary Z, Harridge S, Hart N. Skeletal muscle dysfunction in critical care: wasting, weakness, and rehabilitation strategies. Crit Care Med 38: S676–S682, 2010. [DOI] [PubMed] [Google Scholar]
- 51.Rasmussen HN, Rasmussen UF. Small scale preparation of skeletal muscle mitochondria, criteria of integrity, and assays with reference to tissue function. Mol Cell Biochem 174: 55–60, 1997. [PubMed] [Google Scholar]
- 52.Robichaud S, Lalu M, Udenberg T, Schulz R, Sawicki G. Proteomics analysis of changes in myocardial proteins during endotoxemia. J Proteomics 72: 648–655, 2009. [DOI] [PubMed] [Google Scholar]
- 53.Rolfe DF, Brown GC. Cellular energy utilization and molecular origin of standard metabolic rate in mammals. Physiol Rev 77: 731–758, 1997. [DOI] [PubMed] [Google Scholar]
- 54.Rudaya AY, Steiner AA, Robbins JR, Dragic AS, Romanovsky AA. Thermoregulatory responses to lipopolysaccharide in the mouse: Dependence on the dose and ambient temperature. Am J Physiol Regul Integr Comp Physiol 289: R1244–R1252, 2005. [DOI] [PubMed] [Google Scholar]
- 55.Růzicka M, Skobisová E, Dlasková A, Santorová J, Smolková K, Spacek T, Zácková M, Modrianský M, Jezek P. Recruitment of mitochondrial uncoupling protein UCP2 after lipopolysaccharide induction. Int J Biochem Cell Biol 37: 809–821, 2005. [DOI] [PubMed] [Google Scholar]
- 56.Seok J, Warren HS, Cuenca AG, Mindrinos MN, Baker HV, Xu W, Richards DR, McDonald-Smith GP, Gao H, Hennessy L, Finnerty CC, López CM, Honari S, Moore EE, Minei JP, Cuschieri J, Bankey PE, Johnson JL, Sperry J, Nathens AB, Billiar TR, West MA, Jeschke MG, Klein MB, Gamelli RL, Gibran NS, Brownstein BH, Miller-Graziano C, Calvano SE, Mason PH, Cobb JP, Rahme LG, Lowry SF, Maier RV, Moldawer LL, Herndon DN, Davis RW, Xiao W, Tompkins RG, Inflammation and Host Response to Injury Large Scale Collaborative Research Program. Genomic responses in mouse models poorly mimic human inflammatory diseases. Proc Natl Acad Sci USA 110: 3507–3512, 2013. [DOI] [PMC free article] [PubMed] [Google Scholar]
- 57.Srere PA. The citrate enzymes: their structures, mechanisms, and biological functions. Curr Topics Cell Reg 5: 229–283, 1972. [DOI] [PubMed] [Google Scholar]
- 58.St-Pierre J, Buckingham JA, Roebuck SJ, Brand MD. Topology of superoxide production from different sites in the mitochondrial electron transport chain. J Biol Chem 277: 44784–44790, 2002. [DOI] [PubMed] [Google Scholar]
- 59.Stevens ED, Faulkner JA. The capacity of mdx mouse diaphragm muscle to do oscillatory work. J Physiol 522: 457–466, 2000. [DOI] [PMC free article] [PubMed] [Google Scholar]
- 60.Sun X, Wray C, Tian X, Hasselgren PO, Lu J. Expression of uncoupling protein 3 is upregulated in skeletal muscle during sepsis. Am J Physiol Endocrinol Metab 285: E512–E520, 2003. [DOI] [PubMed] [Google Scholar]
- 61.Supinski GS, Callahan LA. Free radical-mediated skeletal muscle dysfunction in inflammatory conditions. J Appl Physiol 102: 2056–2063, 2007. [DOI] [PubMed] [Google Scholar]
- 62.Tateda K, Matsumoto T, Miyazaki S, Yamaguchi K. Lipopolysaccharide-induced lethality and cytokine production in aged mice. Infect Immun 64: 769–774, 1996. [DOI] [PMC free article] [PubMed] [Google Scholar]
- 63.Turnbull IR, Wlzorek JJ, Osborne D, Hotchkiss RS, Coopersmith CM, Buchman TG. Effects of age on mortality and antibiotic efficacy in cecal ligation and puncture. Shock 19: 310–313, 2003. [DOI] [PubMed] [Google Scholar]
- 64.Vidal-Puig AJ, Grujic D, Zhang CY, Hagen T, Boss O, Ido Y, Szczepanik A, Wade J, Mootha V, Cortright R, Muoio DM, Lowell BB. Energy metabolism in uncoupling protein 3 gene knockout mice. J Biol Chem 275: 16258–16266, 2000. [DOI] [PubMed] [Google Scholar]
- 65.Woledge RC, Curtin NA. The efficiency of energy conversion by swimming muscles of fish. Adv Exp Med Biol 332: 735–747, 1993. [DOI] [PubMed] [Google Scholar]
- 66.Yu XX, Barger JL, Boyer BB, Brand MD, Pan G, Adams SH. Impact of endotoxin on UCP homolog mRNA abundance, thermoregulation, and mitochondrial proton leak kinetics. Am J Physiol Endocrinol Metab 279: E433–E446, 2000. [DOI] [PubMed] [Google Scholar]
- 67.Zolfaghari PS, Pinto BB, Dyson A, Singer M. The metabolic phenotype of rodent sepsis: cause for concern? Intensive Care Med Exp In press. [DOI] [PMC free article] [PubMed] [Google Scholar]