Abstract
H-Ras must adhere to the plasma membrane to be functional. This is accomplished by posttranslational modifications, including palmitoylation, a reversible process whereby H-Ras traffics between the plasma membrane and the Golgi complex. At the plasma membrane, H-Ras has been proposed to occupy distinct sublocations, depending on its activation status: lipid rafts/detergent-resistant membrane fractions when bound to GDP, diffusing to disordered membrane/soluble fractions in response to GTP loading. Herein, we demonstrate that H-Ras sublocalization is dictated by its degree of palmitoylation in a cell type-specific manner. Whereas H-Ras localizes to detergent-resistant membrane fractions in cells with low palmitoylation activity, it locates to soluble membrane fractions in lineages where it is highly palmitoylated. Interestingly, in both cases GTP loading results in H-Ras diffusing away from its original sublocalization. Moreover, tilting the equilibrium between palmitoylation and depalmitoylation processes can substantially alter H-Ras segregation and, subsequently, its biochemical and biological functions. Thus, the palmitoylation/depalmitoylation balance not only regulates H-Ras cycling between endomembranes and the plasma membrane but also serves as a key orchestrator of H-Ras lateral diffusion between different types of plasma membrane and thereby of H-Ras signaling.
INTRODUCTION
Members of the Ras family of GTPases, H-Ras, N-Ras, and K-Ras, act as molecular switches by cycling between an inactive, GDP-bound state and an active, GTP-bound state, thereby functioning as key regulatory nodes in multiple cellular functions, including proliferation, differentiation, and survival (1). It is well documented that Ras proteins must be attached to the cytoplasmic leaflet of the plasma membrane (PM) to be functional. This is accomplished by posttranslational modifications at the C terminus, which harbors the CAAX box (where C is cysteine, A is an aliphatic amino acid, and X is serine or methionine). Ras is synthesized as a hydrophilic protein and is rapidly farnesylated at Cys186 within the CAAX box. This forces nascent Ras to transiently associate with the endoplasmic reticulum (ER). At this organelle, the AAX sequence is proteolyzed and the newly C-terminal Cys is carboxymethylated. These modifications enhance the association of Ras with endomembranes, yet they are not sufficient to allow stable binding to the PM, a process that requires a second anchor. In the case of K-Ras (4B), this is provided by a polybasic sequence that enables an electrostatic interaction with the negatively charged PM phospholipids. For the other isoforms, it is accomplished by acylation: the addition of a palmitoyl group to Cys181 in N-Ras and Cys181 and Cys184 in H-Ras (for extensive reviews, see references 2 and 3).
In mammals, Ras palmitoylation is primarily undertaken by the palmitoyl acyltransferase (PAT) DHHC9/GCP16, a resident at the Golgi complex (GC) (4, 5), though the possibility that some of the other ∼20 members of the DHHC family can perform this task at other sublocations cannot be discarded (6, 7). Palmitoylation induces trapping of H-Ras and N-Ras in the GC before they traffic, via vesicular transport, to the PM (8). Palmitoylation is essential for the association of H-Ras and N-Ras with the PM, and unpalmitoylatable mutants cannot be transported to the PM and are retained in the GC (9, 10).
Palmitoyl lipids are linked through a labile thioester bond, making palmitoylation a reversible process. Once at the PM, palmitoylated H-Ras and N-Ras are depalmitoylated therein and traffic back to the GC via a nonvesicular route. A new palmitoylation process needs to take place to regain access to the PM (11, 12). Measurements of the half-life of palmitoylated Ras isoforms vary significantly (13–16). N-Ras, which requires a single depalmitoylation, cycles faster and is more abundant in the GC than H-Ras, which must undergo double depalmitoylation (10). The removal of palmitoyl groups is mediated by acyl thioesterases (ATs). The identity of the AT responsible for Ras depalmitoylation in vivo remains uncertain. Acyl protein thioesterase 1 (APT-1), a soluble cytosolic AT, has been shown to have activity toward H-Ras, at least in vitro (17, 18). Moreover, treatment with palmostatin B, an inhibitor of APT-1, reduces H- and N-Ras levels at the GC, fostering their accumulation at the PM (19).
At the PM, Ras isoforms occupy different microlocations with distinct biochemical compositions and physical-chemical properties (20). Seminal studies by Hancock and colleagues have established that K-Ras is preferentially found in the disordered membrane (DM), whereas H-Ras is present at lipid rafts (LRs) (21–23). Likewise, N-Ras is detected mainly in LRs (24, 25). At these different microenvironments, Ras proteins are subject to the site-specific action of regulatory proteins (26); they differentially engage effector molecules (27, 28) and switch on distinct transcriptional programs (29). Thus, space can ultimately shape Ras functions by introducing variability into its signals, depending on the abundance, availability, and functionality of regulators and effectors at the different sites where Ras resides.
Moreover, H-Ras partitioning between LRs and the DM is dependent on its activation status. In BHK cells, inactive, GDP-loaded H-Ras resides mainly at LRs, but once it becomes activated upon GTP binding, it undergoes lateral diffusion to DM microdomains (21). However, it is still not clear whether these observations are applicable to other cell types. Since the spatial segregation of Ras has important functional implications in both physiological and pathological contexts (26), it is adamantly important that this issue is settled. In this study, we report that the H-Ras distribution in PM microdomains varies depending on the cell type. Importantly, we demonstrate that H-Ras PM sublocalization is dictated by the balance between palmitoylation and depalmitoylation processes. We show that by tilting such an equilibrium, H-Ras PM sublocalization and, subsequently, its biochemical and biological functions can be substantially altered. Thus, our results unveil the palmitoylation/depalmitoylation balance to be a key orchestrator of H-Ras distribution and signaling.
MATERIALS AND METHODS
Plasmids and siRNAs.
Plasmids carrying the H-Ras wild type (wt) and the H-RasV12 and H-Ras C181/184S mutants have been described previously (27). The H-Ras C184S mutant was generated by PCR-directed mutagenesis and was cloned in pCEFL FLAG. APT-1 was amplified by reverse transcription-PCR and subcloned into pCEFL FLAG. pcDNA3.1 DHHC9 myc-His and pcDNA3.1 FLAG GCP16 were provided by M. Linder. wt, C184S mutant, and C181/184S mutant H-Ras proteins tethered to LCK and CD8− were cloned into pCEFL FLAG ZEO. GFP–H-RasCT was constructed by fusing enhanced green fluorescent protein (GFP) to the 25 C-terminal amino acids (hypervariable region [HVR] plus the CAAX box) of H-Ras. Fluorescent proteins used as the donor (pmCerulean-C1) or acceptor (pmVenus-C1) were gifts from C. Enrich. Cerulean–H-Ras wt, Venus-LCK, and Venus-CD8 were generated by PCR. Small interfering RNAs (siRNAs) against DHHC9 and GCP16 were from Santa Cruz.
Cell culture.
COS-7, HeLa, HEK293T, MCA3D, PDV, CARCR, CARC, T24, BHK, SW480, and MCF7 cells and mouse embryo fibroblasts (MEFs) were grown in Dulbecco's minimum essential medium (DMEM) supplemented with 10% fetal calf serum (FCS). MCA3D and PDV cells were grown in Ham's medium with 10% FCS. HT29 and T24 cells were grown in McCoy's 5A medium (Life Technologies) with 10% FCS, and HEL cells were grown in RPMI–10% FCS. NIH 3T3 cells were grown in DMEM–10% calf serum. Where applicable, stable cell lines were generated by transfection with Lipofectamine (Invitrogen) following the manufacturer's instructions and selected with 750 mg/ml of G418 or 300 μg/ml zeocin (Invitrogen). Ras-less MEFs were generated by addition of 4-hydroxy-tamoxifen (4-OHT) as described previously (30). For biochemical analyses, subconfluent cells were transfected with Lipofectamine and Lipofectamine 2000 (Invitrogen). For immunofluorescence studies, cells were transfected with the FuGENE transfection reagent (Roche). Before stimulation, cells were starved for 18 h. Palmostatin B was from Calbiochem.
Antibodies.
Mouse monoclonal antihemagglutinin (anti-HA) and rabbit polyclonal anti-H-Ras, anti-K-Ras 2B, anti-N-Ras, anti-pan-Ras, anti-ribosomal protein S6 kinase 1 (anti-RSK-1), anti-extracellular signal-regulated kinase 2 (anti-ERK2), and anti-FYN antibodies were from Santa Cruz Biotechnology. Mouse monoclonal anti-FLAG antibody was from Sigma-Aldrich. Rabbit polyclonal anti-phosphorylated RSK-1 (anti-p-RSK-1) antibody was from Cell Signaling. Rabbit polyclonal anticaveolin and rat monoclonal anti-5′-nucleotidase were from BD Biosciences. Mouse monoclonal anti-transferrin receptor (anti-TFR) antibody was from Zymed Laboratories. Mouse monoclonal anti-Na-K-ATPase antibody was from Upstate Biotechnology Inc. Rabbit polyclonal anticalreticulin antibody was from Calbiochem. Mouse monoclonal antigiantin antibody was from Alexis.
Immunoblotting.
Samples were fractionated by sodium dodecyl sulfate (SDS)-polyacrylamide gel electrophoresis (PAGE) and transferred onto nitrocellulose filters as described previously (31). Immunocomplexes were visualized by enhanced chemiluminescence detection (GE Healthcare, Little Chalfont, Buckinghamshire, United Kingdom) by using horseradish peroxidase-conjugated secondary antibodies (Bio-Rad Laboratories, Hercules, CA).
Confocal immunofluorescence.
Cultured cells were washed twice in phosphate-buffered saline (PBS), fixed with ice-cold 3.7% formaldehyde in PBS for 10 min, and washed with PBS. They were rinsed in PBS–0.05% Tween 20 (Sigma-Aldrich), incubated for 2 h with the primary antibodies or cholera toxin (GM1)-fluorescein isothiocyanate (FITC) (Sigma-Aldrich), washed, and incubated for 1 h with the appropriate secondary antibodies conjugated to FITC or Texas Red. Coverslips were mounted in Vectashield mounting medium (Vector Laboratories, Burlingame, CA) and sealed. Confocal microscopy was performed with an LSM510 microscope (Carl Zeiss, Thornwood, NY) by using excitation wavelengths of 488 nm (for FITC) and 543 nm (for Texas Red).
Sucrose gradients.
Cells were collected and treated as described previously (27). Briefly, cells were resuspended in 25 mM Tris, pH 7.4, 150 mM NaCl, 5 mM EDTA, and 0.25% Triton X-100 plus protease inhibitor cocktail (1 μg/ml). Lysates were set at a sucrose concentration of 45%. Layers of 3.4 ml of 35% sucrose and 1 ml of 16% sucrose were sequentially overlaid, and the layers were centrifuged for 18 h at 41,000 rpm (MLS-50 rotor; Beckman). Twelve 0.4-ml fractions were collected and resuspended directly in SDS-PAGE sample buffer for analysis by immunoblotting. Nuclei and heavy endomembranes, such as those of the ER and the Golgi complex, remain in the uncollected pellet. Membrane solubilization in sodium carbonate and subsequent fractionations were performed exactly as described previously (21). For detergent solubilization of cells at 37°C, cells were resuspended in 0.45 ml of ice-cold 1× lysis buffer (20 mM HEPES, pH 7.6, 150 mM NaCl, 1 mM EGTA, 50 mM sodium fluoride, 1 mM sodium orthovanadate, 20 μM phenylarsine oxide, 1 mM phenylmethylsulfonyl fluoride, 10 mM iodoacetamide, and a cocktail of small-peptide protease inhibitors at 1 μg/ml each) without detergent to disrupt the cells (32), quickly frozen on dry ice, and thawed on ice. Broken cells were homogenized by shearing through a 25-gauge needle 10 times. The particulate suspension was preincubated for 4 min at 37°C with 50 μl of Brij 98 (Sigma Chemical Co.) stock solution in 20 mM HEPES, pH 7.4. The lysate was quick-frozen on dry ice and kept at −80°C until use.
FRET.
Cells were transiently cotransfected with Cerulean–H-Ras wt and LCK-Venus or Venus-CD8. Fluorescence resonance energy transfer (FRET) was performed using cyan fluorescent protein (CFP) as the donor fluorochrome paired with Venus fluorescent protein (VFP) as the acceptor fluorochrome. Images from fixed cells were acquired on a confocal microscope (Leica TCS SP5) with a 63× (numerical aperture, 1.4) oil immersion objective at room temperature. An argon laser line of 458 nm was used to excite the CFP (photomultiplier tube window, 465 to 500 nm), and a 514-nm line (5% laser intensity for acquisition and 50% for every five frames for photobleaching) was used to excite the VFP (photomultiplier tube window, 525 to 650 nm). FRET was performed using the acceptor photobleaching method (33), in which FRET efficiency is calculated as the relative increase in total intensity as a result of the reduction or elimination of energy transfer when the acceptor is photobleached. Specifically, the percentage of donor total intensity (area multiplied by mean intensity) that increases its fluorescence after acceptor photobleaching was quantified in the plasma membrane using the following equation: FRET = [(Cafter – Cbefore)/Cafter] × 100, in which Cbefore and Cafter are the total fluorescence intensity of the CFP channel before and after photobleaching, respectively. As an internal negative control, an unbleached region in the same cell was measured. FRET efficiency is expressed as the mean ± standard deviation for >6 cells for each group. Image analysis was performed using Leica confocal image-processing software (FRET Wizard) and ImageJ software. Maximum and minimum FRET efficiencies were those obtained by the control constructs C5V and C5E (34).
Radiolabeling and immunoprecipitation.
Palmitate incorporation was measured by incubating subconfluent cells with 0.5 to 0.7 mCi/ml [3H]palmitate (PerkinElmer Life Sciences) in medium containing nonessential amino acids (NEA), 20 mM HEPES (pH 7.2), and 10% calf serum for 4 h. Labeling was stopped by rinsing the cells with Tris-buffered saline and lysing the cells in radioimmunoprecipitation assay (RIPA) buffer (20 mM MOPS [morpholinepropanesulfonic acid], pH 7, 150 mM NaCl, 1 mM EDTA, 1% NP-40, 1% sodium deoxycholate, 0.01% SDS). Lysates were cleared by centrifugation, 0.1 volume was separated to be loaded as total lysate, and the rest was incubated with anti-H-Ras antibody (Santa Cruz) by rocking at 4°C for 1 h. Protein G-Sepharose was added, and the mixture was agitated at 4°C for 2 h. Beads were collected and washed three times with RIPA buffer. The pellets were resuspended in 5× Laemmli buffer, incubated for 3 min at 80°C, and fractionated by SDS-PAGE. The gels were treated with dimethyl sulfoxide (DMSO)-diphenyloxazole (DPO) solution and fluorographed at −80°C using preflashed film. Typical exposure times were 3 to 4 months. Alternatively, to measure palmitoylation, the immunoprecipitated pellets were resuspended in 50 μl RIPA buffer and loaded on a glass filter mat (catalog number 1450-521; printed filter mat b; PerkinElmer) and quantitated by scintillation counting.
Ras-GTP loading assays.
Ras-GTP loading assays were performed as described previously (35). H-Ras–GTP was affinity sequestered by using glutathione transferase (GST)-Raf–Ras binding domain (RBD). Immunoblots were performed with anti-HA antibody and quantified by densitometry using ImageJ software. Activation levels were related to total protein levels, as determined by immunoblotting for anti-HA in the corresponding total lysates.
Measurement of proliferation and survival rates.
Cells were plated at a low density (30,000 cells per plate) and grown under conditions with 1% serum. Cells were detached and scored by standard cell counting techniques at the intervals indicated below as described previously (36).
G418-resistant colony assays.
MEFs were transfected with the Lipofectamine Plus reagent (Invitrogen) and grown in the presence of 300 μg/ml of zeocin with or without 4-OHT. After 10 to 15 days, the plates were fixed and stained, and colonies with a diameter of greater than 2 mm were scored.
Statistical analyses.
All statistical data were analyzed and compared for statistically significant differences by Student's t test (GraphPad Software).
RESULTS
H-Ras sublocalization in PM microdomains is cell type specific.
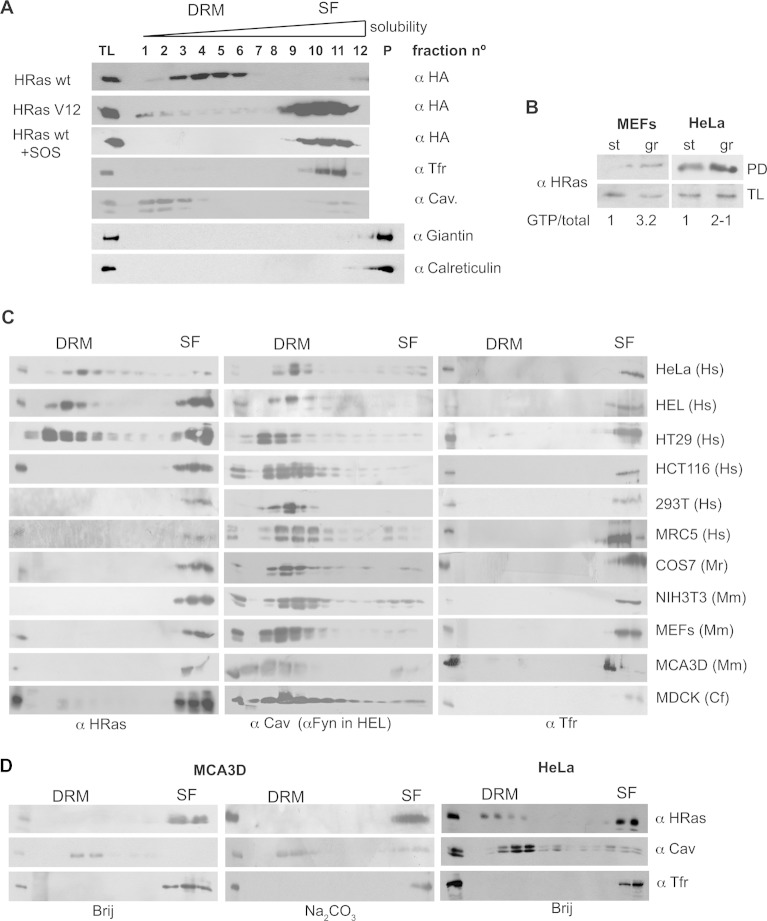
Previous studies in BHK cells have shown that GDP-loaded H-Ras resides in LRs, whereas the GTP-loaded H-Ras wt and constitutively active H-RasV12 migrate to DM microdomains (21), as determined by flotation in detergent-solubilized membranes, where LRs correspond to the detergent-resistant membrane fractions (DRMs) and DM corresponds to the detergent-soluble fraction (SF). We ascertained these results in the same cells and using the same methodology, which precludes the possibility of contamination of the PM fractions by endomembranes (Fig. 1A), verifying the presence of ectopic H-Ras wt in DRMs and of H-RasV12 in SFs, as was the case for H-Ras wt when cotransfected with its exchange factor SOS1 (Fig. 1A).
FIG 1.
H-Ras segregation in PM microdomains is cell type specific. (A) PM sublocalization of ectopic forms of H-Ras in BHK cells. Cells were transfected with the indicated HA-tagged Ras constructs (1 μg). Membranes from serum-starved cells were solubilized and fractionated as described in Materials and Methods. Immunoblotting with anti-caveolin-1 (α Cav.) identifies DRMs, and immunoblotting with anti-TFR identifies SFs. Immunoblotting for the GC marker giantin and the ER marker calreticulin ascertained the absence of contamination by endomembranes. A total lysate (TL) was run alongside the fractions. P, pellet. (B) Levels of H-Ras GTP loading under starvation and growing conditions, determined by Raf RBD pulldown (PD). The ratios of H-Ras–GTP/total H-Ras relative to the levels found in starved cells are shown. (C) PM distribution of endogenous H-Ras in different cell lines. Hs, Homo sapiens; Mr, rhesus macaque (Macaca mulatta) Mm, Mus musculus; Cf, Canis familiaris. (D) The H-Ras PM distribution is not affected by alternative processing methods: by solubilization at 37°C using Brij or by the detergent-free Na2CO3 method.
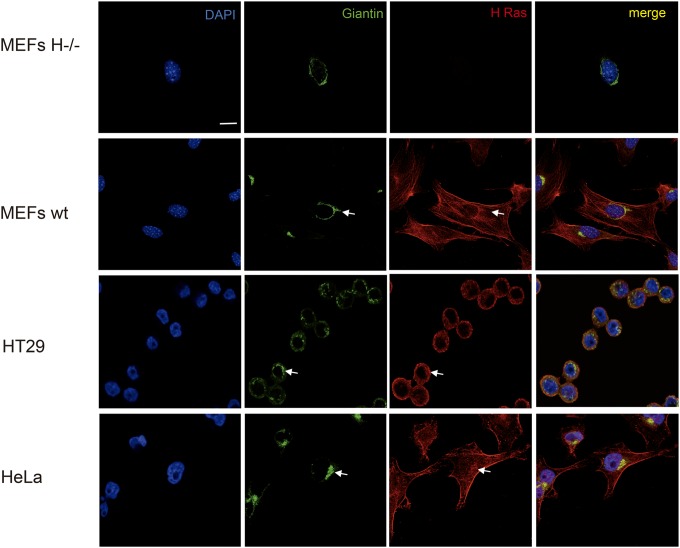
It was our interest to determine whether this model applies independently of the cell type under test. To this end, we analyzed a broad panel of cell lines derived from different organisms and tissues. Using an antibody highly specific for H-Ras (27), we evaluated the distribution of the endogenous isoform under serum starvation conditions, in which the amount of GTP-loaded protein was reduced (Fig. 1B). By PM solubilization in 0.25% Triton X-100, we detected a great variability in the H-Ras distribution. In HeLa cells, H-Ras was found mainly in DRMs, in agreement with the findings of previous studies (21). On the contrary, in other cell types, like HEL and HT29 cells, H-Ras was scattered between DRMs and SFs. Furthermore, in the majority of the cell lines tested, H-Ras appeared exclusively in SFs (Fig. 1C). The method utilized for PM solubilization did not affect the outcome. Other techniques, like detergent-free extraction using Na2CO3 or solubilization at physiological temperature using Brij, yielded similar results (Fig. 1D). Noticeably, the pattern of H-Ras distribution at the PM had no relationship with its presence or absence at endomembranes, as illustrated by HeLa cells, MEFs, and HT29 cells, all of which exhibited substantial amounts of H-Ras at endomembranes, particularly at the GC (Fig. 2).
FIG 2.
Endogenous H-Ras subcellular localization. Immunofluorescence shows endogenous H-Ras subcellular localization in the indicated cell lines. DAPI (4′,6-diamidino-2-phenylindole) staining shows nuclei, and GC is revealed using antigiantin antibodies. Confocal sections at the level of the nuclei are shown. Arrows show the presence of H-Ras at the GC. Bar, 10 μm.
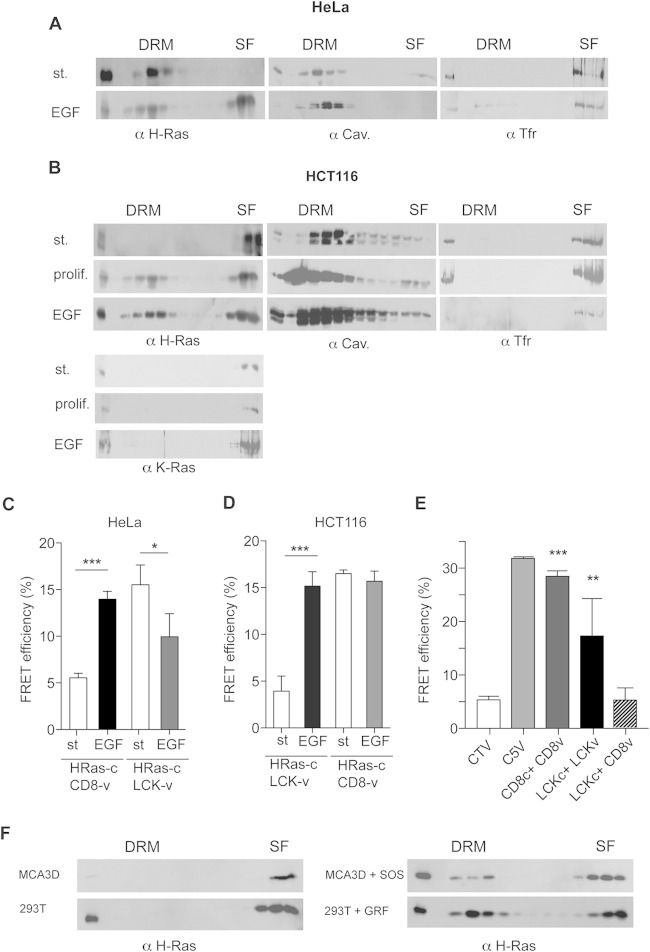
Next, we examined how agonist stimulation affected the H-Ras distribution in cell lines representative of the different H-Ras sublocalization patterns. In HeLa cells, epidermal growth factor (EGF) treatment triggered H-Ras migration to SFs, in agreement with previous reports (21) (Fig. 3A). On the contrary, in HCT116 cells, H-Ras underwent the reverse displacement, from SFs to DRMs, both when exponentially growing and when treated with EGF. As a control, EGF stimulation did not affect K-Ras localization at SFs (Fig. 3B). These findings were ascertained further by fluorescence resonance energy transfer (FRET), in which HeLa and HCT116 cells were cotransfected with H-Ras fused to Cerulean fluorescent protein plus the Venus fluorescent protein fused either to the SF marker CD8 or to the LCK myristoylation signal as a DRM tether (27). Upon EGF stimulation, the FRET efficiency between H-Ras and the SF marker in HeLa cells was significantly increased, while the FRET efficiency with the DRM-specific probe dropped, indicating H-Ras transfer from DRMs to SFs (Fig. 3C). In HCT116 cells, EGF evoked a pronounced increase in FRET efficiency at DRMs, but this was not accompanied by quenched emission at SFs (Fig. 3D). It is possible that in this cell line the H-Ras concentration at SFs is saturating so that the loss of a fraction goes undetected by FRET. The sublocalization specificity for the different FRET probes was ascertained using pertinent controls (Fig. 3E). The displacement of H-Ras from SFs to DRMs following activation was also evident in other cell lines and with different activating stimuli. For example, in MCA3D cells, expression of the exchange factor SOS1 forced H-Ras to shift toward DRMs. Similar results were obtained in HEK293T cells transfected with RasGRF1 (Fig. 3E).
FIG 3.
H-Ras–GDP and H-Ras–GTP occupy different PM microdomains. (A) Endogenous H-Ras localization at DRMs and SFs in serum-starved or EGF-stimulated (st.; 100 ng/ml, 10 min) HeLa cells. (B) As described in the legend to panel A, the distribution of endogenous H-Ras and K-Ras was analyzed in HCT116 cells, including proliferating cells (prolif.). (C and D) Effects of EGF on H-Ras sublocalization in HeLa (C) and HCT116 (D) cells analyzed by FRET. H-Ras–Cerulean was tested against the probes specific for DRMs (LCK-Venus [LCK-v]) and SFs (Venus-CD8 [CD8-v]). (E) Controls for the site-specific FRET probes CD8 and LCK. Cells transfected with control plasmids show minimum (CTV) and maximum (C5V) FRET efficiencies. Results show the mean ± SEM from at least five experiments. **, P < 0.01 with 95% confidence intervals; ***, P < 0.001 with 95% confidence intervals. LCKc, LCK-Cerulean. (F) Endogenous H-Ras distribution in MCA3D and HEK293T cells stably expressing the exchange factors SOS1 (SOS) and RasGRF1 (GRF). Cells were serum starved overnight before processing.
To further substantiate the H-Ras drift from SFs to DRMs in response to GTP loading, we utilized a series of isogenic cell lines that differed in their H-Ras genotypes: MCA3D is a murine cell line derived from skin epithelium that contains H-Ras wt. The PDV cell line has the same origin as the MCA3D cell line, but in response to 7,12-dimethylbenz[a]anthracene and 12-O-tetradecanoylphorbol-13-acetate treatment, it acquired a mutant H-RasL61 allele and the wt allele was amplified 2-fold. Likewise, CARCR cells harbor one mutant L61 allele plus a wt allele. Finally, in CARC cells, both alleles contain L61 mutations (37). The status of H-Ras in these cell lines was verified by protein mobility shift in high-concentration SDS-polyacrylamide gels and by H-Ras–GTP-pulldown assays using Raf-RBD (Fig. 4A). We found that the presence of H-Ras in DRMs increased concomitantly with the dosage of GTP-bound H-RasL61 (Fig. 4B), thereby corroborating our previous findings using agonist/guanine nucleotide exchange factor (GEF) stimulation. Overall, these observations indicate that H-Ras PM sublocalization varies substantially depending on the cell type. Importantly, we demonstrate that H-Ras–GDP and H-Ras–GTP segregate in different PM sublocations, regardless of the sublocation originally occupied by the inactive, GDP-loaded H-Ras proteins.
FIG 4.
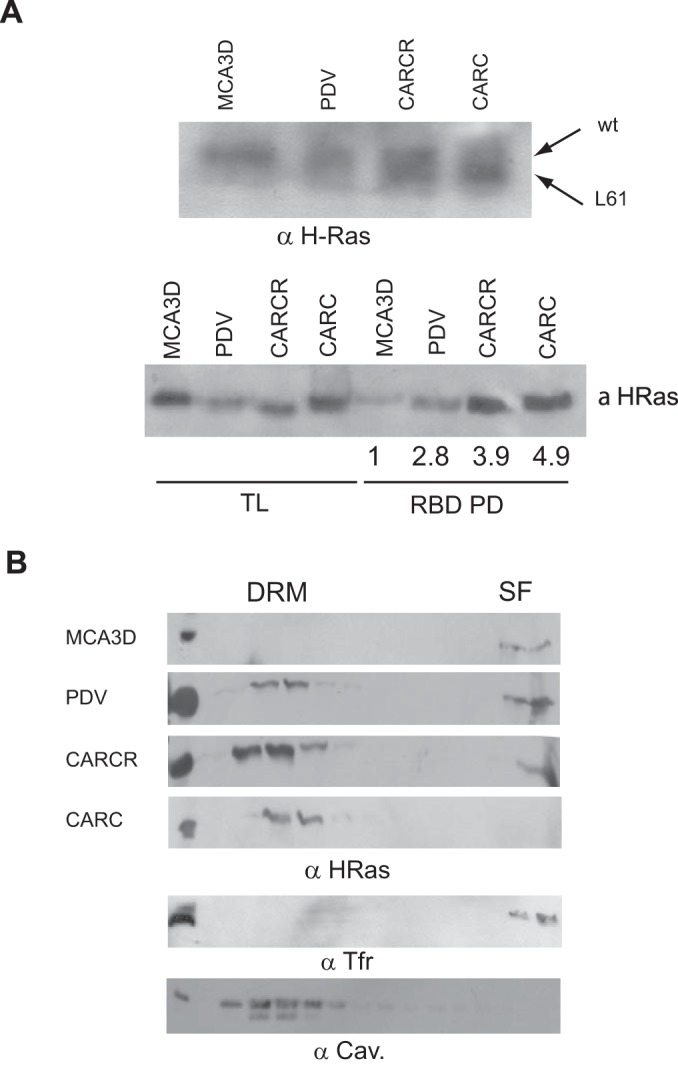
Differential PM segregation of H-Ras oncogenic forms. (A) Presence of oncogenic and wt H-Ras forms in epithelial cells. (Top) The presence of wt H-Ras and H-RasL61 is distinguished by differential mobility in high-concentration SDS-polyacrylamide gels; (bottom) the presence of H-Ras–GTP was analyzed by Raf-RBD pulldown. H-Ras–GTP/total H-Ras levels relative to those in MCA3D cells are presented beneath the gel. (B) H-Ras distribution in epithelial cells displaying different H-Ras genotypes.
H-Ras partitioning to DRMs/SFs depends on its palmitoylation levels.
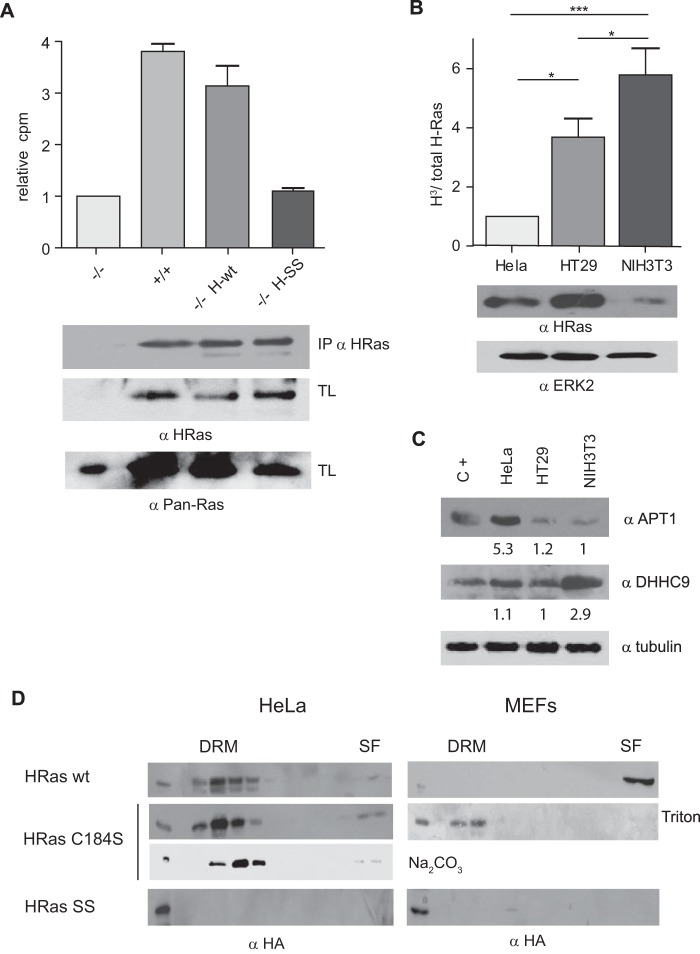
It was of interest to determine what dictates the H-Ras preference for different microdomains. Since palmitoylation is critical for the association of Ras proteins with different types of membranes (38), we analyzed whether variations on H-Ras palmitoylation could account for its distinctive PM sublocalization in different types of cells. To this end, we selected three cell lines: HeLa cells, in which H-Ras is found mostly at DRMs; HT29 cells, in which H-Ras segregates at both DRMs and SFs; and NIH 3T3 cells, which harbor H-Ras exclusively in SFs (Fig. 1B). Palmitoylation was determined by measurement of the incorporation of [3H]palmitate into immunoprecipitated H-Ras. This method was validated by assaying the level of incorporation of [3H]palmitate into H-Ras in H-Ras−/− MEFs reconstituted with wild-type H-Ras or with an unpalmitoylatable H-Ras C181S/C184S mutant (Fig. 5A). Among the cell lines tested, NIH 3T3 cells showed the highest levels of [3H]palmitate incorporation, whereas HeLa cells displayed the lowest levels of [3H]palmitate incorporation. HT29 cells displayed intermediate levels (Fig. 5B). We then asked whether the degree of H-Ras palmitoylation was related to the levels of the enzymes involved in H-Ras palmitoylation/depalmitoylation in each cell type. As such, we monitored the expression of the AT APT-1 and of the PAT DHHC9. Noticeably, APT-1 was highly expressed in HeLa cells, in agreement with its low levels of H-Ras palmitoylation. On the contrary, DHHC9 exhibited high levels in NIH 3T3 cells, endorsing the abundance of palmitoylated H-Ras therein, but it was less abundant in HeLa and HT29 cells (Fig. 5C). These results suggest that H-Ras would be present in DRMs in those cells in which its palmitoylation levels are low as a result of high deacylation activity. In contrast, H-Ras would be located in SFs in cells in which it is efficiently palmitoylated as a consequence of elevated PAT levels.
FIG 5.
Variability in H-Ras acylation levels in different cell types. (A) (Top) Validation of the method used to measure endogenous H-Ras palmitoylation by analysis of the levels of H-Ras palmitoylation in wild-type MEFs (+/+), H-Ras knockout MEFs (−/−), or H-Ras knockout MEFs reconstituted with ectopic H-Ras wt (−/− H-wt) or the unpalmitoylatable H-Ras C181/184S mutant (−/− H-SS). Palmitate incorporation was measured in anti-H-Ras immunoprecipitates from cells incubated with [3H]palmitic acid by scintillation counting. (Bottom) H-Ras expression in immunoprecipitates (IPs). (B) (Top) Determination of H-Ras palmitoylation levels in the indicated cell lines. Results show the levels of H-Ras into which [3H]palmitate was incorporated (H3)/total H-Ras levels relative to the values in HeLa cells. (Bottom) H-Ras protein expression. Protein levels were equalized by the Bradford assay. (A and B) Results show the average ± SEM from at least five experiments. *, P < 0.05 with 95% confidence intervals; ***, P < 0.001 with 95% confidence intervals. (C) APT-1 and DHHC9 expression in lysates from the indicated cells line determined by immunoblotting. Protein levels were equalized by the Bradford assay. C+, positive control consisting of HEK293T cells overexpressing the corresponding proteins. The corresponding protein levels relative to the lowest level are indicated. (D) Partitioning of monopalmitoylated H-Ras in HeLa cells and MEFs. Cells were transfected with HA-tagged wt, C181S mutant, and C181/184S mutant (SS) H-Ras (1 μg). Triton X-100-solubilized membranes were fractionated in sucrose gradients. Where indicated, HeLa cells were fractionated using the detergent-free Na2CO3 method.
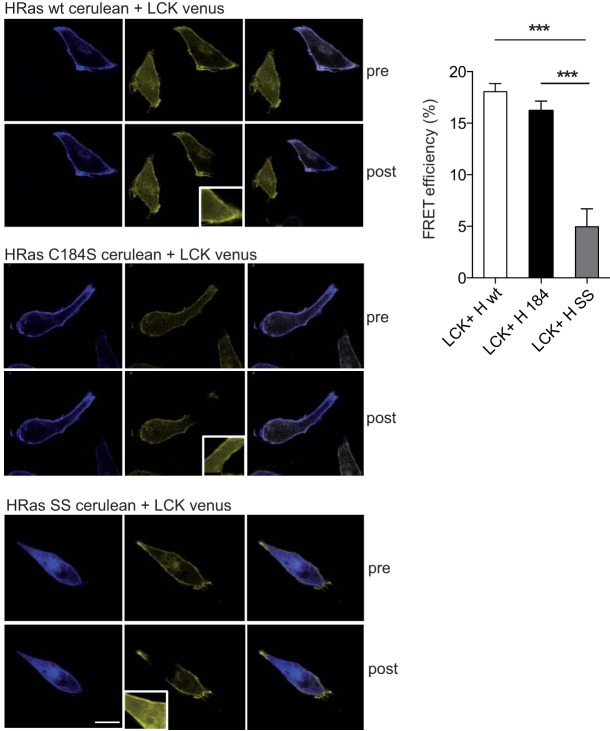
In light of these results, we interrogated whether H-Ras partitioning to SFs in a high-acylation setting or to DRMs in cells with low palmitoylation activity correlated with H-Ras being bi- or monopalmitoylated. To do so, we transfected HA-tagged versions of wt and monopalmitoylated H-Ras C184S in MEFs and HeLa cells. In HeLa cells, H-Ras wt and the H-Ras C184S mutant colocalized in DRMs. The localization of the H-Ras C184S mutant was not altered depending on the extraction method. Interestingly, in MEFs, H-Ras wt was found in SFs, whereas the H-Ras C184S mutant was located in DRMs. In both cell types, as expected, unpalmitoylatable H-Ras C181/184S could not be detected on either microdomain (Fig. 5D). We did not test the monopalmitoylated H-Ras C181S mutant, as previous results have shown that it cannot access the PM (10, 39). In HeLa cells, the presence of the H-Ras C184S mutant in DRMs was further confirmed by FRET analyses, revealing a colocalization with LCK-Venus as prominent as that exhibited by H-Ras wt (Fig. 6).
FIG 6.
PM sublocalization of palmitoylation-defective Ras proteins. (Left) Representative FRET micrographs prebleaching (pre) and postbleaching (post) of HeLa cells transfected with wild-type (H wt), monopalmitoylated C184S mutant (H 184), and unpalmitoylated C181/184S (H SS) H-Ras–Cerulean constructs, in addition to the DRM-specific FRET probe LCK-Venus. (Insets) Bleached area. Bar, 10 μm. (Right) Quantitation of FRET efficiencies. Results show the mean ± SEM from at least five experiments. ***, P < 0.001 with 95% confidence intervals.
In conclusion, since in a low-acylation environment the H-Ras wt colocalizes with monopalmitoylated H-Ras at DRMs, it can be inferred that in this type of PM H-Ras exists in a monopalmitoylated form. On the contrary, when the level of cellular acylation activity is high, monopalmitoylated H-Ras remains at DRMs, whereas the H-Ras wt is found in SFs, suggesting that H-Ras must be bipalmitoylated in order to reside in SFs and that monopalmitoylated H-Ras is impaired in its ability to transfer to such a PM type.
Alterations in the palmitoylation/depalmitoylation balance modify H-Ras sublocalization.
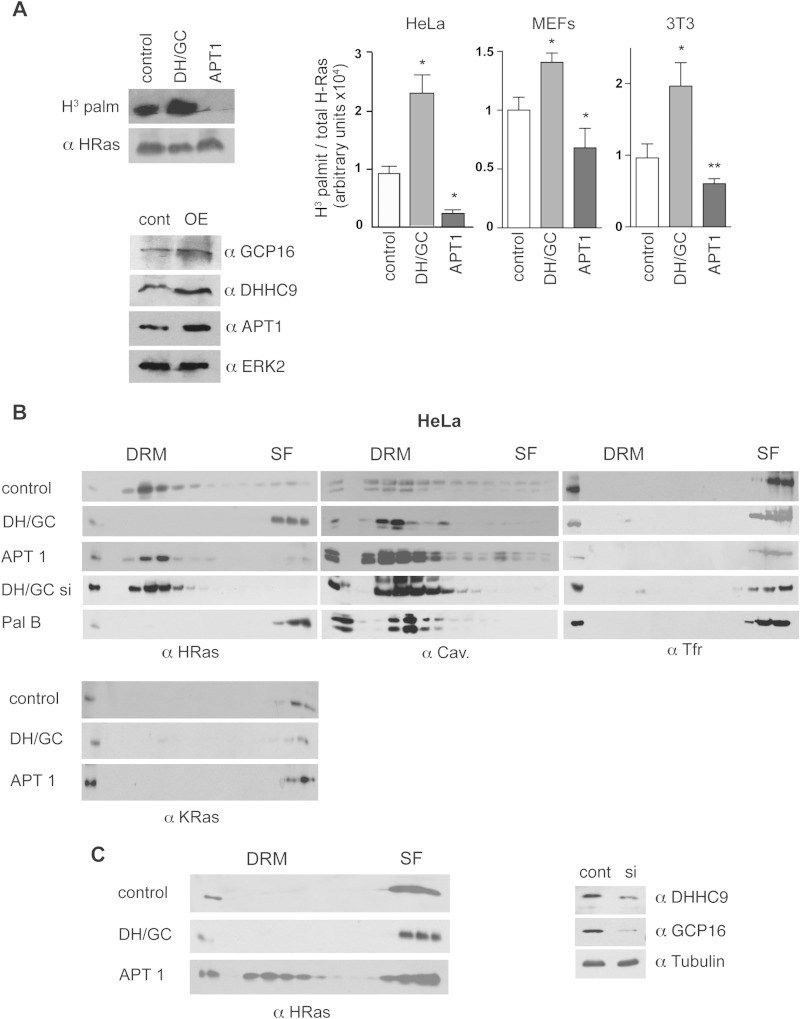
Next, we tested whether altering the balance between palmitoylation and depalmitoylation events could impact the H-Ras distribution. To do this, we overexpressed DHHC9/GCP16 and APT-1, which, respectively, elevate and reduce endogenous H-Ras palmitoylation levels independently of the cell line examined (Fig. 7A). We expressed these proteins in cells with low (HeLa cells) and high (MEFs) levels of endogenous acylation and monitored the changes in H-Ras segregation. In HeLa cells, overexpression of DHHC9/GCP16 triggered a complete migration of H-Ras from DRMs to SFs. Conversely, high APT-1 activity resulted in a reduction of palmitoylated H-Ras levels and confined it further to DRMs. A similar effect was observed when the expression of DHHC9/GCP16 was attenuated using siRNAs. Unlike H-Ras, K-Ras localization was unaffected by the overexpression of either enzyme (Fig. 7B). Contrary to the findings for HeLa cells, in MEFs the overexpression of DHHC9/GCP16 did not alter the H-Ras distribution. Remarkably, in this cell line overexpression of APT-1 resulted in a substantial shift of H-Ras from SFs to DRMs (Fig. 7C).
FIG 7.
Acylation/deacylation balance determines H-Ras PM distribution. (A) (Left, top) Effects of the overexpression of APT-1 and DHHC9/GCP16 (1 μg) on H-Ras palmitoylation levels in NIH 3T3 cells. The blots show the levels of H-Ras into which [3H]palmitate (H3 palm and H3 palmit) was incorporated and total H-Ras in anti-H-Ras immunoprecipitates. (Left, bottom) Levels of AT and PAT expression in control and H-Ras-overexpressing (OE) NIH 3T3 cells. (Right) Quantification of H-Ras palmitoylation levels in the indicated cell lines. Bars show the average ± SEM from three independent experiments. *, P < 0.05 with 95% confidence intervals; **, P < 0.005 with 95% confidence intervals. (B) Distribution of endogenous H-Ras and K-Ras analyzed in serum-starved HeLa cells transfected with APT-1 and DHHC9/GCP16. (C) (Left) The distribution of endogenous H-Ras analyzed in MEFs was determined as described in the legend to panel B. (Right) Levels of AT and PAT expression in control and siRNA-transfected HeLa cells. DH/GC, DHHC9/GCP16; cont, control; DH/GC si, siRNA against DHHC9/GCP16; Pal B, palmostatin B, si, siRNA.
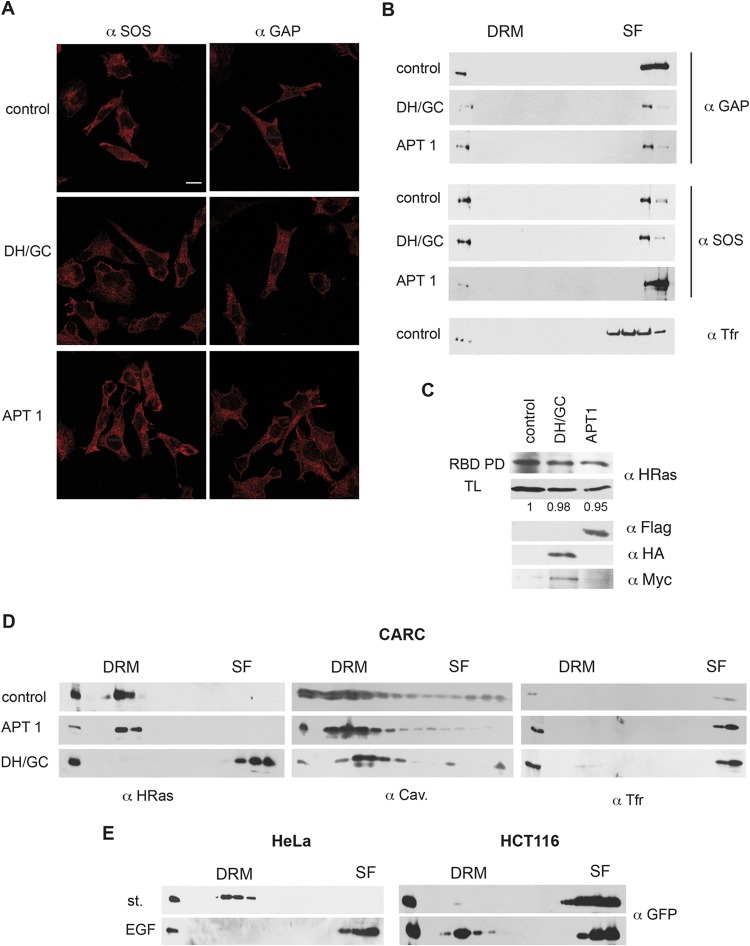
The possibility existed that changes in the palmitoylation/depalmitoylation machinery would impact the localization of H-Ras regulatory proteins GTPase-activating protein (GAP) and GEFs, thereby altering the H-Ras activation status and contributing to its diffusion across PM microdomains. To rule out this possibility, we analyzed the distribution of SOS1 and p120 GAP in response to the overexpression of DHHC9/GCP16 and APT-1 in HeLa cells. The cytoplasmic distribution of these proteins was unaltered in both cases (Fig. 8A). The presence of SOS1 and p120 GAP was also detected in soluble PM fractions, but this was unchanged after the overexpression of DHHC9/GCP16 and APT-1 (Fig. 8B). Accordingly, H-Ras–GTP loading was unaltered in response to the overexpression of either enzyme (Fig. 8C).
FIG 8.
Acylation/deacylation-dependent translocation is unaffected by H-Ras activation status. (A) Immunofluorescence showing SOS1 and p120 GAP subcellular localization in HeLa cells transfected with APT-1 or DHHC9/GCP16 (1 μg). Confocal sections at the level of the nuclei are shown. Bar, 10 μm. (B) SOS1 and p120 GAP distribution in PM sublocations in HeLa cells. (C) H-Ras GTP levels are unaltered in HeLa cells overexpressing APT-1 and DHHC9/GCP16. H-Ras–GTP/total H-Ras levels relative to those in control cells in a representative experiment are shown. (D) Acylation/deacylation-dependent translocation of activated H-Ras. Migration of endogenous H-RasL61 was monitored in CARC cells transfected with APT-1 or DHHC9/GCP16. (E) The H-Ras C terminus regulates translocation between microdomains. GFP–H-RasCT was transfected (1 μg) into the indicated cell lines, and translocation was monitored upon EGF stimulation (100 ng/ml, 10 min).
It was important to find out if translocation between PM microdomains in response to acylation/deacylation was influenced by the intrinsic structural alterations that occur in the H-Ras protein upon GTP loading. To this end, we used CARC cells that, as mentioned above, endogenously express mutant H-RasL61, constitutively bound to GTP and localized in DRMs (Fig. 4B). It was found that H-RasL61 localization was unaffected by APT-1 overexpression but that H-RasL61 underwent translocation to SFs in response to DHHC9/GCP16 (Fig. 8D), thus behaving identically to the H-Ras wild type in HeLa cells (Fig. 7B). To substantiate this point further, we analyzed the movement of GFP–H-RasCT, a chimeric protein that consists of GFP fused to the H-Ras C terminus (HVR plus CAAX box) and therefore independent of H-Ras activity. When GFP–H-RasCT was expressed in HeLa and HCT116 cells, it localized identically to endogenous H-Ras under starvation conditions and underwent identical translocations in response to EGF stimulation (Fig. 8E and 3A and B). These results demonstrate that H-Ras translocation is driven by its degree of acylation and not by the intrinsic activation status of the molecule.
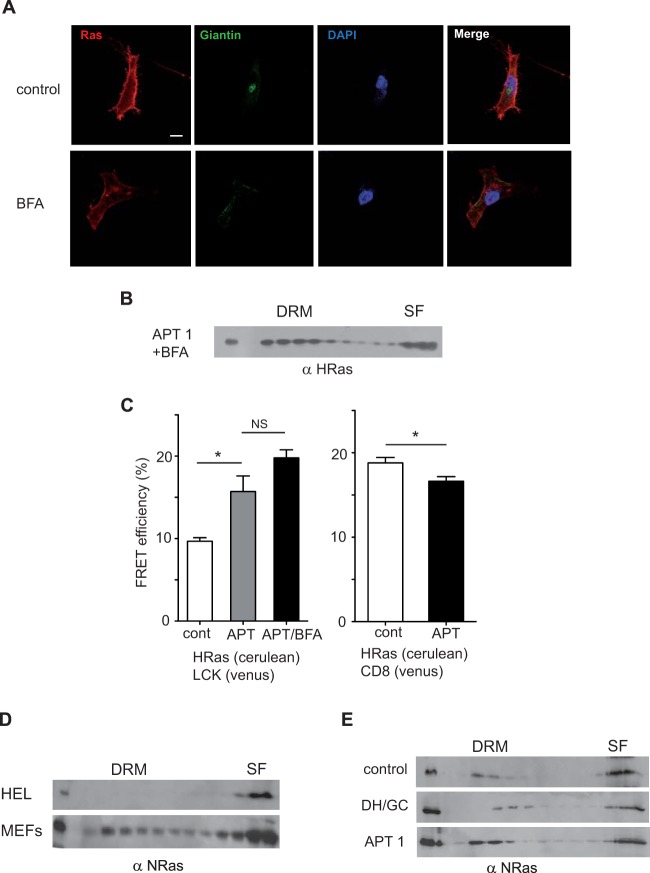
Since depalmitoylated H-Ras traffics to the GC to return to the PM once it is repalmitoylated (12), it was possible that the transfer of deacylated H-Ras from SFs to DRMs requires passage through the GC. To address this possibility, we treated APT-1-expressing MEFs with brefeldin A (BFA). This drug disrupts the GC architecture, rendering it nonfunctional. As a consequence, the presence of H-Ras at the PM was slightly reduced (Fig. 9A). Noticeably, BFA treatment did not impede the translocation of H-Ras from SFs to DRMs in response to enhanced APT-1 activity (Fig. 9B and 7C). These results were further substantiated by FRET, which revealed a significant increment in the colocalization of H-Ras with the DRM marker LCK concomitantly with a reduction in the level of colocalization with the SF probe CD8 in MEFs expressing APT-1. Again, DRM enrichment with H-Ras was unaffected by BFA treatment (Fig. 9C). In summary, these results demonstrate that alterations in the palmitoylation/depalmitoylation equilibrium impact the distribution of H-Ras in PM microdomains without the participation of the GC.
FIG 9.
The H-Ras shift between PM microdomains does not require a functional GC. (A) Effects of BFA on the GC and on H-Ras sublocalization. The immunofluorescence of endogenous H-Ras subcellular localization in control MEFs and MEFs treated with BFA (100 μM, 1 h) is shown. DAPI staining shows nuclei, and GC is revealed using antigiantin antibodies. Confocal sections at the level of the nuclei are shown. Bar, 10 μm. (B) BFA treatment does not impede the H-Ras shift induced by APT-1 overexpression. Figure 7C shows the results for the control not treated with BFA. (C) FRET analyses of the effects of BFA on APT-1-induced H-Ras PM sublocalization in MEFs. Results show the mean ± SEM from at least five experiments. *, P < 0.05; NS, not significant. (D) Distribution of N-Ras in serum-starved cells. (E) The distribution of N-Ras in MEFs is unaffected by the overexpression of APT-1 and DHHC9/GCP16.
N-Ras localization is unaffected by palmitoylation/depalmitoylation events.
N-Ras, also subject to palmitoylation, resembles H-Ras in many trafficking aspects (23). It was of interest to determine whether N-Ras responded like H-Ras to changes in palmitoylation/depalmitoylation. Noticeably, the distribution of N-Ras was not the same as that of H-Ras in the cell lines tested: in HEL cells, while H-Ras was distributed between DRMs and SFs (Fig. 1B), N-Ras was confined to SFs (Fig. 9D). Likewise, in MEFs, which displayed H-Ras exclusively at SFs (Fig. 1B), N-Ras localized at DRMs and SFs (Fig. 9D). Furthermore, overexpression of neither DHHC9/GCP16 nor APT-1 managed to substantially alter N-Ras distribution in MEFs (Fig. 9E). Thus, H-Ras and N-Ras differ in their response to acylation/deacylation alterations.
Changes in PM sublocalization affect H-Ras biochemical and biological outputs.
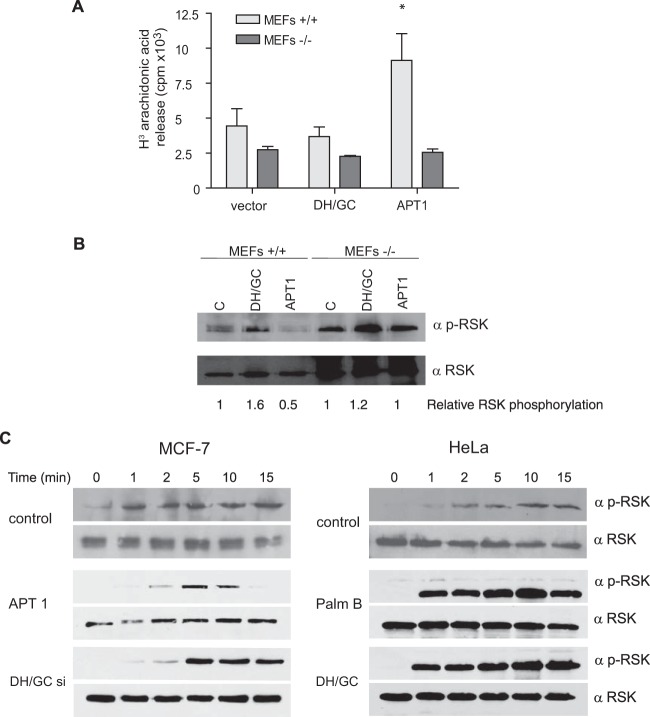
Previous studies from our laboratory have revealed the importance of the PM platform from which Ras signals emanate in the control of ERK1/2 substrate specificity. Whereas cytosolic phospholipase A2 (cPLA2) activation is triggered from Ras signals coming from LRs, RSK-1 is activated in response to Ras signals generated at the DM (28). Thus, we hypothesized that the H-Ras sublocalization shift in response to acylation/deacylation changes should affect its coupling to these effector molecules. To test this notion, we analyzed cPLA2 activation in MEFs transfected with DHHC9/GCP16 or with APT-1. It was found that wild-type MEFs expressing DHHC9/GCP16, in which H-Ras SF localization was unaltered (Fig. 7C), displayed similar levels of cPLA2 activation as vector-transfected cells (Fig. 10A). However, in MEFs expressing APT-1, in which H-Ras had undergone translocation to DRMs, cPLA2 activation was dramatically increased. To ascertain if the observed effects on cPLA2 activation were a specific consequence of H-Ras trafficking, we used MEFs devoid of H-Ras (40). In this case, cPLA2 activation levels were unaltered (Fig. 10A).
FIG 10.
H-Ras effector usage is affected by alterations in the acylation/deacylation balance. (A) Effects of the overexpression of ATs and PATs (1 μg) on the activation of cPLA2 by H-Ras. 3H-labeled arachidonic acid release was measured in wild-type MEFs (MEFs +/+) or H-Ras knockout MEFs (MEFs −/−). Bars show the average ± SEM from three independent experiments. *, P < 0.05 with 95% confidence intervals. (B) Effects on H-Ras-mediated activation of RSK-1. RSK-1 phosphorylation levels relative to those in control cells are shown. C, control. (C) Time course of RSK-1 activation in HeLa and MCF-7 cells stimulated with EGF (100 ng/ml) for the indicated times. Where shown, H-Ras acylation/deacylation was altered by overexpression or downregulation (with siRNA) of the indicated proteins or by treatment with palmostatin B (1 μM, 80 min).
In a similar fashion, we also assayed the phosphorylation of RSK-1. In this case, the expression of DHHC9/GCP16 slightly increased the level of RSK-1 phosphorylation, probably as a consequence of the mild increase in H-Ras levels at SFs following enhanced palmitoylation. On the other hand, in cells expressing APT-1, RSK-1 phosphorylation was effectively diminished as a result of the exit of H-Ras from SFs toward DRMs. As in the case for cPLA2, RSK-1 activation was unaffected in H-Ras−/− MEFs (Fig. 10B). These results demonstrate that the lateral diffusion of H-Ras between PM microdomains brings about substantial qualitative changes in its signal output.
Following this rationale, it was possible that the H-Ras distribution/H-Ras diffusion impacts the activation kinetics of downstream signaling intermediaries whose activation exhibits site specificity, like RSK-1 (28). Conceivably, the activation of RSK-1 should be faster in cells in which H-Ras resides in SFs under unstimulated conditions than in cells in which H-Ras is present at DRMs. To test this hypothesis, we evaluated RSK-1 activation in MCF-7 cells, in which H-Ras resides in SFs, and in HeLa cells, which harbor H-Ras at DRMs. In MCF-7 cells, RSK-1 was phosphorylated immediately after EGF stimulation, with its peak being reached within the first minute (Fig. 10C). Conversely, in HeLa cells, RSK-1 phosphorylation proceeded at a slower pace, taking 10 min to achieve maximum levels. Along this line, we tested how altering H-Ras acylation/deacylation in the same cellular context affected RSK-1 activation. In MCF-7 cells in which H-Ras deacylation was promoted either by overexpression of APT-1 or by downregulation of DHHC9/GCP16 using siRNAs, RSK-1 phosphorylation was delayed. Conversely, in HeLa cells in which H-Ras acylation was fostered either by the inhibition of APT-1 using palmostatin B (19) or by the overexpression of DHHC9/GCP16, RSK-1 phosphorylation was accelerated (Fig. 10C). These observations indicate that H-Ras acylation status and, subsequently, its PM sublocalization can significantly impact the nature and the dynamics of its signals.
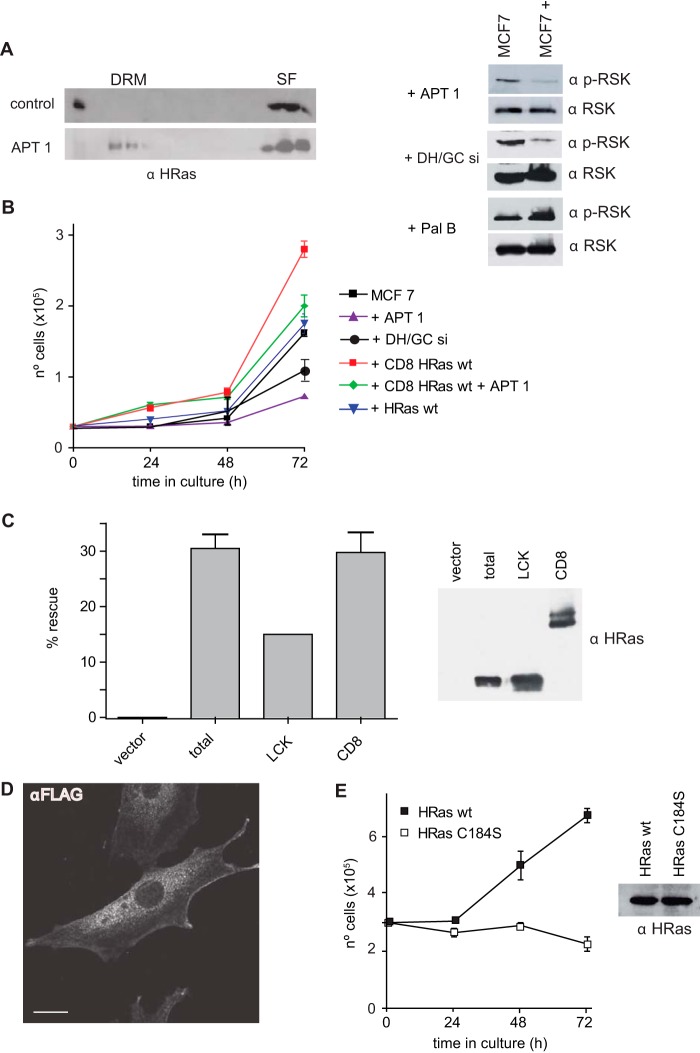
After we obtained these results, we investigated how H-Ras diffusion between PM microdomains impacts its biological effects. To this end, we utilized MCF-7 cells, where RSK-1 inhibition markedly diminishes the proliferation rate (41). In these cells, APT-1 overexpression led to a drop in the level of RSK-1 activation, most likely due to the exclusion of H-Ras from SFs (Fig. 11A). In agreement with those findings, a similar effect was observed by attenuating the expression of DHHC9/GCP16. Conversely, RSK-1 phosphorylation was fostered by treatment with palmostatin B (Fig. 11A). Moreover, enhanced levels of APT-1 and reduced levels of DHHC9/GCP16 resulted in a marked reduction in the proliferation rate (Fig. 11B). Since APT-1 is not specific for H-Ras and is also capable of depalmitoylating some Gα subunits (18), we evaluated the extent to which the drop in the rate of proliferation could be attributed to H-Ras diffusing away from SFs. For this purpose, we generated a cell line expressing CD8–H-Ras, where H-Ras is constitutively anchored to the DM/SFs (27, 28), thereby making H-Ras insensitive to the delocalizing effect of APT-1. This cell line exhibited enhanced proliferation compared to parental or H-Ras wt-expressing cells. When APT-1 was coexpressed with CD8–H-Ras, a drop in the rate of proliferation was observed (Fig. 11B), probably as a consequence of the depalmitoylation of Gα subunits or other palmitoylated proteins mediated by mitogenic signals. However, such a reduction was far less pronounced compared to the effect of APT-1 on parental cells. Furthermore, the rate of proliferation of CD8–H-Ras/APT-1 -expressing cells was similar to that exhibited by parental cells, indicating that CD8–H-Ras could rescue the antiproliferative effect of APT-1. Thus, the attenuated proliferation in MCF-7 cells expressing APT-1 can be attributed mostly to the exit of H-Ras from SFs.
FIG 11.
H-Ras biological outputs are affected by alterations in its sublocalization. (A) The overexpression of APT-1 in MCF-7 cells alters H-Ras microlocalization and effector usage. (Left) Distribution of endogenous H-Ras; (right) effects on the phosphorylation of RSK-1 of H-Ras acylation/deacylation altered by overexpression or downregulation (with siRNA) of the indicated proteins or by treatment with palmostatin B (1 μM, 80 min). (B) Proliferation rate of MCF-7 cell lines expressing the indicated constructs. Data show the average ± SEM from three independent experiments. (C) (Left) Divergence in ability of H-Ras at DRMs and SFs to rescue the viability of Ras-less MEFs. Cells were transfected with the indicated constructs. At 10 days after addition of 4-OHT (600 nM) to delete endogenous K-Ras, the colonies were scored. Results show the proportion of colonies in 4-OHT-treated cells relative to that in untreated cells, expressed as a percentage (average ± SEM from five independent experiments). (Right) Expression of the different H-Ras constructs. (D) FLAG–H-Ras C184S localizes at the PM in serum-starved Ras-less MEFs. A confocal section at the level of the nucleus is shown. Bar, 10 μm. (E) H-Ras C184S cannot rescue the viability of Ras-less MEFs. Cells stably expressing H-Ras wt or the H-Ras C184S mutant were treated for 10 days with 4-OHT, trypsinized, and replated, and proliferation was scored every 24 h. Data show the average ± SEM from three independent experiments.
Finally, considering that H-Ras can localize in both DRMs and SFs, it was interesting to determine if it could support proliferation from either of these sublocations. To this end, we expressed wild-type H-Ras, DM-targeted CD8–H-Ras, and LCK–H-Ras targeted to LRs (27, 28) in MEFs devoid of all Ras proteins. These Ras-less cells cannot proliferate unless they express an exogenous Ras protein (30). Whereas CD8–H-Ras was able to promote colony formation almost as effectively as wild-type H-Ras, LCK–H-Ras was significantly less efficient (Fig. 11C). Similarly, we investigated whether the monopalmitoylated H-Ras C184S mutant, physiologically restricted to DRMs, could support cellular proliferation. Noticeably, in spite of the fact that this protein was profusely present at the PM of Ras-less MEFs (Fig. 11D), it was incapable of maintaining cellular proliferation up to the levels exhibited by the H-Ras wt (Fig. 11E). Overall, these results demonstrate that there are remarkable quantitative and qualitative differences in the biochemical nature of H-Ras signals and in their capacity to sustain cellular proliferation, depending on the PM sublocation from which they emanate, which is regulated by the acylation/deacylation balance.
DISCUSSION
At the beginning of the last decade, the pioneering studies of Mark R. Philips and colleagues, who demonstrated that Ras proteins are present in different types of membranes (8, 42), and of John F. Hancock and colleagues, who showed that Ras isoforms occupy different microdomains within the PM (21), introduced the concept of space as a key factor in the regulation of Ras functions. Along these lines, it has been proposed that H-Ras is present in DRMs when GDP bound and undergoes lateral diffusion to SFs upon GTP loading (21). In the present study, we demonstrate that this model is not universal, albeit it is absolutely true for some cell lineages. We show that endogenous, GDP-loaded H-Ras displays a broad variability in its localization to DRMs and SFs depending on the cell type. Thus, inactive H-Ras is not restricted to DRMs, as previously suggested (21).
Most interestingly, we also demonstrate that H-Ras does not necessarily localize in SFs upon GTP loading. Indeed, in those cell lines that display inactive H-Ras at SFs, H-Ras–GTP does not remain therein but migrates to DRMs, drifting in the direction opposite from that described in previous studies (21). These results present a new conundrum: why does H-Ras–GTP migrate away from the location where it is present when inactive? We have recently demonstrated that ERK1/2 mitogen-activated protein kinases phosphorylate different substrates depending on the sublocalization of the activating Ras signal, suggesting that different effectors are available from distinct cellular microlocations (28). Thus, we posit that upon activation H-Ras must visit all those microdomains providing platforms for the activation of effector routes in order to switch on its complete repertoire of signals. As such, in response to stimulation, the H-Ras present at DRMs when GDP bound, would immediately activate the effectors available therein and would then diffuse to SFs to switch on the signaling routes originating from such a location. Logically, in a cell with H-Ras initially at SFs, the course of activation for both site-specified effector pools would be the reverse. Unfortunately, membrane fractionation techniques preclude performing to-the-minute kinetics to demonstrate such a hypothesis. However, the time courses of RSK-1 activation in cells harboring H-Ras either in DRMs or in SFs endorse this concept. Moreover, in agreement with this postulate, we demonstrate that to activate cPLA2, H-Ras must drift away from its original position at SFs and move toward DRMs.
In this respect, utilizing Ras-less fibroblasts, an invaluable model for investigating Ras in the absence of contaminating endogenous Ras signals, we have disclosed a disparity between DRMs and SFs for supporting H-Ras promitogenic functions: DM/SF-tethered H-Ras can rescue viability and promote proliferation, whereas H-Ras in LRs/DRMs is significantly impaired in its ability to perform such tasks. Likewise, the H-Ras C184S mutant, which is locked at DRMs and incapable of translocating to SFs, cannot sustain the proliferation of Ras-less fibroblasts. These results point to the DM/SFs as the critical platform for Ras mitogenic signaling. In agreement with this, our previous results have demonstrated that 121 genes were specifically regulated by H-Ras at the DM, whereas no LR-specific gene was found among the ∼400 genes regulated from such a site (29). This could explain why H-Ras/N-Ras-knockout mice, which are devoid of Ras isoforms at LRs/DRMs, exhibit a normal phenotype (40).
Following from these considerations, in cells displaying H-Ras–GDP at SFs, GTP-bound H-RasV12 would be locked in DRMs and therefore unable to engage those substrates available at SFs. Under these premises, oncogenic H-Ras would need to complement its signals with those coming from endogenous Ras isoforms or close relatives, such as TC21. The latter could be the case in Ras-less fibroblasts, in which H-RasV12 is able to rescue viability in the absence of K- and N-Ras (30). In support of this notion, there is evidence demonstrating that oncogenic Ras requires other wild-type Ras isoforms for transformation (43–46).
It can be envisioned that in cells harboring H-Ras–GDP in DRMs, H-Ras–GTP must diffuse to SFs to access the substrates necessary for generating proliferative signals. However, why do cells with H-Ras–GDP already at SFs appear to be compelled to vacate H-Ras–GTP from this microdomain? We posit that this could be a mechanism for quenching Ras signals at the main Ras operative platform. In support of this notion, we demonstrate that promoting the exit of H-Ras from SFs via depalmitoylation attenuates proliferation in MCF-7 cells.
In this study, we have shown that the partition of H-Ras between DRMs and SFs is governed by its degree of acylation. In cells in which H-Ras is highly palmitoylated, it is located in SFs. On the contrary, in cells exhibiting low levels of palmitoylation, H-Ras is found in DRMs. In agreement with this, we show that cells harboring H-Ras at DRMs express high levels of the AT APT-1, whereas the PAT DHHC9 is profusely expressed in cells displaying H-Ras in SFs. Noticeably, we have found that at DRMs H-Ras appears in the monopalmitoylated form, whereas in SFs H-Ras is bipalmitoylated. We posit that the insertion on the PM of H-Ras with bulky palmitates in close proximity at Cys181 and Cys184 would exert a substantial structural distortion on the PM. Thus, it would be favored in microdomains with a high plasticity. Therefore, it has a preference for fluid, disordered SF membranes, as opposed to the rigid, organized, and tightly packed DRMs. Our results are in full agreement with those of other studies demonstrating that palmitoylation of Cys181 is sufficient to target H-Ras to LRs, and once it is there, palmitoylation at Cys184 is necessary for its segregation to the DM (10, 39). A similar palmitoylation switch regulates the sublocalization of the Rho GTPase Rac-1 (47).
Our data suggest that H-Ras sublocalization would be the result of the balance between acylation and deacylation events. In support of this notion, we demonstrate that H-Ras sublocalization can be altered by tilting such an equilibrium. Overexpression of DHHC9/GCP16 evokes H-Ras palmitoylation and its drift toward SFs. On the contrary, high levels of APT-1 facilitate H-Ras depalmitoylation, forcing its migration to DRMs. Importantly, H-Ras diffusion from SFs to DRMs in response to depalmitoylation appears to occur directly and does not require passage through the GC, as treatment with BFA does not impair such movement.
Our data also disclose that N-Ras sublocalization is governed differently from H-Ras sublocalization. Remarkably, in most of the cell lines tested, the distribution of N-Ras did not resemble that of H-Ras. Moreover, N-Ras did not respond like H-Ras to alterations in acylation/deacylation undertaken by APT-1 and DHHC9/GCP16. Although APT-1 has been shown to be active over N-Ras in vitro (18), this does not appear to be the case in the physiological settings used in our studies. Thus, it is likely that the N-Ras acylation cycle is under the control of other ATs and PATs. A diverging behavior between H-Ras and N-Ras in their association with membranes is not unprecedented. For example, recycling endosomes permit the association of N-Ras but not that of monopalmitoylated H-Ras (48). It is possible that leucine 184, which provides an additional membrane anchor for N-Ras (49, 50), accounts for these divergences.
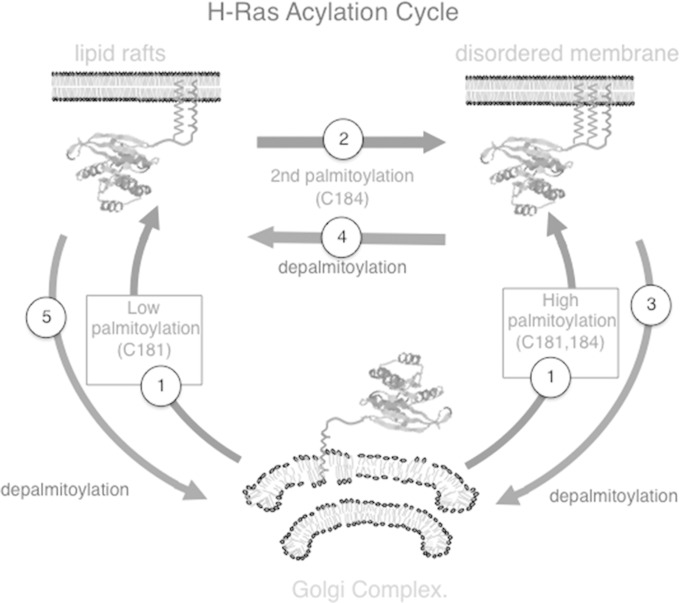
Previous findings have solidly established the model currently known as the Ras acylation cycle. Briefly, H-Ras is palmitoylated at the GC and traffics to the PM through the exocytic route, and therein it is depalmitoylated to traffic back to the GC via a nonvesicular route (11, 12). In light of our data, we posit the introduction of several modifications, adding further complexity to the H-Ras acylation cycle, as depicted in Fig. 12. Briefly, (i) depending on how active the intrinsic acylation machinery in a given cell type is, H-Ras would be mono- or bipalmitoylated at the GC. It would then traffic to the PM to occupy microdomains at DRMs, if monopalmitoylated, or SFs, if bipalmitoylated (Fig. 12, step 1). (ii) At DRMs, upon activation H-Ras with monopalmitoylated Cys181 becomes palmitoylated in Cys184 by a PAT of the DHHC family, several of which have been shown to be present at the PM (6). Bipalmitoylation forces H-Ras to drift to SFs (Fig. 12, step 2). (iii) At SFs, bipalmitoylated H-Ras could be totally depalmitoylated and traffic back to the GC (Fig. 12, step 3). (iv) Alternatively, upon activation, bipalmitoylated H-Ras could be monodepalmitoylated in Cys184 by the AT PAT-1, and the resulting monopalmitoylated H-Ras Cys181 would diffuse laterally to DRMs (Fig. 12, step 4). (v) At DRMs, monopalmitoylated H-Ras could be totally depalmitoylated to return to the GC (Fig. 12, step 5). As such, the H-Ras acylation cycle could transit in different directions depending on the cellular context in which it unfolds.
FIG 12.
A new model for the H-Ras acylation cycle. A detailed explanation of each of the steps depicted in this new model can be found in the Discussion.
Herein, we have demonstrated that upon activation H-Ras diffusion between different PM types requires changes in acylation. An unanswered question is the following: what regulates H-Ras acylation? To date, there is no evidence suggesting that H-Ras palmitoylation by DHHC9/GPC16 or any other PAT is a regulated process. However, our results suggest that agonist stimulation should somehow up- or downregulate the acylation machinery to permit a rapid H-Ras–GTP bidirectional drift between DRMs and SFs, depending on the cell type. Moreover, since ectopic H-RasV12 is capable per se of undergoing lateral diffusion between PM microdomains in unstimulated cells, it follows that H-Ras must somehow be capable of regulating its own acylation. Indeed, previous studies indicate that H-Ras–GTP can regulate its own depalmitoylation rate (14), in full agreement with our observations. Further investigations will be necessary to cast some light on this understudied area.
ACKNOWLEDGMENTS
The P. Crespo laboratory is supported by grant BFU2011-23807 from the Spanish Ministry of Economy-Fondos FEDER and by the Red Temática de Investigación Cooperativa en Cáncer (RTICC) (RD/12/0036/0033), Spanish Ministry of Health. Work in the M. Barbacid laboratory was supported by grants from the European Research Council (ERC-AG/250297-RAS AHEAD) and the Spanish Ministry of Science and Innovation (SAF2006-11773 and CSD2007-00017).
We are grateful to C. Enrich and C. Rentero for technical guidance with the FRET experiments.
REFERENCES
- 1.Malumbres M, Barbacid M. 2003. RAS oncogenes: the first 30 years. Nat Rev Cancer 3:459–465. doi: 10.1038/nrc1097. [DOI] [PubMed] [Google Scholar]
- 2.Arozarena I, Calvo F, Crespo P. 2011. Ras, an actor on many stages: posttranslational modifications, localization, and site-specified events. Genes Cancer 2:182–194. doi: 10.1177/1947601911409213. [DOI] [PMC free article] [PubMed] [Google Scholar]
- 3.Ahearn IM, Haigis K, Bar-Sagi D, Philips MR. 2012. Regulating the regulator: post-translational modification of RAS. Nat Rev Mol Cell Biol 13:39–51. doi: 10.1038/nrm3255. [DOI] [PMC free article] [PubMed] [Google Scholar]
- 4.Swarthout JT, Lobo S, Farh L, Croke MR, Greentree WK, Deschenes RJ, Linder ME. 2005. DHHC9 and GCP16 constitute a human protein fatty acyltransferase with specificity for H- and N-Ras. J Biol Chem 280:31141–31148. doi: 10.1074/jbc.M504113200. [DOI] [PubMed] [Google Scholar]
- 5.Mitchell DA, Vasudevan A, Linder ME, Deschenes RJ. 2006. Protein palmitoylation by a family of DHHC protein S-acyltransferases. J Lipid Res 47:1118–1127. doi: 10.1194/jlr.R600007-JLR200. [DOI] [PubMed] [Google Scholar]
- 6.Salaun C, Greaves J, Chamberlain LH. 2010. The intracellular dynamic of protein palmitoylation. J Cell Biol 191:1229–1238. doi: 10.1083/jcb.201008160. [DOI] [PMC free article] [PubMed] [Google Scholar]
- 7.Greaves J, Chamberlain LH. 2011. DHHC palmitoyl transferases: substrate interactions and (patho)physiology. Trends Biochem Sci 36:245–253. doi: 10.1016/j.tibs.2011.01.003. [DOI] [PubMed] [Google Scholar]
- 8.Choy E, Chiu VK, Silletti J, Feoktistov M, Morimoto T, Michaelson D, Ivanov IE, Philips MR. 1999. Endomembrane trafficking of Ras: the CAAX motif targets proteins to the ER and Golgi. Cell 98:69–80. doi: 10.1016/S0092-8674(00)80607-8. [DOI] [PubMed] [Google Scholar]
- 9.Apolloni A, Prior IA, Lindsay M, Parton RG, Hancock JF. 2000. H-Ras but not K-ras traffics to the plasma membrane through the exocytic pathway. Mol Cell Biol 20:2475–2487. doi: 10.1128/MCB.20.7.2475-2487.2000. [DOI] [PMC free article] [PubMed] [Google Scholar]
- 10.Rocks O, Peyker A, Kahms M, Verveer PJ, Koerner C, Lumbierres M, Kuhlmann J, Waldmann H, Wittinghofer A, Bastiaens PI. 2005. An acylation cycle regulates localization and activity of palmitoylated Ras isoforms. Science 307:1746–1752. doi: 10.1126/science.1105654. [DOI] [PubMed] [Google Scholar]
- 11.Goodwin JS, Drake KR, Rogers C, Wright L, Lippincott-Schwartz J, Philips MR, Kenworthy AK. 2005. Depalmitoylated Ras traffics to and from the Golgi complex via a nonvesicular pathway. J Cell Biol 170:261–272. doi: 10.1083/jcb.200502063. [DOI] [PMC free article] [PubMed] [Google Scholar]
- 12.Rocks O, Gerauer M, Vartak N, Koch S, Huang ZP, Pechlivanis M, Kuhlmann J, Brunsveld L, Chandra A, Ellinger B, Waldmann H, Bastiaens PI. 2010. The palmitoylation machinery is a spatially organizing system for peripheral membrane proteins. Cell 141:458–471. doi: 10.1016/j.cell.2010.04.007. [DOI] [PubMed] [Google Scholar]
- 13.Magee AI, Gutierrez L, McKay IA, Marshall CJ, Hall A. 1987. Dynamic fatty acylation of p21N-ras. EMBO J 6:3353–3357. [DOI] [PMC free article] [PubMed] [Google Scholar]
- 14.Baker TL, Zheng H, Walker J, Coloff JL, Buss JE. 2003. Distinct rates of palmitate turnover on membrane-bound cellular and oncogenic H-Ras. J Biol Chem 278:19292–19300. doi: 10.1074/jbc.M206956200. [DOI] [PubMed] [Google Scholar]
- 15.Laude AJ, Prior IA. 2008. Palmitoylation and localisation of RAS isoforms are modulated by the hypervariable linker domain. J Cell Sci 121:421–427. doi: 10.1242/jcs.020107. [DOI] [PubMed] [Google Scholar]
- 16.Ahearn IM, Tsai FD, Court H, Zhou M, Jennings BC, Ahmed M, Fehrenbacher N, Linder ME, Philips MR. 2011. FKBP12 binds to acylated H-Ras and promotes depalmitoylation. Mol Cell 41:173–185. doi: 10.1016/j.molcel.2011.01.001. [DOI] [PMC free article] [PubMed] [Google Scholar]
- 17.Camp LA, Hofmann SL. 1993. Purification and properties of a palmitoyl-protein thioesterase that cleaves palmitate from H-Ras. J Biol Chem 268:22566–22574. [PubMed] [Google Scholar]
- 18.Duncan JA, Gilman AG. 1998. A cytoplasmic acyl-protein thioesterase that removes palmitate from G protein alpha subunits and p21(RAS). J Biol Chem 273:15830–15837. doi: 10.1074/jbc.273.25.15830. [DOI] [PubMed] [Google Scholar]
- 19.Dekker FJ, Rocks O, Vartak N, Menninger S, Hedberg C, Balamurugan R, Wetzel S, Renner S, Gerauer M, Scholermann B, Rusch M, Kramer JW, Rauh D, Coates GW, Brunsveld L, Bastiaens PI, Waldmann H. 2010. Small-molecule inhibition of APT1 affects Ras localization and signaling. Nat Chem Biol 6:449–456. doi: 10.1038/nchembio.362. [DOI] [PubMed] [Google Scholar]
- 20.Sengupta P, Baird B, Holowka D. 2007. Lipid rafts, fluid/fluid phase separation, and their relevance to plasma membrane structure and function. Semin Cell Dev Biol 18:583–590. doi: 10.1016/j.semcdb.2007.07.010. [DOI] [PMC free article] [PubMed] [Google Scholar]
- 21.Prior IA, Harding A, Yan J, Sluimer J, Parton RG, Hancock JF. 2001. GTP-dependent segregation of H-Ras from lipid rafts is required for biological activity. Nat Cell Biol 3:368–375. doi: 10.1038/35070050. [DOI] [PubMed] [Google Scholar]
- 22.Prior IA, Muncke C, Parton RG, Hancock JF. 2003. Direct visualization of Ras proteins in spatially distinct cell surface microdomains. J Cell Biol 160:165–170. doi: 10.1083/jcb.200209091. [DOI] [PMC free article] [PubMed] [Google Scholar]
- 23.Hancock JF, Parton RG. 2005. Ras plasma membrane signalling platforms. Biochem J 389(Pt 1):1–11. doi: 10.1042/BJ20050231. [DOI] [PMC free article] [PubMed] [Google Scholar]
- 24.Kranenburg O, Verlaan I, Moolenar WH. 2001. Regulation of c-Ras function: cholesterol depletion affects caveolin association, GTP loading and signaling. Curr Biol 11:1880–1884. doi: 10.1016/S0960-9822(01)00582-6. [DOI] [PubMed] [Google Scholar]
- 25.Matallanas D, Arozarena I, Berciano MT, Aaronson DS, Pellicer A, Lafarga M, Crespo P. 2003. Differences in the inhibitory specificities of H-Ras, K-Ras and N-Ras (N17) dominant negative mutants are related to their membrane microlocalization. J Biol Chem 278:4572–4581. doi: 10.1074/jbc.M209807200. [DOI] [PubMed] [Google Scholar]
- 26.Calvo F, Agudo-Ibanez L, Crespo P. 2010. The Ras-ERK pathway: understanding site-specific signaling provides hope of new anti-tumor therapies. Bioessays 32:412–421. doi: 10.1002/bies.200900155. [DOI] [PubMed] [Google Scholar]
- 27.Matallanas D, Sanz-Moreno V, Arozarena I, Calvo F, Agudo-Ibanez L, Santos E, Berciano MT, Crespo P. 2006. Distinct utilization of effectors and biological outcomes resulting from site-specific Ras activation: Ras functions in lipid rafts and Golgi complex are dispensable for proliferation and transformation. Mol Cell Biol 26:100–116. doi: 10.1128/MCB.26.1.100-116.2006. [DOI] [PMC free article] [PubMed] [Google Scholar]
- 28.Casar B, Arozarena I, Sanz-Moreno V, Pinto A, Agudo-Ibanez L, Marais R, Lewis RE, Berciano MT, Crespo P. 2009. Ras subcellular localization defines extracellular signal-regulated kinase 1 and 2 substrate specificity through distinct utilization of scaffold proteins. Mol Cell Biol 29:1338–1353. doi: 10.1128/MCB.01359-08. [DOI] [PMC free article] [PubMed] [Google Scholar]
- 29.Agudo-Ibanez L, Nunez F, Calvo F, Berenjeno IM, Bustelo XR, Crespo P. 2007. Transcriptomal profiling of site-specific Ras signals. Cell Signal 19:2264–2276. doi: 10.1016/j.cellsig.2007.06.025. [DOI] [PMC free article] [PubMed] [Google Scholar]
- 30.Drosten M, Dhawahir A, Sum EY, Urosevic J, Lechuga CG, Esteban LM, Castellano E, Guerra C, Santos E, Barbacid M. 2010. Genetic analysis of Ras signalling pathways in cell proliferation, migration and survival. EMBO J 29:1091–1104. doi: 10.1038/emboj.2010.7. [DOI] [PMC free article] [PubMed] [Google Scholar]
- 31.Sanz-Moreno V, Casar B, Crespo P. 2003. p38alpha isoform Mxi2 binds to extracellular signal-regulated kinase 1 and 2 mitogen-activated protein kinase and regulates its nuclear activity by sustaining its phosphorylation levels. Mol Cell Biol 23:3079–3090. doi: 10.1128/MCB.23.9.3079-3090.2003. [DOI] [PMC free article] [PubMed] [Google Scholar]
- 32.Zubiaur M, Izquierdo M, Terhorst C, Malavasi F, Sancho J. 1997. CD38 ligation results in activation of the Raf-1/mitogen-activated protein kinase and the CD3-zeta/zeta-associated protein-70 signaling pathways in Jurkat T lymphocytes. J Immunol 159:193–205. [PubMed] [Google Scholar]
- 33.Kenworthy AK. 2001. Imaging protein-protein interactions using fluorescence resonance energy transfer microscopy. Methods 24:289–296. doi: 10.1006/meth.2001.1189. [DOI] [PubMed] [Google Scholar]
- 34.Koushik SV, Chen H, Thaler C, Puhl HL III, Vogel SS. 2006. Cerulean, Venus, and VenusY67C FRET reference standards. Biophys J 91:L99–L101. doi: 10.1529/biophysj.106.096206. [DOI] [PMC free article] [PubMed] [Google Scholar]
- 35.Arozarena I, Aaronson DS, Matallanas D, Sanz V, Ajenjo N, Tenbaum SP, Teramoto H, Ighishi T, Zabala JC, Gutkind JS, Crespo P. 2000. The Rho family GTPase Cdc42 regulates the activation of Ras/MAP kinase by the exchange factor Ras-GRF. J Biol Chem 275:26441–26448. doi: 10.1074/jbc.M002992200. [DOI] [PubMed] [Google Scholar]
- 36.Ajenjo N, Aaronson DS, Ceballos E, Richard C, León J, Crespo P. 2000. Myeloid leukemia cell growth and differentiation are independent of mitogen-activated protein kinase ERK1/2 activation. J Biol Chem 275:7189–7197. doi: 10.1074/jbc.275.10.7189. [DOI] [PubMed] [Google Scholar]
- 37.Quintanilla M, Brown K, Ramsden M, Balmain A. 1986. Carcinogen-specific mutation and amplification of Ha-Ras during mouse skin carcinogenesis. Nature 322:78–80. doi: 10.1038/322078a0. [DOI] [PubMed] [Google Scholar]
- 38.Silvius JR. 2002. Mechanisms of Ras protein targeting in mammalian cells. J Membr Biol 190:83–92. doi: 10.1007/s00232-002-1026-4. [DOI] [PubMed] [Google Scholar]
- 39.Roy S, Plowman S, Rotblat B, Prior IA, Muncke C, Grainger S, Parton RG, Henis YI, Kloog Y, Hancock JF. 2005. Individual palmitoyl residues serve distinct roles in H-Ras trafficking, microlocalization, and signaling. Mol Cell Biol 25:6722–6733. doi: 10.1128/MCB.25.15.6722-6733.2005. [DOI] [PMC free article] [PubMed] [Google Scholar]
- 40.Esteban LM, Vicario-Arbejon C, Fernandez-Salguero P, Fernandez-Melarde A, Swaminathan N, Yienger K, Lopez E, McKay R, Ward JM, Pellicer A, Santos E. 2001. Targeted genomic disruption of H-Ras and N-Ras individually or in combination, reveals the dispensability of both loci for mouse growth and development. Mol Cell Biol 21:1444–1452. doi: 10.1128/MCB.21.5.1444-1452.2001. [DOI] [PMC free article] [PubMed] [Google Scholar]
- 41.Smith JA, Poteet-Smith CE, Xu Y, Errington TM, Hecht SM, Lannigan DA. 2005. Identification of the first specific inhibitor of p90 ribosomal S6 kinase (RSK) reveals an unexpected role for RSK in cancer cell proliferation. Cancer Res 65:1027–1034. [PubMed] [Google Scholar]
- 42.Chiu VK, Bivona T, Hach A, Sajous JB, Silletti J, Wiener H, Johnson RL II, Cox AD, Philips MR. 2002. Ras signalling on the endoplasmic reticulum and the Golgi. Nat Cell Biol 4:343–350. doi: 10.1038/ncb783. [DOI] [PubMed] [Google Scholar]
- 43.Pulciani S, Santos E, Long LK, Sorrentino V, Barbacid M. 1985. ras gene amplification and malignant transformation. Mol Cell Biol 5:2836–2841. [DOI] [PMC free article] [PubMed] [Google Scholar]
- 44.Hamilton M, Wolfman A. 1998. Ha-Ras and N-Ras regulate MAPK activity by distinct mechanisms in vivo. Oncogene 16:1417–1428. doi: 10.1038/sj.onc.1201653. [DOI] [PubMed] [Google Scholar]
- 45.Jeng HH, Taylor LJ, Bar-Sagi D. 2012. Sos-mediated cross-activation of wild-type Ras by oncogenic Ras is essential for tumorigenesis. Nat Commun 3:1168. doi: 10.1038/ncomms2173. [DOI] [PMC free article] [PubMed] [Google Scholar]
- 46.Bentley C, Jurinka SS, Kljavin NM, Vartanian S, Ramani SR, Gonzalez LC, Yu K, Modrusan Z, Du P, Bourgon R, Neve RM, Stokoe D. 2013. A requirement for wild-type Ras isoforms in mutant KRas-driven signalling and transformation. Biochem J 452:313–320. doi: 10.1042/BJ20121578. [DOI] [PubMed] [Google Scholar]
- 47.Navarro-Lerida I, Sanchez-Perales S, Calvo M, Rentero C, Zheng Y, Enrich C, Del Pozo MA. 2012. A palmitoylation switch mechanism regulates Rac1 function and membrane organization. EMBO J 31:534–551. doi: 10.1038/emboj.2011.446. [DOI] [PMC free article] [PubMed] [Google Scholar]
- 48.Misaki R, Morimatsu M, Uemura T, Waguri S, Miyoshi E, Taniguchi N, Matsuda M, Taguchi T. 2010. Palmitoylated Ras proteins traffic through recycling endosomes to the plasma membrane during exocytosis. J Cell Biol 191:23–29. doi: 10.1083/jcb.200911143. [DOI] [PMC free article] [PubMed] [Google Scholar]
- 49.Huster D, Vogel A, Katzka C, Scheidt HA, Binder H, Dante S, Gutberlet T, Zschornig O, Waldmann H, Arnold K. 2003. Membrane insertion of a lipidated Ras peptide studied by FTIR, solid-state NMR, and neutron diffraction spectroscopy. J Am Chem Soc 125:4070–4079. doi: 10.1021/ja0289245. [DOI] [PubMed] [Google Scholar]
- 50.Gorfe AA, Pellarin R, Caflisch A. 2004. Membrane localization and flexibility of a lipidated Ras peptide studied by molecular dynamics simulations. J Am Chem Soc 126:15277–15286. doi: 10.1021/ja046607n. [DOI] [PubMed] [Google Scholar]


