

Abstract
Antibiotics have either bactericidal or bacteriostatic activity. However, they also induce considerable gene expression in bacteria when used at subinhibitory concentrations (below the MIC). We found that lincomycin, which inhibits protein synthesis by binding to the ribosomes of Gram-positive bacteria, was effective for inducing the expression of genes involved in secondary metabolism in Streptomyces strains when added to medium at subinhibitory concentrations. In Streptomyces coelicolor A3(2), lincomycin at 1/10 of its MIC markedly increased the expression of the pathway-specific regulatory gene actII-ORF4 in the blue-pigmented antibiotic actinorhodin (ACT) biosynthetic gene cluster, which resulted in ACT overproduction. Intriguingly, S. lividans 1326 grown in the presence of lincomycin at a subinhibitory concentration (1/12 or 1/3 of its MIC) produced abundant antibacterial compounds that were not detected in cells grown in lincomycin-free medium. Bioassay and mass spectrometry analysis revealed that some antibacterial compounds were novel congeners of calcium-dependent antibiotics. Our results indicate that lincomycin at subinhibitory concentrations potentiates the production of secondary metabolites in Streptomyces strains and suggest that activating these strains by utilizing the dose-response effects of lincomycin could be used to effectively induce the production of cryptic secondary metabolites. In addition to these findings, we also report that lincomycin used at concentrations for markedly increased ACT production resulted in alteration of the cytoplasmic protein (FoF1 ATP synthase α and β subunits, etc.) profile and increased intracellular ATP levels. A fundamental mechanism for these unique phenomena is also discussed.
INTRODUCTION
Streptomyces is the largest genus of Gram-positive filamentous actinomycetes, and members of this genus produce abundant amounts of numerous bioactive metabolites, including antitumor agents, immunosuppressants, and antibiotics in particular (1, 2). Whole-genome sequencing studies of Streptomyces strains have shown that each species could produce many more secondary metabolites than were expected. For example, Streptomyces coelicolor A3(2), S. avermitilis MA-4680, and S. griseus IFO 13350 each produce several secondary metabolites, although they have more than 20 gene clusters that can encode a number of known or predicted biosynthetic pathways for secondary metabolites (3–5). This indicates that the vast majority of secondary metabolites remain unexpressed or barely expressed under standard laboratory conditions. Thus, there is considerable interest in exploring practical means to induce this genetic potential in streptomycetes, which could result in the isolation of novel bioactive secondary metabolites.
Recent developments in new methodologies, including physiological and genetic engineering approaches, have opened the door for the discovery of novel secondary metabolites by activating cryptic biosynthetic pathways in streptomycetes (6–13). The improvements and modifications of culture conditions, such as the one strain-many compounds approach (which changes fermentation conditions like medium compositions and culture vessel types), coculture (bacterial-bacterial or fungal-bacterial physical interactions), and utilizing inducing molecules (siderophores, γ-butyrolactones, N-acetylglucosamine, rare earth elements, antibiotic-remodeling compounds, and antibiotics), are simple, effective methods of inducing cryptic gene cluster expression and increasing the production of secondary metabolites (14–19).
Molecular genetic manipulation, including directed mutagenesis, expression of antibiotic activators, and heterologous expression, is also an efficient approach for activating target gene clusters and improving the yields of secondary metabolites (20, 21). In particular, altering the expression of transcription factors that control biosynthetic pathways and amplifying biosynthetic gene clusters have resulted in the dramatically increased production of secondary metabolites and the isolation of novel compounds and their congeners (22–24).
We have alternatively developed a novel method for activating poorly expressed Streptomyces genes to produce antibiotics via a mutation that confers resistance to drugs by targeting RNA polymerase or ribosomes, such as rifampin, streptomycin, gentamicin, and erythromycin (25–29). This method, a so-called ribosome engineering approach, led to the discovery of a novel antibiotic, piperidamycin, produced by Streptomyces sp. strain 631689, which rarely produced antibiotics in any culture medium without strain improvement (30–32). Using antibiotic-overproducing mutants that harbored mutations in RNA polymerase and/or ribosomes, we previously demonstrated the importance of altering the promoter selectivity of RNA polymerase and maintaining a high level of protein synthesis during the late growth phase for inducing antibiotic production. Although the detailed mechanisms have not been fully elucidated, the important finding was that modulating the transcriptional or translational apparatus or both (i.e., RNA polymerase and ribosomes) could dramatically alter gene expression in Streptomyces strains, which reflected their potential to produce novel secondary metabolites (29, 33).
On the basis of the rational approaches described above, we sought more effective methods of developing cryptic gene clusters for secondary metabolic pathways in Streptomyces strains. We found that secondary metabolite production could be dramatically potentiated by using a ribosome-targeting antibiotic at concentrations below its MIC. This appeared to agree with the concept of antibiotic hormesis, for which antibiotics at subinhibitory concentrations have pleiotropic effects on bacterial gene expression, as previously reported by Davies et al. (34, 35). Thus, in the present study, we used genetically best-characterized strains of Streptomyces, primarily S. coelicolor A3(2) and its close relative S. lividans 66, and conducted a detailed investigation of the dose-response effects of the ribosome-targeting antibiotic lincomycin on secondary metabolite production. We also investigated the possibility that approaches that utilize the hormetic effects of ribosome-targeting antibiotics could be used effectively to improve the yields of cryptic secondary metabolites. Additionally, as a first step toward understanding the mechanisms by which lincomycin induces the production of secondary metabolites, we attempted to identify those proteins that may have been involved in the marked differences between cells grown with or without lincomycin. Studies by Shibl (36) and Herbert et al. (37) have demonstrated effects of subinhibitory lincosamide antibiotics on virulence, adherence, and toxin production, etc. in Staphylococcus aureus. These previous studies showed lincosamide antibiotics at subinhibitory concentrations to have very little effect on cytoplasmic protein profiles. In contrast, the present study clearly demonstrated that the levels of several cytoplasmic proteins (FoF1 ATP synthase α and β subunits, proteins involved in antibiotic biosynthesis, etc.) were considerably different between the S. coelicolor A3(2) cells that were grown with or without lincomycin. A fundamental mechanism for these unique phenomena raised by lincomycin is discussed on the basis of the results of the present work.
MATERIALS AND METHODS
Chemicals.
Chloramphenicol, erythromycin, streptomycin, and tetracycline were purchased from Nacalai Tesque, Inc. (Japan). Clindamycin, gentamicin, lincomycin, and tylosin were purchased from Wako Pure Chemicals (Japan). Thiostrepton was purchased from Sigma-Aldrich.
Bacterial strains and growth conditions.
The actinomycete strains used in this study are shown in Table 1. Spores of these strains were prepared from cultures grown at 30°C for 7 days on GYM agar (27). Modified R5 (MR5) medium (both agar and liquid medium) (38) was used for phenotypic characterizations of S. coelicolor A3(2) and S. lividans strains. MR5 liquid medium was also used to grow cells to prepare total RNA and proteins. Typically, agar and liquid cultures were as follows. For agar culture, approximately 1 × 10⁵ to 5 × 10⁵ spores were inoculated onto MR5 agar (25 ml per culture plate [90 mm in diameter by 15 mm deep]) and incubated at 30°C. For liquid culture, approximately 1 × 10⁶ spores were inoculated into 20 ml of MR5 liquid medium in a 100-ml Erlenmeyer flask and incubated at 30°C with shaking at 200 rpm. SPY (39) liquid medium was used for streptomycin production by S. griseus IFO 13189. As required, media were supplemented with appropriate drug concentrations.
TABLE 1.
Actinomycete strains used in this study
| Strain | Relevant characteristic | Reference(s) |
|---|---|---|
| Streptomyces coelicolor A3(2) 1147 | Prototrophic wild type (SCP1+ SCP2+) | 2 |
| Streptomyces lividans 1326 | Prototrophic wild type (SLP2+ SLP3+) | 2 |
| Streptomyces lividans SLE299 | Spontaneous lincomycin-resistant mutant isolated from 1326 with a mutation in the 23S rRNA gene (rrnC-A2281G) | 25 |
| Streptomyces griseus IFO 13189 | Prototrophic streptomycin-producing wild type | 39 |
| Saccharopolyspora erythraea NRRL 2338 | Prototrophic erythromycin-producing wild type | 32, 56 |
MIC determinations.
To determine the MICs of drugs for S. coelicolor A3(2), S. lividans, and S. griseus, their spores were directly inoculated onto or into media that contained different concentrations of a particular drug and incubated at 30°C. The minimum drug concentration that nearly completely inhibited growth was defined as the MIC.
Dry cell weights.
A culture broth was filtered through filter paper or a membrane filter under vacuum and washed two times with reverse osmosis water to remove any residual medium remaining on the cell surfaces. The remaining cells were then dried to a constant weight in an oven at 55°C (for filter paper) or at room temperature (for a membrane filter) for 2 days. Dry cell weights were determined by subtracting the weight of the filter paper (membrane filter) from the weight of the filter paper (membrane filter) plus the cells.
Antibiotic assays.
Actinorhodin (ACT) production on MR5 agar was directly assessed by blue color intensity. The production of ACT and undecylprodigiosin (RED) in liquid culture with MR5 medium was determined as described previously (2, 25). A bioassay to detect antibacterial compound produced by S. lividans was performed as follows. Strain 1326 was grown on MR5 agar. At the times indicated, agar plugs (diameter, 8 mm) were cut from agar plates and transferred to an assay plate prepared with 2-fold-diluted Mueller-Hinton agar (20 ml per no. 2 square plate) that contained cells (1 × 10⁷ CFU) of the lincomycin-resistant mutant of Bacillus subtilis ATCC 6633 used as a test organism. To assess the zone of inhibition of antibacterial compounds in these agar plugs, the assay plates were incubated at 37°C for an additional 24 h. Streptomycin production in liquid SPY medium was determined as described previously (39).
HPLC analysis of culture extracts.
Samples used to assess the high-performance liquid chromatography (HPLC) profiles of S. lividans culture extracts were prepared as follows. Strain 1326 was grown for 7 days on MR5 agar covered with a cellophane sheet. Next, agar without cells was extracted with 25 ml of methanol by gentle agitation for 10 h. The crude extract was dried in a rotary evaporator and lyophilized. The resulting sample was dissolved in 25 ml of ultrapure water and separated into organic (ethyl acetate) and aqueous phases. The aqueous phase was lyophilized, dissolved in 5 ml of 50% aqueous methanol, and filtered through a FILTSTAR syringe filter (hydrophilic nylon, 0.22-μm pore size; Starlab Science Co. Ltd., China). Aliquots (20 μl) of each sample were subjected to HPLC with an InertSustain C18 reverse-phase column (4.6 by 250 mm, 5-μm particle size; GL Science Inc., Japan) and eluted at a flow rate of 1 ml/min. The HPLC apparatus included a Shimadzu Prominence HPLC system equipped with an SPD-M20A diode array detector (SHIMADZU Co. Ltd., Japan). The solvent and conditions used were 0 to 5 min of 30% acetonitrile (ACN) that contained 0.01% formic acid (FA) and 5 to 30 min of a linear gradient of 30 to 80% ACN that contained 0.01% FA. Multiple-wavelength monitoring was performed at 190 to 800 nm.
Isolation and analysis of antibacterial compounds.
To isolate any antibacterial compounds produced by S. lividans, strain 1326 was inoculated onto MR5 agar (20 plates) that contained 20 μg/ml of lincomycin and covered with cellophane sheets. After incubation for 7 days, cells on a cellophane sheet were removed and the agar was combined. A culture extract was prepared as described above, except that a Millex-HP syringe-driven filter unit (0.45 μm; Millipore) was used, and further purified by semipreparative HPLC with an InertSustain C18 reverse-phase column (10 by 250 mm, 5-μm particle size; GL Science Inc., Japan). Antibacterial compounds that were eluted by a gradient elution (flow rate, 4 ml/min) of 30 to 60% ACN that contained 0.01% FA were collected and dried in a rotary evaporator and lyophilized. Purified antibacterial compounds were analyzed by electrospray ionization time of flight mass spectrometry (ESI-TOF-MS). ESI-MS was performed with a Micromass LCT-Premier XE instrument (Waters). Mass data were acquired in the negative-ion mode with a scan range of 100 to 2,500 Da. The electrospray capillary voltage was 2.2 kV, and the cone voltage was 80 V. The source temperature was maintained at 100°C. Mass measurements were made at a resolution of 10,000 resolving power (RP).
Transcription analysis.
Total RNA was isolated from cells (approximately 50 mg wet weight) grown in MR5 liquid medium or on an MR5 agar plate with Sepasol-RNA I super G (Nacalai Tesque, Inc., Japan). After treatment with RNase-free Recombinant DNase I (TaKaRa Bio. Inc., Japan), each sample was further purified with a High Pure RNA isolation kit (Roche). Total RNA (2 μg) was used as the template for a reverse transcription (RT) reaction (20 μl) at 55°C for 30 min with a Transcriptor First Strand cDNA synthesis kit (Roche). Real-time quantitative RT-PCR (qRT-PCR) analysis for actII-ORF4, redD, SLI3570, atpA, and atpD gene expression was performed as described previously (40). The results of these assays were normalized relative to the corresponding transcriptional level of hrdB, the gene that encodes the principal sigma factor. For the primers used for real-time qPCR, see Table S1 in the supplemental material.
Protein gel electrophoresis and Western blot analysis.
Total cell proteins for sodium dodecyl sulfate-polyacrylamide gel electrophoresis (SDS-PAGE) and Western blot analysis were prepared as follows. Cells (approximately 50 to 350 mg [wet weight]) of S. coelicolor A3(2) grown in MR5 liquid medium were suspended in 1 ml of TMA-I buffer (10 mM Tris-HCl [pH 7.7], 30 mM NH4 acetate [OAc], 10 mM MgOAc2, 1 mM dithiothreitol, 10% [vol/vol] glycerol) that contained 1 mM phenylmethylsulfonyl fluoride and disrupted by homogenizing with 2 g of zirconia balls (0.5 mm). After centrifugation at 15,000 × g for 10 min at 4°C, the supernatant was dialyzed twice for 3 h against more than 50 volumes of TMA-I buffer and used as a total cell protein sample. Samples (5 μg) of total cellular protein were subjected to 12% (wt/vol) SDS-PAGE, after which the separated proteins was electroblotted onto a polyvinylidene difluoride membrane (Immobilon-P; Millipore). Blots were developed with polyclonal antibodies and an ECL Select Western blotting detection system (GE Healthcare) for chemiluminescence detection according to the manufacturer's instructions. Polyclonal antibodies against ActII-ORF4 was prepared from rabbits by immunizing them with a synthetic oligopeptide [211-MGRRAEALESYRNL-224, numbers represent amino acid residues in S. coelicolor A3(2)]. These were used as the primary antibody at a dilution of 1:5,000.
Protein identification.
Total cellular proteins that had been separated by SDS-PAGE were stained with CBB Stain One (Nacalai Tesque, Inc., Japan). The protein bands of interest were cut out and subjected to peptide mass fingerprinting analysis. Mascot software (Matrix Science) was used to analyze mass data and identify proteins.
Measurements of intracellular nucleotide pools.
Intracellular nucleotides, including ATP, GTP, UTP, and CTP, were extracted with 1 M FA from cells that had been grown in MR5 liquid medium and assayed with a Shimadzu Prominence HPLC system equipped with a Partisil-10 SAX ion-exchange column (4.6 by 250 mm, 5-μm particle size; Hichrom Co., United Kingdom) as described previously (39). Nucleotide concentrations were expressed in nanomoles per milligram of dry cell weight.
RESULTS
Lincomycin inducing effects on antibiotic production.
To assess the effects of subinhibitory concentrations of the ribosome-targeting antibiotics (clindamycin, chloramphenicol, erythromycin, gentamicin, lincomycin, streptomycin, tetracycline, thiostrepton, and tylosin) on ACT production by S. coelicolor A3(2) and S. lividans, we first determined the MICs of these drugs for each strain. The MICs of each antibiotic are shown in Table 2. Except for gentamicin, lincomycin, and streptomycin, the MICs of these for S. lividans were similar to those for S. coelicolor A3(2). We then assessed each antibiotic's effectiveness at enhancing ACT production at concentrations ranging from 1/10,000 of the antibiotic's MIC to its MIC. The results obtained with the optimal concentration of each antibiotic are shown in Fig. 1A. It is clear that all of these antibiotics were more or less effective at enhancing ACT production by S. coelicolor A3(2). The effects of lincomycin, chloramphenicol, and tetracycline were especially pronounced, and lincomycin had the greatest effect. Clindamycin, an antibiotic of the lincosamide class, had no effect on ACT production by S. lividans. Figure 1B shows the dose-dependent effect of lincomycin on ACT production. In S. coelicolor A3(2), lincomycin effectively enhanced ACT production over a wide concentration range, with an optimal concentration of 5 μg/ml (1/16 of its MIC). In S. lividans, lincomycin was effective only at certain concentrations. It markedly enhanced ACT production when added at 5 and 20 μg/ml; however, at 10 μg/ml, lincomycin had only a negligible effect. These results were reproducible in independent experiments. In this context, the lincomycin-resistant mutant SLE299, which we previously isolated from S. lividans 1326 as a spontaneous erythromycin-resistant mutant with a mutation in the 23S rRNA gene (25) (Table 1), also produced abundant ACT when grown on an MR5 agar plate with lincomycin at much higher concentrations than its parental strain did (see Fig. S1 in the supplemental material). This suggests that lincomycin may have positively affected ACT production by the wild-type strain and a lincomycin-resistant mutant of S. lividans in exactly the same manner, i.e., by targeting the 50S ribosomal subunit.
TABLE 2.
MICs of ribosome-targeting antibiotics for Streptomyces strains
| Strain | MIC (μg/ml)a |
||||||||
|---|---|---|---|---|---|---|---|---|---|
| Cli | Cm | Ery | Gen | Lin | Sm | Tet | Tsp | Tyl | |
| S. coelicolor A3(2) 1147 | 30 | 20 | 8 | 0.5 | 80 | 2.5 | 500 | 2 | 20 |
| S. lividans 1326 | 30 | 20 | 8 | 0.7 | 60 | 4 | 500 | 2 | 20 |
| S. lividans SLE299b | ND | ND | ND | ND | >1,000 | ND | ND | ND | ND |
| S. griseus IFO 13189 | ND | ND | ND | ND | 50 | ND | ND | ND | ND |
Determined after incubation on an MR5 agar plate for 7 days [S. coelicolor A3(2), S. lividans 1326, and S. lividans SLE299] or a GYM agar plate for 3 days (S. griseus IFO 13189). Abbreviations: Cli, clindamycin; Cm, chloramphenicol; Ery, erythromycin; Gen, gentamicin; Lin, lincomycin; Sm, streptomycin; Tet, tetracycline; Tsp, thiostrepton; Tyl, tylosin; ND, not determined.
Lincomycin-resistant mutant strain (25).
FIG 1.

S. coelicolor A3(2) and S. lividans ACT production and colony morphologies. Strains 1147 and 1326 were inoculated onto MR5 agar that contained clindamycin (Cli), chloramphenicol (Cm), erythromycin (Ery), gentamicin (Gen), lincomycin (Lin), streptomycin (Sm), tetracycline (Tet), thiostrepton (Tsp), or tylosin (Tyl) at the concentrations indicated and then incubated at 30°C for 7 and 10 days, respectively. (A) Results in the presence of ribosome-targeting antibiotics. (B) Results in the presence of different lincomycin concentrations.
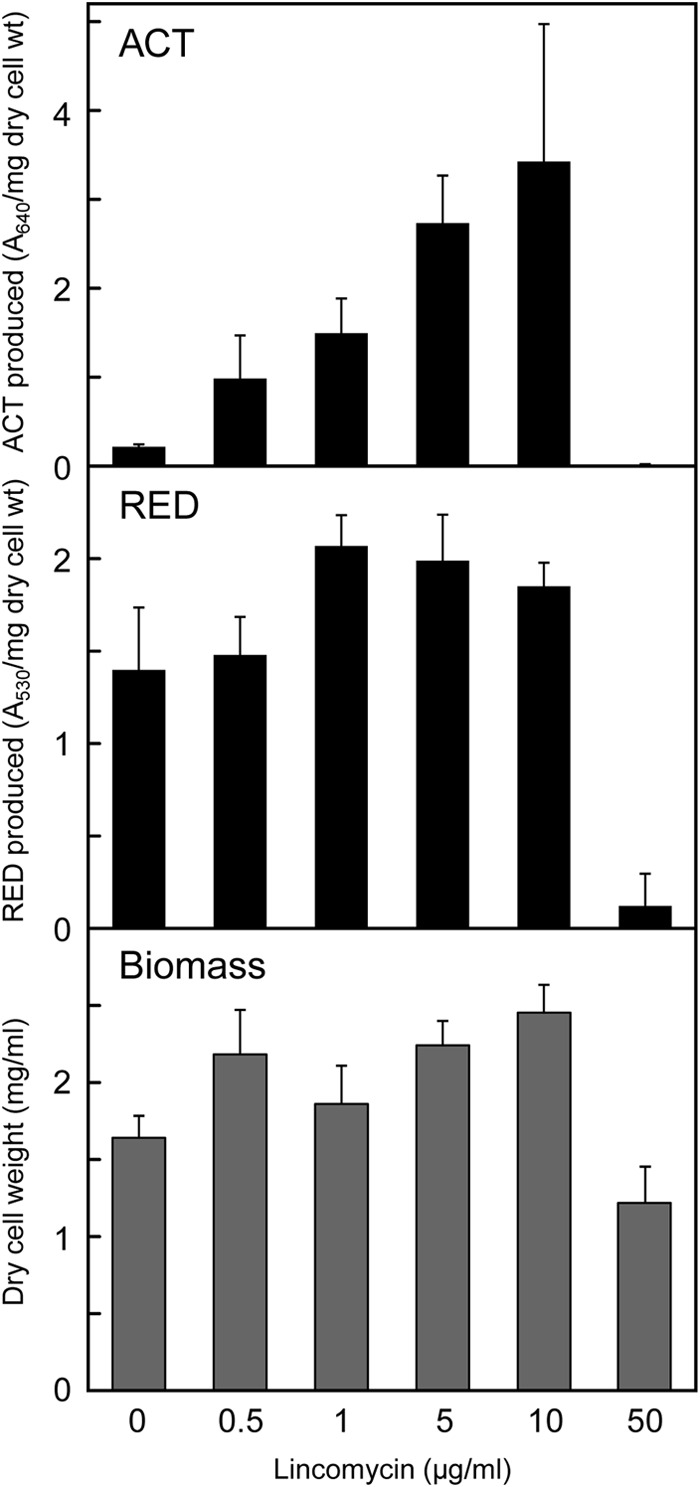
We then examined the effects of lincomycin in liquid culture. ACT production by S. coelicolor A3(2) increased with high doses of lincomycin ranging from 0.5 to 10 μg/ml, which corresponded to 1/200 and 1/10 of its MIC (Fig. 2). Lincomycin also effectively increased the production of RED over a wide concentration range, although its inducing effect was not pronounced. Although adding lincomycin to culture resulted in a delay in the initiation of growth and slow growth (Fig. 3A), the biomass dry weight after culture for 10 days tended to increase under growth conditions that induced enhanced ACT production (Fig. 2), suggesting that lincomycin at concentrations below its MIC could induce growth at the late growth phases. In this regard, although the amount of lincomycin added to the medium was rather small (10 μg/ml), lincomycin was still detected by HPLC in the medium even after 6 days of culture (data not shown).
FIG 2.
Effects of lincomycin on S. coelicolor A3(2) antibiotic production and biomass in liquid culture. Strain 1147 was inoculated into MR5 liquid medium that contained different lincomycin concentrations and then incubated at 30°C for 10 days with shaking (200 rpm). Pigmented antibiotic (ACT and RED) production and dry cell weight were determined as described in Materials and Methods. All experiments were done in triplicate, and results are expressed as means ± standard deviations.
FIG 3.

S. coelicolor A3(2) growth, ACT production, and expression of the pathway-specific regulatory genes in the ACT and RED biosynthetic gene clusters with and without lincomycin. (A) Growth and ACT production in liquid medium. Strain 1147 was inoculated into MR5 liquid medium with or without lincomycin (10 μg/ml) and then incubated at 30°C on a rotary shaker. Growth was monitored by measuring dry cell weight. Biomass results at the end of the culture period (240 h) were as follows: without lincomycin, 2.23 mg of dry cell wt/ml; with lincomycin, 2.37 mg of dry cell wt/ml. At the times indicated by arrows, E (mid-exponential phase), T (transition phase), S1 (16 h after T, early stationary phase), S2 (96 h after T, late stationary phase), and S3 (144 h after T, late stationary phase), cells were harvested to prepare total RNA and total soluble cellular proteins. ACT production was determined as described above. (B) Transcriptional analysis of actII-ORF4 and redD by real-time qRT-PCR. RNA was extracted from cells that had grown to the growth phases indicated. Total RNA preparation and real-time qRT-PCR were performed as described in Materials and Methods. Maximum expression levels were compared after setting the maximum expression level of a control (the exponential phase without lincomycin) to 1. (C) Western blot analysis for ActII-ORF4 expression. Protein samples were prepared from cells that had grown to the growth phases indicated. Western blot analysis was performed as described in Materials and Methods. Each lane was loaded with 5 μg of total soluble cellular proteins.
Induction of other antibacterial compounds by lincomycin.
We next determined whether lincomycin enhanced the production of both ACT and other secondary metabolites in S. lividans. Figure 4A shows the antibacterial activity of S. lividans with an agar plug agar diffusion assay with a lincomycin-resistant mutant of B. subtilis ATCC 6633. S. lividans produced abundant amount of antibacterial compounds when grown on MR5 agar plates supplemented with lincomycin at certain concentrations, 5 or 20 μg/ml, which also resulted in considerable ACT production (Fig. 1B). Antibacterial activity was clearly detectable from among the methanol-extractable metabolites when using a paper disk agar diffusion assay (data not shown).
FIG 4.

Antibacterial compounds and transcriptional analysis of the gene for CDA biosynthesis in S. lividans grown with lincomycin at subinhibitory concentrations. Strain 1326 was inoculated onto MR5 agar plates that contained different concentrations of lincomycin and then incubated at 30°C for 7 days. (A) Antibacterial compound production. Agar plugs were prepared from agar plates, transferred to an assay plate inoculated with a lincomycin-resistant mutant of B. subtilis ATCC 6633 as a test organism, and then incubated at 37°C for 24 h. (B) HPLC analysis of culture extracts. Samples were prepared and analyzed by HPLC as described in Materials and Methods. Eluate absorbance was monitored at 220 nm. Arrows indicate peaks that were barely detectable in samples prepared from an agar plate without lincomycin. The insert shows the antibacterial activities of peaks 1 and 2 against B. subtilis ATCC 6633 in the presence or absence of 12 mM calcium nitrate. (C) Transcriptional analysis of SLI3570 by real-time qRT-PCR. Cells were harvested to prepare total RNA at phase 1 (during substrate mycelia formation), phase 2 (just when RED production began), phase 3 (12 h after phase 2), and phase 4 (24 h after phase 2). Real-time qPCR was performed as described in Materials and Methods.
To identify the antibacterial compounds that were produced, we compared the metabolic profiles of methanol-extractable metabolites that were prepared from cultures with or without lincomycin by HPLC with multiple-wavelength monitoring. Several peaks (indicated by arrows in Fig. 4B) were detected only in the fraction that was prepared from a culture that included lincomycin. These peaks were missing from or barely detectable in the fraction that was prepared from a culture that did not include lincomycin. At least two peaks, indicated by arrows 1 and 2, had antibacterial activity (inset in Fig. 4B), and this antibacterial activity was clearly detected only in the presence of calcium nitrate. Antibacterial compounds 1 and 2 were isolated and subjected to structural analyses by mass spectrometry. ESI-TOF-MS analysis results showed that the molecular masses of antibacterial compounds 1 and 2 were 1,518 and 1,532 Da, respectively (see Fig. S2 in the supplemental material). These results indicate that antibacterial compounds 1 and 2, produced by S. lividans when grown on MR5 agar plates with lincomycin, were novel congeners of a known calcium-dependent antibiotic (CDA; molecular mass, 1,464.5 to 1,562.5 Da) (2, 41), which suggests that the potential of S. lividans to produce secondary metabolites was dramatically induced by exposure to lincomycin at subinhibitory concentrations.
Effects of lincomycin on expression of antibiotic-biosynthetic gene clusters.
ActII-ORF4 protein is a product of the actII-ORF4 gene that is a DNA-binding protein that positively regulates the transcription of ACT biosynthetic genes in S. coelicolor A3(2) (42). We investigated the expression pattern of the actII-ORF4 gene by real-time qRT-PCR and Western blotting of S. coelicolor A3(2) cells that were grown with the optimal lincomycin concentration (10 μg/ml) for enhancing ACT production. Analyzing cells that were harvested at different growth phases (mid-exponential, transition, early stationary, and late stationary phases designated by arrows E, T, S1, and S2, respectively, in the upper part of Fig. 3A) demonstrated that lincomycin caused a marked increase in ActII-ORF4 mRNA and protein levels (Fig. 3B and C). In this context, the ActVA-ORF4 protein (involved in ACT biosynthesis) was overexpressed in cells that were grown with lincomycin to the late growth phase (protein band 6 in Fig. 5A; see below). The expression of redD, a pathway-specific regulatory gene for RED biosynthesis, was also increased to some extent by lincomycin (Fig. 3B), which accounted for a slight increase in RED production (Fig. 2).
FIG 5.

Total cellular protein profiles, transcriptional analysis of the gene coding for FoF1 ATP synthase, and changes in intracellular nucleotide levels in S. coelicolor A3(2) grown with or without lincomycin. (A) SDS-PAGE analysis of total cellular proteins. Total cellular protein samples were prepared from cells grown to the indicated growth phases in MR5 medium without (−) or with (+) lincomycin (10 μg/ml). Each lane was loaded with 5 μg of protein. Molecular mass markers (Sigma low-range molecular weight markers) are shown at the left. Arrows 2, 3, and 6 indicate proteins that were abundant in a sample prepared from cells grown with lincomycin but were minimal in samples prepared from cells grown without lincomycin, and arrows 1, 4, and 5 indicate the opposite conditions. Protein bands 1 to 6 were identified by peptide mass fingerprinting analysis. (B) Transcriptional analysis of atpA and atpD by real-time qRT-PCR. Cells were harvested to prepare total RNA as described in the legend to Fig. 3A. Real-time qRT-PCR was performed as described in Materials and Methods. (C) Intracellular nucleotide level changes. Strain 1147 was inoculated in MR5 liquid medium with or without lincomycin (10 μg/ml) and then incubated at 30°C on a rotary shaker. At the growth phases indicated by arrows E, T, S1, and S2 in Fig. 3A, samples were prepared and analyzed by HPLC as described in Materials and Methods. All experiments were done in triplicate, and results are expressed as means ± standard deviations.
We also analyzed the expression of another gene, SLI3570, which encodes an enzyme involved in CDA biosynthesis. S. lividans cells that were grown with an optimal concentration of lincomycin (20 μg/ml) were subjected to real-time qRT-PCR analysis. As expected, lincomycin caused a remarkable increase in SLI3570 gene expression at the transcriptional level (Fig. 4C), which accounted for a burst in CDA production (Fig. 4B).
Lincomycin treatment alters the cytoplasmic protein profiles.
As a first step toward understanding the mechanisms by which lincomycin induces the production of secondary metabolites, we attempted to identify proteins that may have been involved in the marked differences between cells grown with or without lincomycin. S. coelicolor A3(2) was grown to the mid-exponential (E) and late stationary (S2 and S3) phases. After the extraction of total cellular proteins, these samples were analyzed by SDS-PAGE. The differences between the protein band patterns of samples prepared from cells with or without lincomycin were particularly pronounced for cells grown to the stationary phase (Fig. 5A). Several proteins (indicated by arrows 1 to 6) were considerably different in staining intensity for cells that were grown with or without lincomycin. In Fig. 5A, arrows 2, 3, and 6 indicate proteins that were abundant in cells grown with lincomycin but minimally expressed in cells grown without lincomycin, and arrows 1, 4, and 5 indicate the opposite results. Peptide mass fingerprinting analysis revealed that these protein bands were aconitate hydratase (band 1), elongation factor G (band 2), chaperonin GroEL (band 3), the FoF1 ATP synthase α subunit (band 4), the FoF1 ATP synthase β subunit (band 5), and ActVA-ORF4 (band 6). These proteins may provide important clues to solve the mechanism by which lincomycin caused increased antibiotic production.
Lincomycin treatment increases intracellular ATP levels.
The FoF1 ATP synthase α and β subunits are encoded by the atpA and atpD genes, respectively. We also found that the mRNA levels of the FoF1 ATP synthase α and β subunits in cells grown without lincomycin were higher than those in cells grown with lincomycin by 2.1- and 1.9-fold (mid-exponential phase), 1.8- and 1.9-fold (transition phase), and 1.2- and 1.2-fold (stationary phase, S1), respectively (Fig. 5B). These results clearly indicated that lincomycin treatment resulted in reduced levels of expression of the FoF1 ATP synthase α and β subunits at both the mRNA and protein levels.
FoF1 ATP synthase is a multisubunit integral membrane protein that is responsible for the majority of cellular ATP synthesis in all respiring organisms (43–46). It consists of two distinct components; hydrophobic Fo, which is embedded in the plasma membrane and acts as an ion translocator, and soluble F1, which extended into the cytoplasm and has catalytic activity for ATP synthesis and hydrolysis. On the basis of the results described above, we next investigated whether lincomycin had a significant effect on intracellular ATP levels. Despite the fact that lincomycin had a negative effect on the levels of expression of the FoF1 ATP synthase α and β subunits, the intracellular ATP levels determined at any growth stage were 2- to 4-fold higher in cells that were grown with lincomycin than in cells grown without lincomycin (Fig. 5C). The levels of other nucleoside triphosphates (GTP, UTP, and CTP) were also markedly increased, possibly because of enhanced synthesis of these nucleotides resulting from the elevated ATP levels, because of certain suppression of RNA synthesis, or both.
Versatility and applicability of the induction approach using low dose antibiotics.
We confirmed that lincomycin at subinhibitory concentrations also effectively enhances streptomycin production by S. griseus, reaching a 2.3-fold increase (Fig. 6). In this context, verifying whether an approach using low-dose antibiotics could be a versatile, applicable means to induce different actinomycete strains to produce secondary metabolites is one of the critical challenges for the future. Our results strongly suggest that the antibiotic lincomycin could induce secondary metabolism in actinomycetes. Likewise, production of the blue-pigmented antibiotic ACT by S. coelicolor A3(2) was enhanced in the vicinity of S. griseus or Saccharopolyspora erythraea, which produce streptomycin and erythromycin, respectively (Fig. 7). This indicates that the antibiotics streptomycin and erythromycin could surely induce ACT biosynthesis in S. coelicolor A3(2). Culturing of two different actinomycete strains on an agar, such as the result shown in Fig. 7, may be ideal so as not to miss a biphasic dose-response phenomenon of an antibiotic, i.e., those molecules that are antibacterial and inducing.
FIG 6.

Streptomycin production by S. griseus in liquid culture. Strain IFO 13189 was inoculated into SPY liquid medium that contained different concentrations of lincomycin and then incubated at 25°C with shaking for 4 days. Streptomycin production was determined as described in Materials and Methods.
FIG 7.

Cross-culture of S. coelicolor A3(2) with S. erythraea or S. griseus. S. coelicolor A3(2) 1147 (horizontal line) was cross-cultured with S. erythraea NRRL 2338 (A) or S. griseus IFO 13189 (B) (vertical line) on MR5 agar at 30°C for 8 days. Blue color represents the antibiotic ACT.
DISCUSSION
Hormesis is a biphasic dose-response phenomenon that is characterized by low-dose induction and high-dose inhibition (47). It has been reported that certain antibiotics exhibit hormesis, such as antibiotics that have bactericidal or bacteriostatic activity but induce considerable gene expression in bacteria at concentrations below their MIC (34, 35). Many studies of antibiotics at subinhibitory concentrations have investigated their effects, such as on transcription and as translation inhibitors on bacterial physiology and gene expression. In Escherichia coli, kasugamycin and puromycin, which are protein synthesis inhibitors that target ribosome subunit association and peptidyl-transferase activity, have been shown to increase the expression of ribosome proteins and mRNAs involved in the translational machinery. In addition, mupirocin, which targets isoleucyl-tRNA synthetase activity, has been shown to cause changes reminiscent of a stringent response (48). The protein synthesis inhibitors chloramphenicol and erythromycin alter the expression of genes involved in amino acid metabolism in B. subtilis 168 (49). In streptomycetes, the polyether antibiotics promomycin and monensin have been shown to induce antibiotic production by Streptomyces strains (50, 51). Rifampin, an RNA polymerase inhibitor, and oligomycin A, a mitochondrial ATP synthase inhibitor, cause changes in antibiotic (ACT or RED) production and aerial hyphal development in S. coelicolor (17).
In this report, we have provided experimental evidence that secondary metabolite production by S. coelicolor A3(2) and S. lividans was profoundly induced by exposure to ribosome-targeting antibiotics at concentrations below its MIC and the effect of lincomycin was particularly pronounced. In S. coelicolor A3(2), lincomycin at 1/10 of its MIC resulted in a marked increase in the expression of the pathway-specific regulatory gene actII-ORF4, which accounted for ACT overproduction. S. lividans grown in the presence of lincomycin at a subinhibitory concentration (1/12 or 1/3 of its MIC) produced abundant antibacterial compounds, including novel congeners of CDA, which were barely produced without lincomycin. These results indicate that lincomycin at concentrations below its MIC had a significant effect for inducing Streptomyces strains to produce secondary metabolites and suggest that an approach based on the dose-response effects of antibiotics would facilitate studying secondary metabolite production by streptomycetes and the discovery of new bioactive compounds.
Our next goal is to understand the mechanism by which lincomycin induces secondary metabolite production by Streptomyces strains. We previously showed that ribosome mutations and modifications altered gene expression in Streptomyces strains, which resulted in the overproduction of secondary metabolites (26, 30, 31). Using secondary metabolite-overproducing ribosome mutants of S. coelicolor A3(2) and Streptomyces sp. strain 631689, we also demonstrated the importance of maintaining a high level of protein synthesis during the stationary phase for inducing secondary metabolite production (30, 33). At concentrations higher than its MIC, lincomycin, a lincosamide antibiotic, inhibits protein synthesis by binding to the ribosomes of Gram-positive bacteria. Thus, it is possible that as with ribosome mutations and modifications, ribosome properties and concomitant protein synthesis can be modified by lincomycin at subinhibitory concentrations because lincomycin targets ribosome components. In any event, it is highly likely that modifying the translational apparatus holds the key for inducing the production of secondary metabolites in streptomycetes.
Lincomycin altered the expression of FoF1 ATP synthase and increased intracellular ATP levels. FoF1 ATP synthase is a multisubunit integral membrane protein that is a key enzyme in cellular energy metabolism, as it synthesizes the majority of cellular ATP from ADP and inorganic phosphate in all living cells (43–45). In S. coelicolor A3(2), lincomycin treatment resulted in markedly reduced expression of the α and β subunits in the F1 part of FoF1 ATP synthase, which catalyzes ATP synthesis/hydrolysis in the cytosol, concomitant with altering mRNA (at any growth stage) and protein (at late growth stages) levels (Fig. 5A and B). ATP is the major energy currency molecule in a cell that provides energy for enzymatic reactions and for various biological processes and is also a substrate for RNA synthesis. Therefore, it is understandable that the biomass dry weight (Fig. 2) and intracellular nucleotide pools (Fig. 5C) of S. coelicolor A3(2) tended to increase in the presence of lincomycin, which caused increased intracellular ATP levels. In this regard, it is noteworthy that ATP and its derivatives S-adenosyl-l-methionine and cyclic AMP are the regulatory molecules in Streptomyces spp. (52–54).
Although it is unclear whether there is a causal relationship between ACT overproduction and the observed high levels of ATP (Fig. 5C), our present findings appear to contradict the previous concept that high intracellular ATP levels would reduce antibiotic production by Streptomyces spp. (53). It is possible that high ATP levels enhanced the synthesis of S-adenosyl-l-methionine and/or cyclic AMP, ultimately resulting in ACT overproduction, because S-adenosyl-l-methionine and cyclic AMP are both known to be positive regulatory molecules during the initiation of microbial secondary metabolism (52, 54, 55). Alternatively, the increased ATP and GTP levels may have induced protein synthesis, particularly at the late growth phases, ultimately resulting in initiation of secondary metabolism, because protein synthesis requires large amounts of GTP and ATP as energy sources. Although we did not analyze protein synthesis activity in the present work, this proposition is consistent with the fact that certain ribosome mutants retain a high level of protein synthesis activity even at the late growth phase, a key event for promoting the dramatic induction of secondary metabolism in ribosome mutants (30, 33).
Besides techniques involved, our results may provide some clues for uncovering the “physiological” meaning (if any) of antibiotics in natural environments, including the possibility that antibiotics are signaling molecules for interspecific cell-to-cell communications, as a low concentration of each antibiotic could elicit pronounced effects (Fig. 1 and 7). Understanding the molecular mechanism by which lincomycin at concentrations below its MIC results in alteration of the cytoplasmic protein (FoF1 ATP synthase, etc.) profile and the increased intracellular ATP levels may provide clues for clarifying the mechanism underlying the dose-response effects of lincomycin on secondary metabolite production. However, several questions remain to be answered. (i) Why or how did lincomycin at subinhibitory concentrations alter the production of cytoplasmic proteins in S. coelicolor A3(2), despite the fact that in S. aureus there was no effect of subinhibitory lincosamide antibiotics on cytoplasmic protein production, as previously reported (36, 37)? (ii) Why did cells treated with lincomycin show high levels of ATP despite the reduced levels of ATP synthase? (iii) Assuming that there is a causal relationship between antibiotic overproduction and increased ATP levels, why did these high intracellular ATP levels promote secondary metabolite production by Streptomyces spp.? (iv) Did the intracellular ATP concentration actually affect the levels of intracellular S-adenosyl-l-methionine or cyclic AMP? (v) Did chloramphenicol and tetracycline also alter the cytoplasmic protein profile and increase intracellular ATP levels? RNA sequencing, an approach to transcriptome profiling, of a culture exposed to ribosome-targeting antibiotics may provide a clue to the answers to these questions. Although the mechanism of induction of secondary metabolite production in streptomycetes may be much more complex than it appears, our methods presented here are feasible and amenable to use with numerous bacterial species and for the overproduction and exploitation of novel secondary metabolites.
Supplementary Material
ACKNOWLEDGMENTS
This work was financially supported by a grant-in-aid for Young Scientists (A) to T.H. from the Japan Society for the Promotion of Science (JSPS) (no. 25712008).
We are grateful to M. Katayama (Nippon Suisan Kaisha, Ltd.) and K. Shimono (Shinshu University) for valuable discussion just before the submission of this report.
Footnotes
Supplemental material for this article may be found at http://dx.doi.org/10.1128/AEM.04214-14.
REFERENCES
- 1.Bibb MJ. 2005. Regulation of secondary metabolism in streptomycetes. Curr Opin Microbiol 8:208–215. doi: 10.1016/j.mib.2005.02.016. [DOI] [PubMed] [Google Scholar]
- 2.Kieser T, Bibb MJ, Buttner MJ, Chater KF, Hopwood DA. 2000. Practical Streptomyces genetics. The John Innes Foundation, Norwich, United Kingdom. [Google Scholar]
- 3.Bentley SD, Chater KF, Cerdeno-Tarraga AM, Challis GL, Thomson NR, James KD, Harris DE, Quail H, Kieser D, Harper D, Bateman A, Brown S, Chandra G, Chen CW, Collins M, Cronin A, Fraser A, Goble A, Hidalgo J, Hornsby T, Howarth S, Huang CH, Kieser T, Larke L, Murphy L, Oliver K, O'Neil S, Rabbinowitsch E, Rajandream MA, Rutherford K, Rutter S, Seeger K, Saunders D, Sharp S, Squares R, Squares S, Taylor K, Warren T, Wietzorrek A, Woodward J, Barrell BG, Parkhill J, Hopwood DA. 2002. Complete genome sequence of the model actinomycete Streptomyces coelicolor A3(2). Nature 417:141–147. doi: 10.1038/417141a. [DOI] [PubMed] [Google Scholar]
- 4.Ikeda H, Ishikawa J, Hanamoto A, Shinose M, Kikuchi H, Shiba T, Sakaki Y, Hattori M, Omura S. 2003. Complete genome sequence and comparative analysis of the industrial microorganism Streptomyces avermitilis. Nat Biotechnol 21:526–531. doi: 10.1038/nbt820. [DOI] [PubMed] [Google Scholar]
- 5.Ohnishi Y, Ishikawa J, Hara H, Suzuki H, Ikenoya M, Ikeda H, Yamashita A, Hattori M, Horinouchi S. 2008. Genome sequence of the streptomycin-producing microorganism Streptomyces griseus IFO 13350. J Bacteriol 190:4050–4060. doi: 10.1128/JB.00204-08. [DOI] [PMC free article] [PubMed] [Google Scholar]
- 6.Baltz RH. 2011. Strain improvement in actinomycetes in the postgenomic era. J Ind Microbiol Biotechnol 38:657–666. doi: 10.1007/s10295-010-0934-z. [DOI] [PubMed] [Google Scholar]
- 7.Chiang YM, Chang SL, Oakley BR, Wang CC. 2011. Recent advances in awakening silent biosynthetic gene clusters and linking orphan clusters to natural products in microorganisms. Curr Opin Chem Biol 15:137–143. doi: 10.1016/j.cbpa.2010.10.011. [DOI] [PMC free article] [PubMed] [Google Scholar]
- 8.Genilloud O. 2014. The re-emerging role of microbial natural products in antibiotic discovery. Antonie Van Leeuwenhoek 106:173–188. doi: 10.1007/s10482-014-0204-6. [DOI] [PubMed] [Google Scholar]
- 9.Ochi K, Hosaka T. 2013. New strategies for drug discovery: activation of silent or weakly expressed microbial gene clusters. Appl Microbiol Biotechnol 97:87–98. doi: 10.1007/s00253-012-4551-9. [DOI] [PMC free article] [PubMed] [Google Scholar]
- 10.Ochi K, Tanaka Y, Tojo S. 2014. Activating the expression of bacterial cryptic genes by rpoB mutations in RNA polymerase or by rare earth elements. J Ind Microbiol Biotechnol 41:403–414. doi: 10.1007/s10295-013-1349-4. [DOI] [PubMed] [Google Scholar]
- 11.Wu MC, Law B, Wilkinson B, Micklefield J. 2012. Bioengineering natural product biosynthetic pathways for therapeutic applications. Curr Opin Biotechnol 23:931–940. doi: 10.1016/j.copbio.2012.03.008. [DOI] [PubMed] [Google Scholar]
- 12.Yoon V, Nodwell JR. 2014. Activating secondary metabolism with stress and chemicals. J Ind Microbiol Biotechnol 41:415–424. doi: 10.1007/s10295-013-1387-y. [DOI] [PubMed] [Google Scholar]
- 13.Zhu H, Sandiford SK, Wezel GP. 2014. Triggers and cues that activate antibiotic production by actinomycetes. J Ind Microbiol Biotechnol 41:371–386. doi: 10.1007/s10295-013-1309-z. [DOI] [PubMed] [Google Scholar]
- 14.Bode HB, Bethe B, Hofs R, Zeeck A. 2002. Big effects from small changes: possible ways to explore nature's chemical diversity. Chembiochem 3:619–627. doi:. [DOI] [PubMed] [Google Scholar]
- 15.Craney A, Ozimok C, Pimentel-Elardo SM, Capretta A, Nodwell JR. 2012. Chemical perturbation of secondary metabolism demonstrates important links to primary metabolism. Chem Biol 19:1020–1027. doi: 10.1016/j.chembiol.2012.06.013. [DOI] [PubMed] [Google Scholar]
- 16.Onaka H, Mori Y, Igarashi Y, Furumai T. 2011. Mycolic acid-containing bacteria induce natural-product biosynthesis in Streptomyces species. Appl Environ Microbiol 77:400–406. doi: 10.1128/AEM.01337-10. [DOI] [PMC free article] [PubMed] [Google Scholar]
- 17.Romero D, Traxler MF, Lopez D, Kolter R. 2011. Antibiotics as signal molecules. Chem Rev 111:5492–5505. doi: 10.1021/cr2000509. [DOI] [PMC free article] [PubMed] [Google Scholar]
- 18.Schroeckh V, Scherlach K, Nutzmann HW, Shelest E, Schmidt-Heck W, Schuemann J, Martin K, Hertweck C, Brakhage AA. 2009. Intimate bacterial-fungal interaction triggers biosynthesis of archetypal polyketides in Aspergillus nidulans. Proc Natl Acad Sci U S A 106:14558–14563. doi: 10.1073/pnas.0901870106. [DOI] [PMC free article] [PubMed] [Google Scholar]
- 19.Yamanaka K, Oilawa H, Ogawa HO, Hosono K, Shinmachi F, Takano H, Sakuda S, Beppu T, Ueda K. 2005. Desferrioxamine E produced by Streptomyces griseus stimulates growth and development of Streptomyces tanashiensis. Microbiology 151:2899–2905. doi: 10.1099/mic.0.28139-0. [DOI] [PubMed] [Google Scholar]
- 20.Gomez-Escribano JP, Bibb MJ. 2014. Heterologous expression of natural product biosynthetic gene clusters in Streptomyces coelicolor: from genome mining to manipulation of biosynthetic pathways. J Ind Microbiol Biotechnol 41:425–431. doi: 10.1007/s10295-013-1348-5. [DOI] [PubMed] [Google Scholar]
- 21.Smanski MJ, Peterson RM, Rajski SR, Shen B. 2009. Engineered Streptomyces platensis strains that overproduce antibiotics platensimycin and platencin. Antimicrob Agents Chemother 53:1299–1304. doi: 10.1128/AAC.01358-08. [DOI] [PMC free article] [PubMed] [Google Scholar]
- 22.Laureti L, Song L, Huang S, Corre C, Leblond P, Challis GL, Aigle B. 2011. Identification of a bioactive 51-membered macrolide complex by activation of a silent polyketide synthase in Streptomyces ambofaciens. Proc Natl Acad Sci U S A 108:6258–6263. doi: 10.1073/pnas.1019077108. [DOI] [PMC free article] [PubMed] [Google Scholar]
- 23.Yanai K, Murakami T, Bibb MJ. 2006. Amplification of the entire kanamycin biosynthetic gene cluster during empirical strain improvement of Streptomyces kanamyceticus. Proc Natl Acad Sci U S A 103:9661–9666. doi: 10.1073/pnas.0603251103. [DOI] [PMC free article] [PubMed] [Google Scholar]
- 24.Zhuo Y, Zhang W, Chen D, Gao H, Tao J, Liu M, Gou Z, Zhou X, Ye BC, Zhang Q, Zhang S, Zhang LX. 2010. Reverse biological engineering of hrdB to enhance the production of avermectins in an industrial strain of Streptomyces avermitilis. Proc Natl Acad Sci U S A 107:11250–11254. doi: 10.1073/pnas.1006085107. [DOI] [PMC free article] [PubMed] [Google Scholar]
- 25.Imai Y, Fujiwara T, Ochi K, Hosaka T. 2012. Development of the ability to produce secondary metabolites in Streptomyces through the acquisition of erythromycin resistance. J Antibiot (Tokyo) 65:323–326. doi: 10.1038/ja.2012.16. [DOI] [PubMed] [Google Scholar]
- 26.Nishimura K, Hosaka T, Tokuyama S, Okamoto S, Ochi K. 2007. Mutations in rsmG, encoding a 16S rRNA methyltransferase, result in low-level streptomycin resistance and antibiotic overproduction in Streptomyces coelicolor A3(2). J Bacteriol 189:3876–3883. doi: 10.1128/JB.01776-06. [DOI] [PMC free article] [PubMed] [Google Scholar]
- 27.Shima J, Hesketh A, Okamoto S, Kawamoto S, Ochi K. 1996. Induction of actinorhodin production by rpsL (encoding ribosomal protein S12) mutations that confer streptomycin resistance in Streptomyces lividans and Streptomyces coelicolor A3(2). J Bacteriol 178:7276–7284. [DOI] [PMC free article] [PubMed] [Google Scholar]
- 28.Wang G, Hosaka T, Ochi K. 2008. Dramatic activation of antibiotic production in Streptomyces coelicolor by cumulative drug resistance mutations. Appl Environ Microbiol 74:2834–2840. doi: 10.1128/AEM.02800-07. [DOI] [PMC free article] [PubMed] [Google Scholar]
- 29.Xu J, Tozawa Y, Lai C, Hayashi H, Ochi K. 2002. A rifampicin resistance mutation in the rpoB gene confers ppGpp-independent antibiotic production in Streptomyces coelicolor A3(2). Mol Genet Genomics 268:179–189. doi: 10.1007/s00438-002-0730-1. [DOI] [PubMed] [Google Scholar]
- 30.Hosaka T, Ohnishi-Kameyama M, Muramatsu H, Murakami K, Tsurumi Y, Kodani S, Yoshida M, Fujie A, Ochi K. 2009. Antibacterial discovery in actinomycetes strains with mutations in RNA polymerase or ribosomal protein S12. Nat Biotechnol 27:462–464. doi: 10.1038/nbt.1538. [DOI] [PubMed] [Google Scholar]
- 31.Ochi K, Okamoto S, Tozawa Y, Inaoka T, Hosaka T, Xu J, Kurosawa K. 2004. Ribosome engineering and secondary metabolite production. Adv Appl Microbiol 56:155–184. doi: 10.1016/S0065-2164(04)56005-7. [DOI] [PubMed] [Google Scholar]
- 32.Tanaka Y, Kasahara K, Hirose Y, Murakami K, Kugimiya R, Ochi K. 2013. Activation and products of the cryptic secondary metabolite biosynthetic gene clusters by rifampicin resistance (rpoB) mutations in actinomycetes. J Bacteriol 195:2959–2970. doi: 10.1128/JB.00147-13. [DOI] [PMC free article] [PubMed] [Google Scholar]
- 33.Hosaka T, Xu J, Ochi K. 2006. Increased expression of ribosome recycling factor is responsible for the enhanced protein synthesis during the late growth phase in an antibiotic-overproducing Streptomyces coelicolor ribosomal rpsL mutant. Mol Microbiol 61:883–897. doi: 10.1111/j.1365-2958.2006.05285.x. [DOI] [PubMed] [Google Scholar]
- 34.Davies J, Spiegelman GB, Yim G. 2006. The world of subinhibitory antibiotic concentrations. Curr Opin Microbiol 9:445–453. doi: 10.1016/j.mib.2006.08.006. [DOI] [PubMed] [Google Scholar]
- 35.Yim G, Wang HH, Davies J. 2006. The truth about antibiotics. Int J Med Microbiol 296:163–170. doi: 10.1016/j.ijmm.2006.01.039. [DOI] [PubMed] [Google Scholar]
- 36.Shibl MA. 1993. Effect of antibiotics on production of enzymes and toxins by microorganisms. Rev Infect Dis 5:865–875. [DOI] [PubMed] [Google Scholar]
- 37.Herbert S, Barry P, Novick PR. 2001. Subinhibitory clindamycin differentially inhibits transcription of exoprotein genes in Staphylococcus aureus. Infect Immun 69:2996–3003. doi: 10.1128/IAI.69.5.2996-3003.2001. [DOI] [PMC free article] [PubMed] [Google Scholar]
- 38.Huang J, Lih CJ, Pan KH, Cohen SN. 2001. Global analysis of growth phase responsive gene expression and regulation of antibiotic biosynthetic pathways in Streptomyces coelicolor using DNA microarrays. Genes Dev 15:3183–3192. doi: 10.1101/gad.943401. [DOI] [PMC free article] [PubMed] [Google Scholar]
- 39.Ochi K. 1987. Metabolic initiation of differentiation and secondary metabolism by Streptomyces griseus: significance of the stringent response (ppGpp) and GTP content in relation to A factor. J Bacteriol 169:3608–3616. [DOI] [PMC free article] [PubMed] [Google Scholar]
- 40.Tanaka Y, Hosaka T, Ochi K. 2010. Rare earth elements activate the secondary metabolite-biosynthetic gene clusters in Streptomyces coelicolor A3(2). J Antibiot (Tokyo) 63:477–481. doi: 10.1038/ja.2010.53. [DOI] [PubMed] [Google Scholar]
- 41.Neary JM, Powell A, Gordon L, Milne C, Flett F, Wilkinson B, Smith CP, Micklefield J. 2007. An asparagine oxygenase (AsnO) and a 3-hydroxyasparaginyl phosphotransferase (HasP) are involved in the biosynthesis of calcium-dependent lipopeptide antibiotics. Microbiology 153:768–776. doi: 10.1099/mic.0.2006/002725-0. [DOI] [PubMed] [Google Scholar]
- 42.Gramajo HC, Takano E, Bibb MJ. 1993. Stationary-phase production of the antibiotic actinorhodin in Streptomyces coelicolor A3(2) is transcriptionally regulated. Mol Microbiol 7:837–845. doi: 10.1111/j.1365-2958.1993.tb01174.x. [DOI] [PubMed] [Google Scholar]
- 43.Capaldi RA, Aggeler R. 2002. Mechanism of the F(1)F(0)-type ATP synthase, a biological rotary motor. Trends Biochem Sci 27:154–160. doi: 10.1016/S0968-0004(01)02051-5. [DOI] [PubMed] [Google Scholar]
- 44.Senior AE. 2007. ATP synthase: motoring to the finish line. Cell 130:220–221. doi: 10.1016/j.cell.2007.07.004. [DOI] [PubMed] [Google Scholar]
- 45.Senior AE. 1990. The proton-translocating ATPase of Escherichia coli. Annu Rev Biophys Biophys Chem 19:7–41. doi: 10.1146/annurev.bb.19.060190.000255. [DOI] [PubMed] [Google Scholar]
- 46.Soga N, Kinosita K Jr, Yoshida M, Suzuki T. 2011. Efficient ATP synthesis by thermophilic Bacillus FoF1-ATP synthase. FEBS J 278:2647–2654. doi: 10.1111/j.1742-4658.2011.08191.x. [DOI] [PMC free article] [PubMed] [Google Scholar]
- 47.Calabrese EJ, Baldwin LA. 2003. Hormesis: the dose-response revolution. Annu Rev Pharmacol Toxicol 43:175–197. doi: 10.1146/annurev.pharmtox.43.100901.140223. [DOI] [PubMed] [Google Scholar]
- 48.Sabina J, Dover N, Templeton LJ, Smulski DR, Soll D, LaRossa RA. 2003. Interfering with different steps of protein synthesis explored by transcriptional profiling of Escherichia coli K-12. J Bacteriol 185:6158–6170. doi: 10.1128/JB.185.20.6158-6170.2003. [DOI] [PMC free article] [PubMed] [Google Scholar]
- 49.Lin JT, Connelly MB, Amolo C, Otani S, Yaver DS. 2005. Global transcriptional response of Bacillus subtilis to treatment with subinhibitory concentrations of antibiotics that inhibit protein synthesis. Antimicrob Agents Chemother 49:1915–1926. doi: 10.1128/AAC.49.5.1915-1926.2005. [DOI] [PMC free article] [PubMed] [Google Scholar]
- 50.Amano S, Morota T, Kano YK, Narita H, Hashidzume T, Yamamoto S, Mizutani K, Sakuda S, Furihata K, Takano-Shiratori H, Takano H, Beppu T, Ueda K. 2010. Promomycin, a polyether promoting antibiotic production in Streptomyces spp. J Antibiot 63:486–491. doi: 10.1038/ja.2010.68. [DOI] [PubMed] [Google Scholar]
- 51.Amano S, Sakurai T, Keisuke E, Takano H, Beppu T, Furihata K, Sakuda S, Ueda K. 2011. A cryptic antibiotic triggered by monensin. J Antibiot 64:703. doi: 10.1038/ja.2011.69. [DOI] [PubMed] [Google Scholar]
- 52.Horinouchi S, Ohnishi Y, Kang DK. 2001. The A-factor regulatory cascade and cAMP in the regulation of physiological and morphological development in Streptomyces griseus. J Ind Microbiol Biotechnol 27:177–182. doi: 10.1038/sj.jim.7000068. [DOI] [PubMed] [Google Scholar]
- 53.Meng L, Li M, Yang SH, Kim TJ, Suh JW. 2011. Intracellular ATP levels affect secondary metabolite production in Streptomyces spp. Biosci Biotechnol Biochem 75:1576–1581. doi: 10.1271/bbb.110277. [DOI] [PubMed] [Google Scholar]
- 54.Okamoto S, Lezhava A, Hosaka T, Okamoto-Hosoya Y, Ochi K. 2003. Enhanced expression of S-adenosylmethionine synthetase causes overproduction of actinorhodin in Streptomyces coelicolor A3(2). J Bacteriol 185:601–609. doi: 10.1128/JB.185.2.601-609.2003. [DOI] [PMC free article] [PubMed] [Google Scholar]
- 55.Tojo S, Kim JY, Tanaka Y, Inaoka T, Hiraga Y, Ochi K. 2014. The mthA mutation conferring low-level resistance to streptomycin enhances antibiotic production in Bacillus subtilis by increasing the S-adenosylmethionine pool size. J Bacteriol 196:1514–1524. doi: 10.1128/JB.01441-13. [DOI] [PMC free article] [PubMed] [Google Scholar]
- 56.Oliynyk M, Samborskyy M, Lester JB, Mironenko T, Scott N, Dickens S, Haydock SF, Leadlay PF. 2007. Complete genome sequence of the erythromycin-producing bacterium Saccharopolyspora erythraea NRRL23338. Nat Biotechnol 25:447–453. doi: 10.1038/nbt1297. [DOI] [PubMed] [Google Scholar]
Associated Data
This section collects any data citations, data availability statements, or supplementary materials included in this article.