Abstract
Zebrafish are increasingly being used as a model of vertebrate cardiology due to mammalian-like cardiac properties in many respects. The size and fecundity of zebrafish make them suitable for large-scale genetic and pharmacological screening. In larger mammalian hearts, optical mapping is often used to investigate the interplay between voltage and calcium dynamics and to investigate their respective roles in arrhythmogenesis. This report outlines the construction of an optical mapping system for use with zebrafish hearts, using the voltage-sensitive dye RH 237 and the calcium indicator dye Rhod-2 using two industrial-level CCD cameras. With the use of economical cameras and a common 532-nm diode laser for excitation, the rate dependence of voltage and calcium dynamics within the atrial and ventricular compartments can be simultaneously determined. At 140 beats/min, the atrial action potential duration was 36 ms and the transient duration was 53 ms. With the use of a programmable electrical stimulator, a shallow rate dependence of 3 and 4 ms per 100 beats/min was observed, respectively. In the ventricle the action potential duration was 109 ms and the transient duration was 124 ms, with a steeper rate dependence of 12 and 16 ms per 100 beats/min. Synchronous electrocardiograms and optical mapping recordings were recorded, in which the P-wave aligns with the atrial voltage peak and R-wave aligns with the ventricular peak. A simple optical pathway and imaging chamber are detailed along with schematics for the in-house construction of the electrocardiogram amplifier and electrical stimulator. Laboratory procedures necessary for zebrafish heart isolation, cannulation, and loading are also presented.
Keywords: action potential, calcium dynamics, teleost heart, Rhod-2, RH 237
zebrafish are a popular model of vertebrate cardiology due to similarities to human cardiac electrical activity, including comparable heart rates, action potential, and plateau phase durations and similar susceptibility to clinically relevant drugs (28). In zebrafish, as well as humans, the rapidly activating, delayed rectifier K+ current (IKr) is essential for normal cardiac repolarization and the zebrafish is an important animal model of long-QT2 (1). The gene kcnh2 has been identified as the zebrafish ortholog of hERG1 (sometimes referred to as zERG), and the zebrafish heart expresses channels with similar biophysical characteristics (30). Loss of knch2 produces bradycardia, repolarization disorders, and ventricular asystole depending on the severity of the disruption (1). Similarly, drugs that inhibit IKr in humans produce bradycardia and atrioventricular (AV) block in zebrafish embryos (26).
Reductions in repolarizing currents increase the likelihood of early afterdepolarization events, strongly arrhythmogenic events that often precede Torsades des Pointes, polymorphic ventricular tachycardia, and ventricular fibrillation rhythms (34). Reduced repolarization increases the time at critical membrane potentials in which L-type calcium channels can recover from inactivation (−30 to 0 mV). Increase in channel availability, during the action potential repolarization, can lead to calcium channel reactivation and early afterdepolarization events. Delayed repolarization may also increase sarcoplasmic reticulum (SR) calcium load by reducing calcium efflux through the sodium calcium exchanger (NCX). High SR calcium loads may lead to spontaneous calcium release and further depolarization through forward-mode NCX and subsequent calcium-channel reactivation.
The interplay between voltage and calcium in the heart is a critical component of most arrhythmias including long-QT pathologies. Consistent with the accessibility, affordability, and fecundity of zebrafish and its use to model cardiac diseases, an inexpensive optical mapping approach was devised to simultaneously record voltage and calcium dynamics, using the previously established combination of the potentiometric dye RH 237 and the calcium-sensitive dye Rhod-2 (5). In isolated spontaneously beating zebrafish hearts, the system records atrial and ventricular action potential durations (APD) and AV delay in addition to the calcium transients. Simultaneous acquisition of the zebrafish electrocardiogram (ECG) allows changes in atrial and ventricular action potential recordings to be correlated with their respective P-wave, QRS complex, and T-wave components. For examining heart rate-dependent changes, a programmable electrical cell stimulator was designed for steady-state and variable-rate protocols. To minimize costs, system modules were made in house with commonly available parts and the componentry and construction are detailed.
Simultaneous optical mapping and ECG recordings required rapid removal of the zebrafish hearts, followed by extensive handling and precise positioning to ready the hearts for imaging. To decrease the time and skill necessary to isolate a heart without altering the cardiac rhythm, a caudal surgical approach is outlined. To facilitate handling and positioning, hearts were cannulated through the bulbus arteriosus onto a small (34 g) needle.
MATERIALS AND METHODS
Solutions.
Calcium Tyrode solution containing (in mM) 117 NaCl, 5.7 KCl, 4.4 NaHCO3, 1.5 NaH2PO4, 1.7 MgCl2, 10 Na-HEPES (C8H17N2O4S), 5 glucose, 5 creatine, 5 Na-pyruvic acid, and 1.8 CaCl2 (pH = 7.3) was used in all procedures. Stock solutions of 10 mM (-)-blebbistatin (Sigma-Aldrich, St. Louis, MO) and 5 mM RH 237 (Molecular Probes, Eugene, OR) dissolved in 100% DMSO were kept at −20°C and were used at 15 μM (0.15% DMSO) and 8 μM (0.16% DMSO) final concentrations, respectively. Warming of blebbistatin before dilution increased the consistency of inhibition of cardiac contraction (31). Fresh aliquots of Rhod-2 AM (Molecular Probes) gave the largest transient sizes with the lowest background levels. Aliquots of 1 mM Rhod-2 (100% DMSO) were prepared every 3–5 days and were used at a final concentration of 10 μM (1% DMSO).
Zebrafish heart isolation procedure.
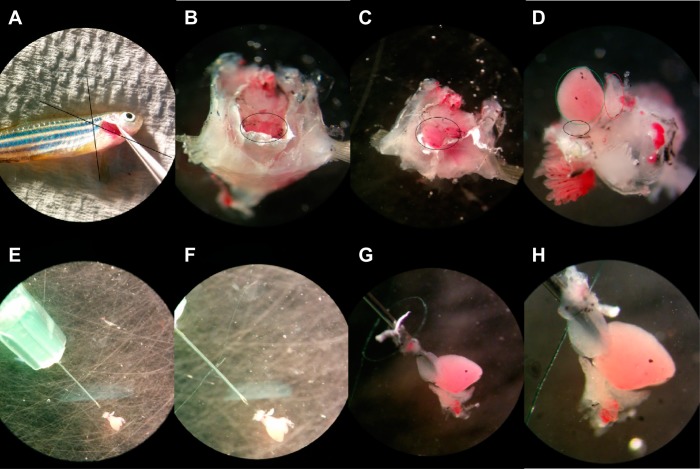
Adult zebrafish, ∼30–35 mm in length, were purchased locally and kept at 28°C, in accordance with the principles established by the Canadian Council on Animal Care and the experimental protocols were approved by the Simon Fraser University Animal Care Committee. After the fish were euthanized by an ice bath, the heart was approached from the caudal aspect by removing a triangular wedge of tissue between the gills and pectoral fins as shown in Fig. 1. The fish was decapitated by lifting the operculum and cutting at the base of the gills. Another cut was made at the base of the pectoral fin. The tissue wedge was transferred to the lid of a 100-mm Petri dish that was coated with a thin layer of SYLGARD 184 (Dow Corning, Midland MI), allowing the needle to approach the heart at a very shallow angle during cannulation. The tissue wedge was positioned to view the caudal aspect and gentle tension was applied to the pectoral fins to further open the pericardial cavity. Rate and rhythm were recorded immediately after the heart was freed to determine the effect of isolation, cannulation, blebbistatin loading, and dye loading. For cannulation, a 1-ml syringe was partially filled with Tyrode solution and a 34-gauge needle (Harvard Apparatus, Holliston, MA) mounted. A surgical tie, from a single strand of surgical thread, was positioned onto the needle shaft. The needle tip was positioned very close to the bottom of the Petri dish with the lowest possible entrance angle, such that the bulbus could be moved laterally onto the needle without lifting the heart. Holding the distal aspect of the bulbus, the needle was inserted into the lumen of the bulbus and secured with the surgical tie above the bevelled tip. If required, the needle tip can also be placed within the ventricular lumen, navigating through the ventricular valve.
Fig. 1.
Caudal zebrafish heart isolation procedure. A: incisions at the base of the gills and at the base of the pectoral fin allow access to the pericardial space. B: pericardium (black oval) is visible from the caudal aspect. C: tension on the pectoral fins expands access to the heart. D: removal of the surrounding tissue reveals the bulbus arteriosus (black oval), atrium (red oval), and ventricle (green oval). E: needle tip is positioned along bottom of the Petri dish. F: pretied surgical knot, using a single strand of surgical thread, is positioned onto the needle before cannulation. G: needle tip is inserted into the bulbus arteriosus. H: heart is secured onto the needle by tightening the surgical knot onto bulbus arteriosus.
Dye and blebbistatin loading.
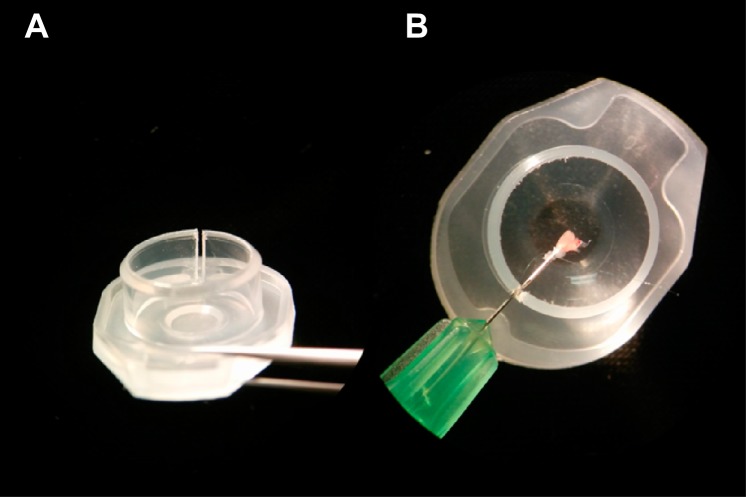
To minimize the risk of decannulation during dye loading, a loading chamber was made from the lid of a 1.5-ml microcentrifuge tube using flush-cut wire cutters to cut a slit along the sidewall as shown in Fig. 2. Separate chambers were filled (∼250 μl) with RH 237 (8 μM), blebbistatin (15 μM), and Rhod-2 AM (10 μM). Incubation in the blebbistatin solution suppressed contraction, and its effects were concentration and time dependent. Inhibition of contraction by blebbistatin could be negated by prolonged and/or intense laser exposure, and the best motion suppression occurred with short laser exposure times separated by long periods of reincubation. For this reason, the imaging chamber was also filled with 15 μM blebbistatin. Rough handling of the preparation also negated the blebbistatin-induced inhibition of contraction and thus gentle handling was necessary.
Fig. 2.
Loading chamber for cannulated zebrafish hearts. Left: a ∼0.5 mm slit is cut into the cap of a 1.5-ml microcentrifuge tube. Right: needle shaft, with a cannulated heart, passes through the slit while the 250 μl of loading solution is retained by surface tension.
RH 237 was easily retained by the zebrafish cardiomyocytes and was therefore loaded first for 15 min. Loading levels were confirmed by fluorescence imaging. If loading is insufficient, hearts can be reloaded in short increments to increase signal intensity while avoiding over loading, which saturates the camera sensor. Sustained laser exposure results in photobleaching and should be avoided. After RH 237 loading was completed, the hearts were incubated in blebbistatin until quiescent, which took 30–60 min at 15 μM. Blebbistatin could also be used at 10 μM with reduced laser exposure limits and increased incubation times. When the time course of the blebbistatin effect was of interest, hearts were imaged under normal white light since the excitation light for fluorescence imaging caused photo release of the blebbistatin inhibitory effect. The quiescent heart was then transferred into the Rhod-2 AM solution for 15 min and then transferred to the imaging chamber where internalized Rhod-2 would continue to deesterify, leading to increased signal intensity. Rhod-2 was susceptible to leak as well as photobleaching, which limited the available window for image acquisition to about 1 h after loading, depending on overall laser exposure. Hearts could be reloaded in Rhod-2 AM during longer experiments, however, background fluorescence levels were increased.
Illumination system.
The diminutive size of the zebrafish heart (∼1 mm2) made adequate illumination with arc lamps, fiber lights, and light-emitting diodes cumbersome due their broad color spectra and poor beam qualities. A >200-mW green 532 nm DPSS laser (LCS-0532, Laserglow Technologies, Toronto, Canada) was selected due to its affordability and longevity, with continuous run times greater than 5,000 h. Laser power on the unit received was rated at 334 mW. Because of the narrow color spectrum, precise color filtering was not required. An additional hot mirror (FM01, Thorlabs, Newton, NJ) was used to remove the small amount of infrared light (808 nm light from the pumping diode) remaining in the output beam.
To use the laser output for general illumination, the small beam (nominally 1.5 mm in diameter) was expanded to illuminate the entire zebrafish heart. A beam expander was constructed using two positive focal length lenses to form a Keplerian telescope, separated by a distance equal to the sum of their focal lengths. The expansion ratio is simply the ratio between their focal lengths (expansion ratio = f2/f1). In Fig. 3, a fivefold beam expander is shown using f1 (30 mm, LA1805-A, Thorlabs) and f2 (150 mm, LA1433-A, Thorlabs), arranged with a separation distance of 180 mm. The first beam expander was coupled to a second beam expander with a 2.5-fold expansion ratio, formed with lenses with focal length f3 (30 mm) and f4 (75 mm) with a separation distance of 105 mm. The total beam expansion was 12.5-fold and was independent of the separation distance between the two beam expanders.
Fig. 3.
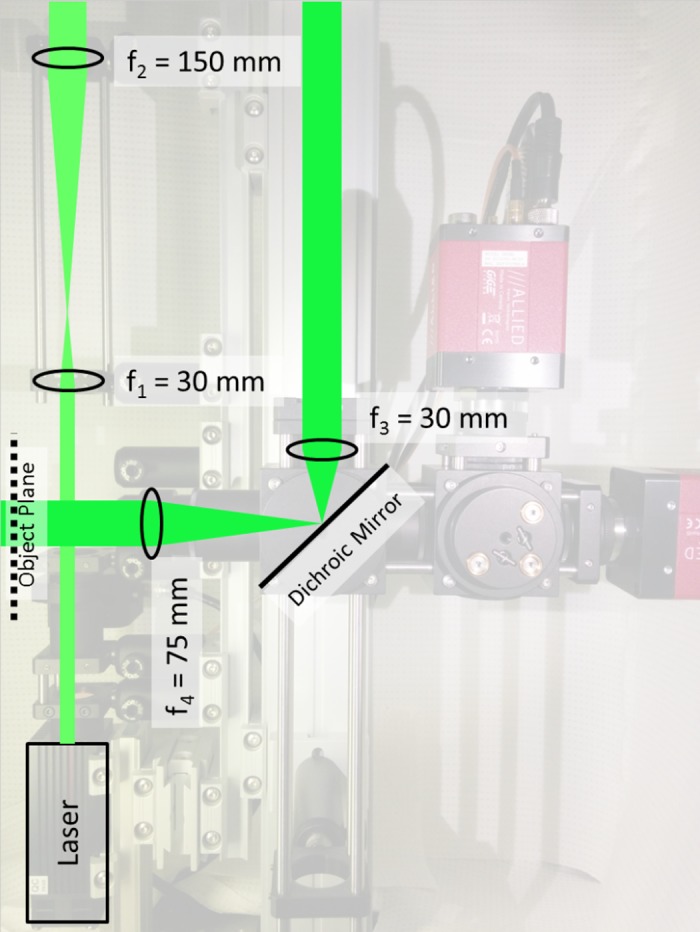
Diagram of the laser illumination system. Output from the laser head is expanded by two Keplerian beam expanders before illuminating the zebrafish heart. The first beam expander is formed by f1 and f2 and is separated by a distance of f1+f2. For f1 = 30 mm and f2 = 150 mm, the separation distance is 180 mm. The second beam expander is formed by f3 (30 mm) and f4 (75 mm) with a separation distance of 105 mm. A dichroic mirror is positioned between f3 and f4 to reflect the light toward the imaging chamber.
Imaging system.
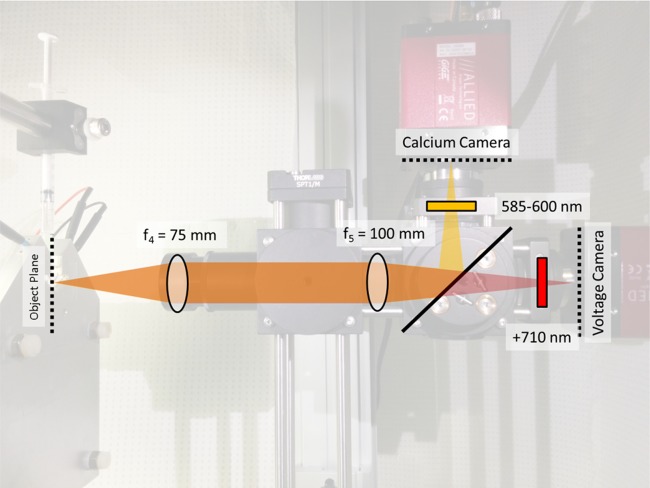
The imaging optics magnified and separated the voltage and calcium fluorescent images. The imaging system had two lens, an objective lens (f4 = 75 mm, LA1608-A, Thorlabs) and a camera lens (f5 = 100 mm, LA1509-A, Thorlabs) in an afocal arrangement, as shown in Fig. 4. The afocal arrangement, similar to the concept of “infinity optics” in microscopy, meant that the separation distance between the objective lens and the camera lens does not change the system magnification, allowing the illumination system to be accommodated. The magnification was f5/f4 or 1.33-fold magnification for these two lenses specifically. Because the final image also included an air-water interface, the final magnification of the system was slightly higher. System magnification can be adjusted to accommodate different fields of view, such as for different sensors sizes or different heart sizes, by changing the focal lengths of f4 and f5. The focal length of the camera lens (f5) was selected to be long enough to accommodate a 630-nm long pass dichroic mirror (XF2021, 630DRLP, Omega Optical, Brattleboro, VT) so that both the calcium image and the voltage image could be detected simultaneously on two detectors. The calcium Rhod-2 signal was reflected upwards while the voltage RH 237 signal passed through the dichroic mirror. The spectrum of the calcium signal was further restricted by a 565- to 600-nm band-pass filter (XF3412, 580QM30, Omega Optical). Likewise, the spectrum of the voltage signal was further restricted by a 700-nm long-pass filter (XF3095, 700ALP, Omega Optical).
Fig. 4.
Diagram of the imaging system. Fluorescence from the zebrafish heart is imaged through two lenses in an afocal arrangement. The zebrafish heart is located at the focal point of f4 (75 mm), and the image is located at the rear focal point of f5 (100 mm). A 630-nm long-pass dichroic mirror, after f5, reflects the calcium signal while allowing the voltage signal to be transmitted. A 585- to 600-nm band-pass filter and 700-nm long-pass filters precede each camera.
The illumination system was coupled to the imaging system by way of a 560-nm long-pass dichroic (XF2017, 560DRLP, Omega Optical) located between f4 and f5. The mirror reflects wavelengths shorter than 560 nm, such as the 532-nm light from the laser, while transmitting longer wavelengths signals associated with voltage and calcium fluorescent. Since the objective lens (f4) and camera lens (f5) were in an afocal arrangement, the extra length required to fit the additional dichroic mirror did not change the system magnification.
Imaging chamber.
A simple top-loading imaging chamber can be made with only a small hole in a length of one-quarter inch aluminum bar, with the open sides sealed with microscope coverslips and vacuum grease. To increase the flexibility of the imaging chamber, additional injection, suction, and electrode ports were created by drilling angled holes through the edges of the aluminum bar as shown in Fig. 5. Angled ports prevented fluid from leaking out of the chamber when the ports were not in use. The fluid injection ports feed into two inlets that helped dissipate turbulence during fluid injection. Suction ports were connected to a gentle vacuum to remove chamber overflow during fluid injection. Two electrode ports were also included for stimulation and ECG recording electrodes. Anodizing the imaging chamber reduced corrosion and prevented the aluminum from forming an electrolytic cell with the silver-chloride ECG electrodes.
Fig. 5.
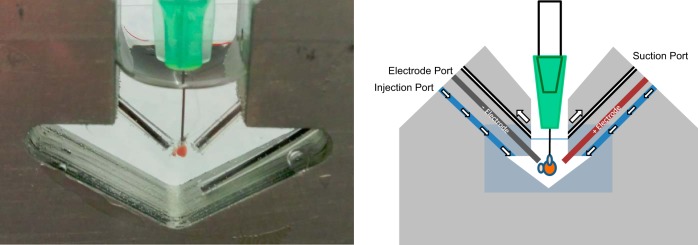
Anodized aluminum imaging chamber. Left: photograph of a cannulated zebrafish heart inside the sealed imaging chamber. Front and rear windows to the chambers are formed with microscope coverslips and a thin layer of vacuum grease. Atrial and ventricular electrodes reside within electrode ports, whereas the grounding electrode resides in a fluid injection port. Right: schematic outlining the positioning of the heart and the locations of the suction, electrode, and injection ports.
Camera setup.
This optical mapping system used a pair of GE680 CCD cameras (Allied Vision Technologies) with the following specifications: 640 × 480 pixels, 205 frames per second, and a peak quantum efficiency of 55%. Cameras with similar specifications are typical in machine vision applications and are readily available from a variety of vendors. The GE680 cameras communicate using a GigaBit Ethernet network connection (GigE), making them compatible with most computers. A memory of 1 GB held around 3,000 images or around 15 s of video (640 × 480, 205 fps, 8-bit images). Images can be acquired through high-level programming environments such as LabVIEW (National Instruments, Austin, TX), MATLAB (The MathWorks, Natick, MA), or Interactive Data Language (Exelis Visual Information Solutions, Boulder, CO).
Optical mapping requires appropriate spatial and temporal resolutions, which were both limited by the specifications of the camera detectors. Spatial resolution can be increased with higher optical magnification at the loss of field of view. Temporal resolution is limited, in part, by camera acquisition speeds and the time it takes to send each frame to the computer; consequently smaller frames give faster frame rates. To isolate a region of interest (ROI) while maintaining spatial resolution, the digital field of view can be reduced in the camera settings to trim away noncontributing areas. Frame rates can also be increased by having the camera create “superpixels” through pixel binning. In pixel binning, the camera adds together intensity values from multiple pixels, which reduces the frame size and is especially useful under low light conditions, but at the expense of a loss in spatial resolution. Under low light conditions, image intensity can also be increased by reducing the frame rate, which allows the signal to be integrated over a longer duration therefore resulting in reduced temporal resolution.
Electrocardiography.
The ECG recordings required recording electrodes, signal amplification, and digitization. Silver chloride (AgCl) recording electrodes were fabricated using 0.5-mm silver wire (part no: 327026, Sigma-Aldrich). On a piece of regular stranded wire, 35 mm of insulation was stripped away and the exposed wire twisted to prevent unravelling. Then, on a 75-mm segment of Ag wire, a 12-mm hairpin loop was formed at one end and a “sheet bend” knot was used to connect the two wires. The knot ensured that any subsequent tension could only tighten the mechanical and electrical connections. The remaining stranded wire was then twisted around the long leg of the hairpin loop, and the short leg of the hairpin loop was wrapped around both wires to further secure the connection. To prevent electrolytic interactions, the connection was waterproofed using “liquid electrical tape” and adhesive heat shrink. To form the AgCl layer, the bare silver wire was cleaned and then immersed in bleach for 15 min. To prevent the chamber from damaging the AgCl coating, the exposed wire was covered with a short length of polyethylene tubing (PE-60, ID 0.76 mm, OD 1.22 mm). The process was repeated to fabricate atrial, ventricular, and grounding electrodes, and the AgCl coating was reformed as required between experiments.
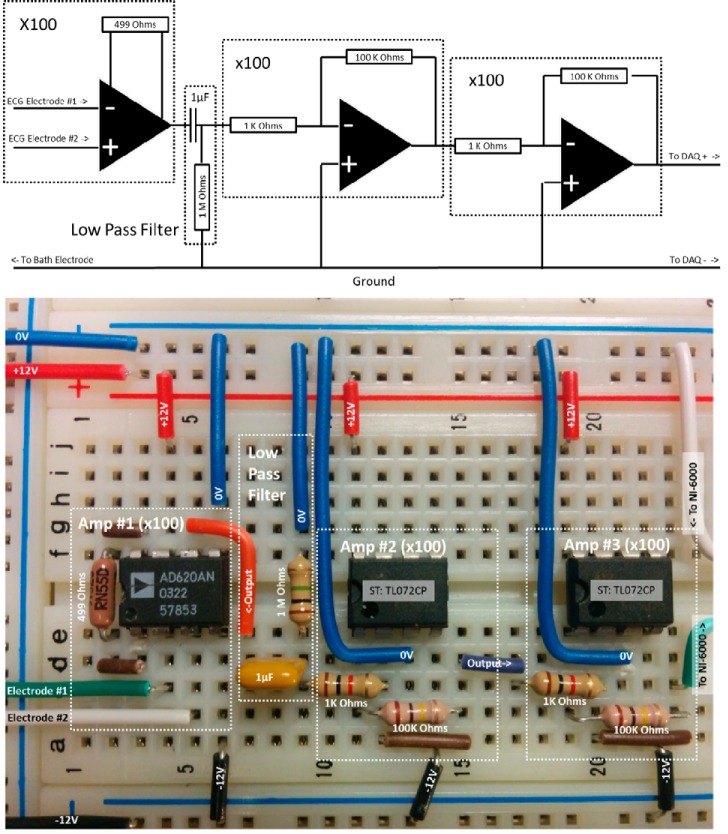
When the atrial and ventricular electrodes were positioned ∼1 mm from an averaged sized zebrafish heart (see Fig. 5), the electrodes typically detect a 1-μV QRS peak and required ∼106-fold amplification to bring the signal level up to 1 volt. Since this ex vivo preparation did not require the same level of electrical safeguards as a human ECG system and because ECG signals are slow by nature, a four-part zebrafish ECG amplifier was assembled, as shown in Fig. 6. The first part is a 100-fold amplifier using an AD620AN (Analog Devices, Norwood, MA) integrated circuit, which is a common entry-level instrumentation amplifier. Gain from the AD620AN stage was set by a single external resistor in which a 499-Ω resistor gave a voltage gain of 100 V/V. The second part is a high-pass RC filter using a 1-μF capacitor and 1 MΩ resistor, which removed the steady-state signal components such as electrode offset. The third and fourth parts are two identical inverting amplifiers using a standard op amp (TL072CP, STMicroelectronics, Geneva, Switzerland). For each inverting amplifier, the combination of a 1-kΩ input resistor with a 100-kΩ feedback resistor provided a voltage gain of 100 V/V. Two inverting amplifier stages used back to back provided the necessary gain without changing the orientation of the input signal. To actively inhibit electrical interference, the grounding electrode was connected to the electrical ground of the amplifier system. Additional noise suppression was obtained by connecting the optical breadboard to the amplifier's ground. In electrically noisy environments, additional filtering components may be desirable for real-time visualization; however, digital filtering, applied after data acquisition is the most flexible approach. Digitalization of the zebrafish ECG recordings, which have heart rates on the order of 120 beats/min or 2 Hz, only required low sampling rates since the majority of the information occurred at frequencies <60 Hz. The low-cost NI USB-6000 (approximate price $180; National Instruments, Austin, TX) offered acquisition rates of 10 kHz and connected to the computer via a USB port.
Fig. 6.
Zebrafish electrocardiography high-gain amplifier. Top: schematic diagram of ×100 preamplifier stage, low-pass filter stage, followed by two ×100 amplifier stages for combined gain of 106. Low-pass filter stage removes input offsets. Bottom: implementation of ECG amplifier on a solderless breadboard. Amplifiers are powered by a split ±12-V power supply. The final pair of ×100 amplifiers is shown on two separate integrated circuits for clarity. Solderless breadboards may increase susceptibility to power line noise.
Computer-controlled electrical stimulator.
Electric stimulation allowed the hearts to be paced at rates greater than the intrinsic heart rate, which rarely exceeded 250 beats/min at 28°C in zebrafish. These relatively low heart rates coupled with the large imaging chamber volume negated many of the technical advantages of commercial electrical stimulators that offer microsecond timing precision and biphasic stimulation outputs. Millisecond-level timing precision at 600 beats/min would be expected to give a 1% error in the pacing rate or a 1-frame difference in a 1,000 fps camera system. Therefore, errors associated with millisecond-level timing while acquiring with 205 fps cameras were negligible.
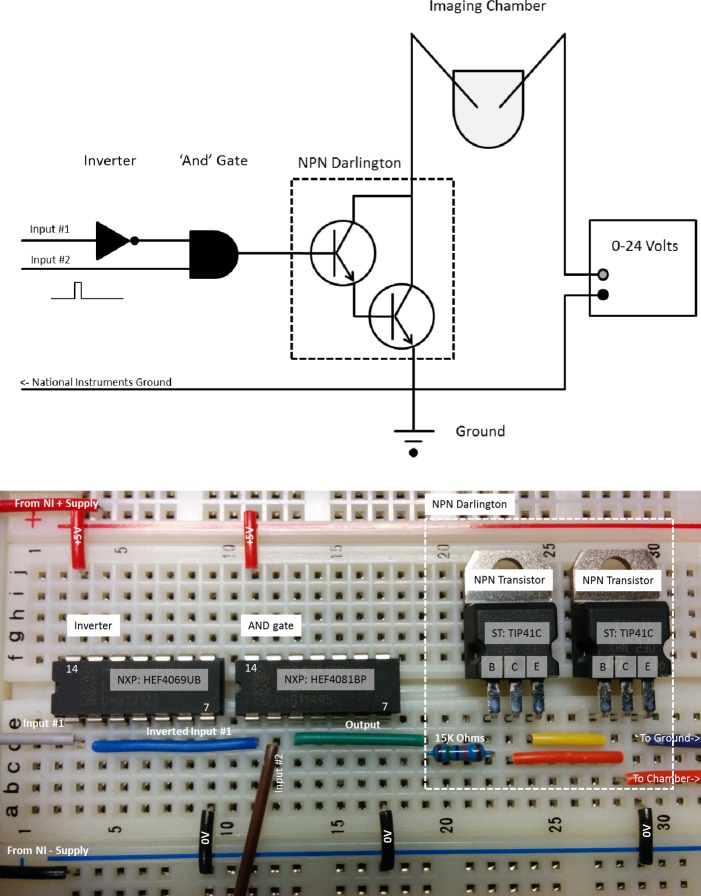
To create a programmable monophasic electrical simulator with millisecond level timing, we employed the NI USB-6000, which has four digital input/output channels that can be used to control pumps and shutters in addition to controlling electrical stimulation. Because the USB-6000 powers on with all digital output channels set “high” at 5 V, an inverter circuit and “AND” gate circuit are used to create an interlock to prevent unintended stimulator output (input no. 1) as shown in Fig. 7. The timing and pulse width of input no. 2 set the rate and pulse width of the stimulator output by controlling the NPN Darlington switch. When active, the Darlington switch allowed current to flow through the imaging chamber, between the two field stimulation electrodes. Different voltages were applied to the heart by changing the supply voltage running through the Darlington switch. The NI USB-6000 was controlled through software to deliver constant-rate or varying-rate protocols.
Fig. 7.
Software programmable monophasic electrical simulator. Top: schematic diagram of input inverter, “AND” gate and Darlington switch with connections to the imaging chamber and variable voltage power supply. Bottom: implementation of electrical simulator on a solderless breadboard. Unused inverter and gate inputs should be tied to a fixed logic state (ground or +5V) and decoupling capacitors (0.01–0.1 μF) should be used across the power pins (pin 7, pin 14).
Spectral cross talk.
One of the key benefits of optical mapping is the simultaneous acquisition of voltage and calcium dynamics from multiple ROIs on the heart's surface. With the dye combination of RH 237 and Rhod-2, both dyes are excitable by a shared excitation source and do not require rapid switching between multiple excitation sources. However, the broad-band emission of RH 237 overlaps with the Rhod-2 emission. The spectral cross talk elevated the baseline signal in the “calcium” camera by roughly 10% of the voltage camera intensity, in the absence of Rhod-2 labeling. Spectral cross talk also produced an upright voltage transient in the calcium camera, about 2–4% above the elevated baseline level. If RH 237 labeling is very bright and the voltage signal is near saturating levels 255 arbitrary intensity units (8-bit image), spectral cross talk would be expected to create a baseline value of about 25 intensity units in the Rhod-2 detection channel. Assuming a 5% transient, the voltage transient due to cross talk would result in a 1.25 intensity unit voltage transient, a 0.5% contribution.
The contribution of RH 237 bleed through into the calcium camera becomes less apparent in the presence of Rhod-2 labeling, which independently increases the baseline signal in the calcium camera. Nevertheless, the associated error due to cross talk can be estimated from the relationship between the apparent magnitude of the calcium transient and the recorded voltage signal. With a very bright RH 237 signal, as in the example above, a 5-unit calcium transient would be expected to contain a 20% error at the peak of the action potential. Since the action potential peak occurs during the upstroke of the calcium transient, this is where spectral cross talk will have the largest effects. In recordings with strong bleed-through effects, the upstroke of the calcium transient will mirror the upstroke kinetics found in the voltage response. Calcium recordings containing a rapid upstroke or a coincident peak with respect to the voltage peak should be investigated further. Rapid voltage dynamics in the presence of slower calcium dynamics, with pronounced separation between the two respective peaks, are consistent with independently acquired responses.
Errors associated with spectral cross-talk effects are reduced by lowering the intensity of RH 237 labeling (i.e., effective RH 237 concentration within the cardiomyocytes) and/or by increasing the Rhod-2 loading since Rhod-2 loading did not affect the voltage signal. In practice, RH 237 labeling levels were kept well below saturating levels to reduced cross talk, typically around 100 intensity units or lower. Maintaining adequate signal-to-noise levels places a lower limit on RH 237 labeling; however, applying cycle-to-cycle averaging restores the signal integrity.
Signal intensity.
RH 237 exhibited a small proportional change in fluorescence in response to depolarization. Since incubation of RH 237 also labels nonelectrically active structures, the signal intensity could not be used to determine absolute membrane potentials. Rhod-2 also exhibits proportional changes with calcium binding, but the potential for compartmentalization makes it difficult to determine absolute cytosolic calcium concentrations. Absolute magnitudes in ECG recordings were strongly dependent on heart size and electrode placement such that both optical measurements and electrical measurement benefited from signal intensity normalization. The similarities between the optical mapping and ECG measurements allowed for similar signal processing approaches.
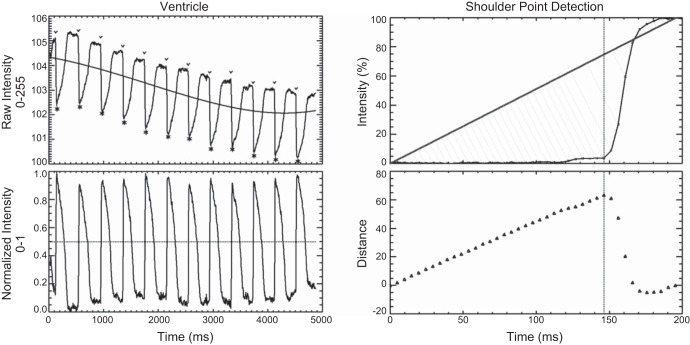
To normalize optical mapping and ECG signals, baseline correction was estimated with a polynomial function (6, 21). The polynomial function more easily followed slowly varying features (diastolic baseline shifts) while effectively ignoring rapidly changing features such as the action potentials or transients that occur during systole, as in Fig. 8. The offset of the polynomial fit reflected the average signal intensity and varied with APD and heart rate.
Fig. 8.
Baseline compensation with peak and shoulder point detection. Top left: raw ventricular voltage signals containing an unsteady baseline. Solid black line shows the result of a 4th-order polynomial fit used to estimate the baseline. Bottom left: voltage signal after baseline compensation and intensity normalization. Threshold value of 50% is used to distinguish between cardiac cycles (dotted line), and resulting peaks are identified in the raw intensity trace (above). Peak locations are used to identify the preceding shoulder point (v). Top right: shoulder point detection algorithm applied to segment of a ventricular calcium transient upstroke, preceding the peak by 200 ms. The connecting line runs from the first point to the peak point and the individual right angle distances connecting each data point to the connecting line are shown as gray lines. Bottom right: right-angle distances between each point and the connecting line. Data point with the maximum separation distance is used to define the shoulder point, as shown by the vertical dotted line.
Cycle detection.
After baseline compensation and intensity normalization, a threshold value of 50% was applied to optical mapping and ECG recordings to obtain individual cycles and local peaks were used as the initial cycle delimiter (Fig. 8, left). For optical mapping recordings, the local peak was used to find the preceding inflection point, the instant immediately preceding the upstroke phase. The inflection or shoulder point was determined by maximizing the separation distance between a line drawn between an arbitrary starting point and the cycle's peak (Fig. 8, right). For each intermediate point, the right-angle distance between that data point and the connecting line was calculated. The point with the maximum separation distance was used to identify the shoulder location (6). One advantage of this approach over working with slopes was that the results were quite insensitive to the starting and ending point locations. The shoulder locations were then used to redefine the start of each cycle.
For ECG data, individual wave features were extracted using a combination of peak detection and shoulder detection. Working outwards from the R-wave peak, shoulder detection was applied to identify the Q-wave and S-wave peaks. P-wave and T-waves were subsequently identified by applying peak detection to the segments on either side of the QRS complex. The end of the T-wave was identified by applying shoulder detection (described above) to the segment following the peak of the T-wave.
Cycling averaging.
Cycle or ensemble averaging, combining multiple cardiac cycles, was employed to increase the signal-to-noise ratio or to investigate the presence of cycle-to-cycle variations. For investigating compartment-specific voltage and calcium events, the sharp peaks of the action potential waveform were used for cycle averaging in both recordings. With calcium-only recordings, the rounded calcium peak could introduce alignment errors resulting in slower upstroke dynamics and a delayed peak and alignment by shoulder points was preferred. When the effects of AV delay were to be preserved, the atrial action potential peak was used to create the average ventricular voltage and calcium responses. Cycle averaging, aligning by the QRS complex, was particularly useful for ECG recordings, in which small undulations in the raw signal made it difficult to automatically determine the locations of the P- and T-waves in individual cycles. Although cycle averaging could be applied to optical mapping recordings during both normal and abnormal rhythms, cycling averaging in ECG recordings were limited to fixed AV rhythms.
RESULTS
Simutaneous ECG and voltage-mapping recordings.
Simutaneous voltage mapping and ECG recordings are shown in Fig. 9, in which peak alignments are shown with vertical dotted lines. In unaveraged recordings, atrial action potential peaks approximately aligned with P-wave peaks and ventricular peaks aligned in a similar manner with R-wave peaks. The QRS complex of the ECG aligned with the inflection points of the ventricular action potential. Average atrial and ventricular action potentials as well as the ECG ensemble average were created using the QRS complex (Fig. 9, right). From this ECG ensemble average, the locations of the P-, Q-, R-peaks and the end of the T-wave could be automatically determined (see Cycle detection in methods). In the average ECG waveform, the P-wave clearly aligned with the peak of the atrial action potential and the R-wave peak clearly aligned with the shoulder of the ventricular response. The end of the T-wave coincided with the end of the averaged ventricular action potential.
Fig. 9.
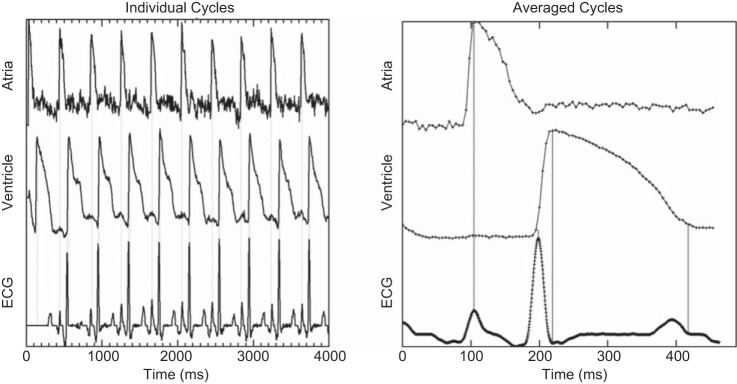
Optical mapping with simultaneous electrocardiogram (ECG) recordings. Left: optical mapping and ECG recording with baseline compensation and intensity normalization measured at 23°C. Vertical dotted lines mark atrial and ventricular action potential peaks and the R-peaks of the ECG recording. Right: average optical mapping cycles generated from the R-peak of the ECG recording. Relationships between the P-, R-, and S-peaks and the end of the T-wave are shown by dotted lines.
Simultaneous voltage and calcium mapping.
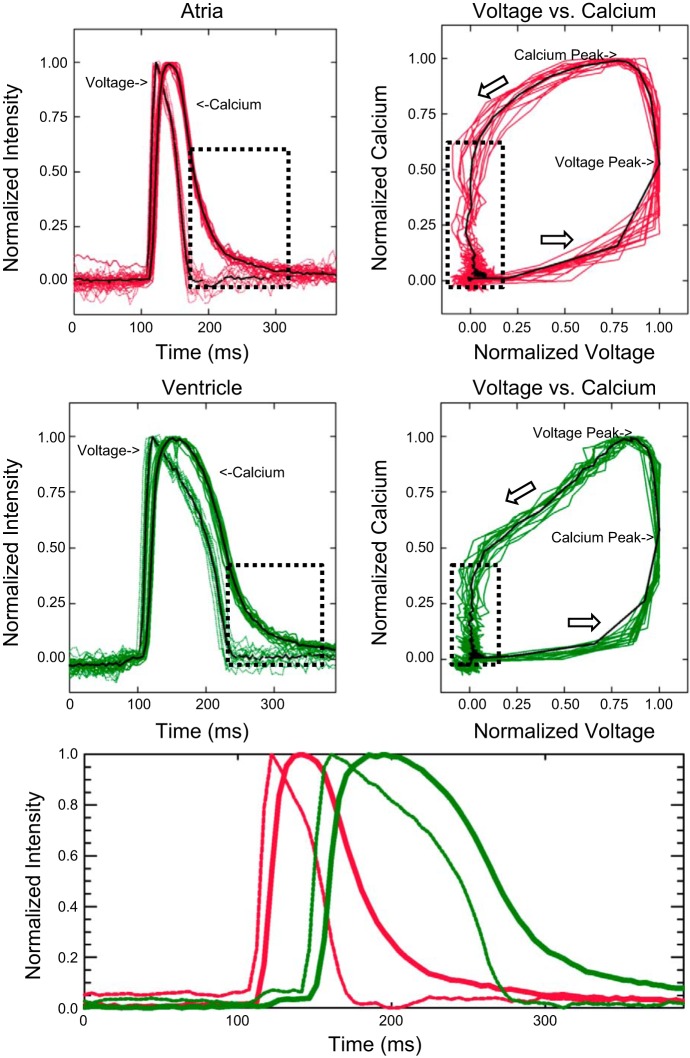
Voltage and calcium cycles from a 15-s recording are overlaid in Fig. 10 and contained 14 cycles from a spontaneously beating heart (64 beats/min). The peak of the voltage response was used for the cycle alignments. Both atrial and ventricular voltage responses had a fast upstroke component and rapid initial repolarization, resulting in a sharp voltage peak. The calcium upstroke was delayed behind the voltage upstroke and slowed as it approached the peak value. Relaxation down from the peak value was also slow, which created a rounded calcium peak in both compartments.
Fig. 10.
Simultaneous voltage and calcium recordings. Top left: multiple atrial individual voltage and calcium cycles superimposed with the average response measured at 28°C. Dotted box highlights Ca2+ extrusion occurring at diastolic membrane potentials. Top right: voltage versus calcium relationships from individual cardiac cycles (gray) and of the average response (black). Middle left: individual and average cycles from the ventricle. Middle right: ventricular voltage versus calcium relationship. Bottom: average atrial and ventricular voltage and calcium responses including the effect of atrioventricular propagation delay.
At 28°C, the atrial APD from 50% upstroke to 50% downstroke (APD50) was 39 ± 1 ms (means ± SE), whereas the atrial calcium transient duration (CaT50), 50% upstroke to 50% downstroke, was 56 ± 0.3 ms. The atrial voltage-calcium delay, from voltage peak to calcium peak, was 20 ± 1 ms. In the ventricle, the APD50 was 95 ± 1 ms, CaT50 was 107 ± 0.8 ms, and the voltage-calcium delay was 31 ± 2 ms.
The graphs of voltage versus calcium responses highlight the similarities in upstroke dynamics and the dissimilarities in downstroke dynamics. During the upstroke in both compartments, ∼60% of normalized calcium levels were present at the voltage peak. At the calcium peak in both compartments, ∼80% of normalized voltage was present. However, relaxation of the calcium transient during repolarization differed between the two compartments. During atrial repolarization, ∼60% of the calcium transient remained at the end of the action potential and during ventricular repolarization, ∼40% of the calcium transient remained at the end of the action potential, possibly indicating differing amounts of repolarization reserve.
To preserve the effects of AV delay, ensemble averages of the ventricular response were formed using the peak times of the atrial action potential. Consistent AV delays in this recording preserved the steep ventricular upstrokes of the ensemble response. Rapid AV conduction in this recording caused clear overlap between the atrial and ventricular calcium transients. Peak atrial calcium occurred at the beginning of the ventricular response and atrial-ventricular crossover occurred at 75% peak calcium.
Variable rate electrical stimulation.
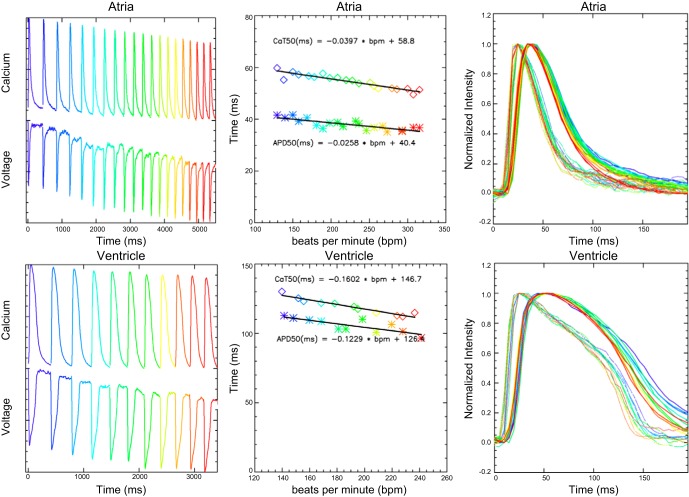
Figure 11 shows voltage and calcium cycles in response to a variable rate stimulation protocol, in which the heart rate was increased in 10 beats/min increments. Normalized voltage and calcium traces are shown without baseline compensation. Applying linear fits to the atrial response found small changes due to heart rate, corresponding to 2.6 and 4.0 ms per 100 beats/min for APD50 and CaT50, respectively. At “zero” beats/min (y-intercept), the APD50 was 40 ms and CaT50 was 59 ms, differing by 19 ms. Given the pattern of the overlaid atrial cycles, it would suggest that part of the heart rate effect is due to truncation of the atrial cycles since the individual cycles have parallel downstrokes. The ventricular response contained a larger heart rate effect, with 10 and 16 ms per 100 beats/min for APD50 and CaT50, respectively. At “zero” beats/min, APD50 is 126 ms and CaT50 is 147 ms, differing by 21 ms. Unlike the atrial changes, in the ventricle the voltage and calcium cycles are largely superimposed up to APD70 and then diverge.
Fig. 11.
Variable rate stimulation. Top row left: atrial voltage and calcium recordings without baseline compensation, in which the rate of electrical stimulation increases by 10 beats/min per cycle. Line and plot symbol colors indicate heart rate values. Top row middle: atrial action potential (APD50) and calcium transient (CaT50) durations from 50% upstroke to 50% down stroke as a function of stimulation rate. For the APD50 fit r2 = 0.81 and for the CaT50 fit r2 = 0.93. Top row right: superimposed atrial voltage and calcium cycles with colors indicating heart rate. Bottom row left: ventricular voltage and calcium recordings. Bottom row middle: ventricular APD50 and CaT50 results by stimulation rate. For the APD50 fit r2 = 0.90 and CaT50 fit r2 = 0.98. Bottom row right: superimposed voltage and calcium cycles for the ventricle.
DISCUSSION
The advantages of optical mapping with respect to traditional microelectrode techniques are well established, and the ability to simultaneously measure calcium and voltage dynamics at different ROIs is an important tool in cardiac physiology (10, 14) particularly in the study of the mechanisms of arrhythmias. The advantages of the zebrafish cardiac model are also well established, with the number of available zebrafish mutants ever increasing and the recent advent of zebrafish genome editing (18). Furthermore, the rapid development of genetically encoded reporters that can be localized to specific organelles within the cell make optical mapping a robust tool for understanding mechanisms (17). Yet, the basic mechanisms of zebrafish electrical activity and calcium handling remain under investigation (3, 8, 35).
Understanding the relationship between the voltage activity and the calcium response is critical to understanding how zebrafish disease models will extend to humans. However, the diagnostic potential of optical mapping is complicated by the need for an excised heart and by the current need for contractile inhibitors, such as blebbistatin. Simultaneous voltage mapping and ECG recording results from the excised heart are highly correlated (32), and ECG recordings from intact animals provide a valuable benchmark. ECG recordings in the intact zebrafish require precise lead placement and are prone to motion artifacts caused by respiration (24); techniques such as paralysis of gill movement increase recording quality. As the use of Tricaine is accompanied by bradycardia, pancuronium has been used by some groups (1, 4). Nevertheless, the lack of respiration has direct and deleterious effects on cardiac function requiring external perfusion systems to maintain normal function (25). In the excised heart, passive oxygenation through diffusion maintains rate and rhythm for many hours after isolation (22). However, even in the absence of physical trauma during isolation, the excised heart is devoid of neural or humeral regulation. The loss of autonomic control may alter resting heart rates and have indirect and direct effects on AV delay.
In the freely contracting heart, optical mapping is unable to accurately measure electrical or calcium activity. Voltage and calcium-specific signals are small and their dynamics easily distorted by motion, which create large signal fluctuations. With large visible movements, the apparent voltage or calcium responses will closely following the movement response and have large but slow dynamics. For smaller movements that are not easily visible, it is often possible to observe mixing of the movement artifact and of the voltage or calcium-specific signal. For inverted voltage signals in ROIs that have increased signal with movement, there will be a rapid initial drop in the signal intensity associated with rapid depolarization, followed by a slower rising phase associated with movement. Often, the rising phase created by motion will produce a larger transient than the actual voltage response and produces a signal that appears upright with a delayed peak. In regions that have decreased signal with movement, there will be a rapid initial drop due to depolarization followed by a slower but larger signal decrease as the result of motion.
Movement artifacts are the most severe along the outer aspects of the atrium, when movement reveals the dark nonfluorescent background. Occasionally, the atrium can move past its initial position during relaxation and create a triphasic wave. At fast heart rates, in which the atrium does not settle before the next beat, the final recovery phase of the triphasic response can merge with the upstroke phase creating the impression of an unstable baseline. Movement artifacts in the calcium signal typically produce transients with a slightly slower upstroke phase with a larger delayed peak and are more difficult to detect since both movement and the calcium-specific response increase signal intensity. Since the calcium data and voltage data are simultaneously acquired, the voltage response can be used to screen for motion in the calcium response. To a limited degree, the effects of movement artifact can be reduced by using large ROI located away from the edges of the heart and by extending the reincubation time between recordings. The deleterious effect of movement on optical mapping recordings has led to the general acceptance of contractile inhibitors use, such as blebbistatin, in optical mapping (11, 19). However, use of blebbistatin should be not considered benign. Although the indirect effects of blebbistatin on ionic currents may be minimal (7, 12), blebbistatin may decrease myofilament Ca2+ sensitivity and is antiarrhythmogenic suggesting that it has complex effects on excitation-contraction coupling (2, 33). Length-dependent changes in calcium sensitivity that are associated with normal sarcomere shortening may also be altered by blebbistatin (8). However, by carefully optimizing (i.e., minimizing) the blebbistatin dose required to suppress movement artifact, reliable signals can be recorded.
Ongoing developments in camera technology bring continued improvements in camera speed and resolution. Perhaps paradoxically, the constant evolution in camera specifications can make it increasingly difficult to determine which cameras are best suited for a particular optical mapping application and budget. Although camera selection is a major determinant of system performance, the camera is nevertheless only a single component of a much larger system. This project used comparatively inexpensive cameras with quite modest specifications compared with other commonly used scientific detectors: 55% peak sensitivity, 8-bit acquisition, and 205 fps. However, within the framework presented, these cameras were able to capture detailed voltage and calcium responses. As cameras are increasing capable and increasingly economical, the results presented here form an important reference for future camera selections.
Optical mapping, as a general technique, is able to record intra-atrial and intra-ventricular conduction in addition to action potential profiles. However, the specific cameras used here are limited to 205 fps, transatrial and transventricular conduction events cannot be temporally resolved. Well-separated ROIs within the same compartment give near-identical results and faster acquisition rates would be required for activation phase maps. However, as shown, 205 fps is sufficient to characterize action potential profiles and calcium transient responses (27). Furthermore, it should be noted that going to much higher frame rates can result in photon starved, high-noise conditions.
Considering the surrounding optical framework, the size of the zebrafish heart had important implications on the optical design. The zebrafish heart occupies ∼1 mm2 in area and is too large to take advantage of the latest high-performance high-magnification objectives. Lower magnification objectives, such as a ×4, are better suited to the required field of view. For smaller camera sensors, intermediate optics may still be required to demagnify the final image to better match the ocular view. However, low-magnification objectives have considerably less light-gathering ability than higher numerical aperture lenses. This limits the maximal signal intensity, which may not work well for low-performance cameras that have a high readout noise. When using existing cameras for optical mapping, lowering the frame rate may be invaluable during proof-of-concept phases as a 50% drop in frame rate is equivalent to a 200% increase in signal. Pixel binning is another approach that increases the effective signal. Although these configurations reduce temporal and spatial resolution, respectively they can be very useful for determining camera requirements.
In optical mapping systems designed for larger mammalian hearts in which the hearts are larger than the camera-sensor itself, native c-mount camera lenses (16) or adapted SLR camera lenses (5) can be used for demagnification. Generally, these types of lenses are significantly more affordable than microscope objectives. Because the longer focal length objective results in a larger separation distance between the lens and the heart, the hearts can be reasonably evenly illuminated with LED sources or fiber lamps located next to the camera lens system. Because zebrafish hearts are substantially smaller than the camera sensor, magnification is required to fill the cameras' field of view, which is more difficult to achieve using stand-alone camera lenses without any customized parts. Magnification generally reduces the separation distance between the heart and the lens, making side-illumination more difficult. With such a small target area, there is an increased cost associated with setting and maintaining the precise alignment of each light source. It can also be difficult to couple multiple LEDs and fiber lamps efficiently, to deliver sufficient illumination intensities that are uniform onto such a small target.
The size of the zebrafish heart and the size of the camera sensor favored a custom optical pathway to allow precise control over magnification, camera placement, and the integration of an epifluorescence style illumination system. Because both the hearts and the camera sensors are small, standard 1-inch (25 mm) optics could be used, which greatly reduced the cost of individual components, compared with using larger optical elements. The entire optical system was constructed from off-the-shelf parts, which further reduced costs and avoided the possible delays associated with custom machining. One disadvantage of using 1-inch optics is reduced compatibility with the larger camera sensors due to image vignetting.
By using a laser source for excitation, high-intensity illumination could be obtained, which may allow lower-sensitivity cameras to be used for optical mapping in zebrafish hearts. However, the effect of high laser intensities on the heart can be of concern. In a previous report, using a voltage-only optical mapping system, the laser-based illumination system did not produce obvious changes in cardiac rate or rhythm or make measurable changes in APD or AV delay, suggesting relatively good biocompatibility (22). There was obvious photobleaching of RH 237 and Rhod-2 with intense laser exposure. However, after baseline compensation and intensity normalization, cardiac cycles with various degrees of photobleaching are indistinguishable. The laser output can be attenuated with neutral density filters to reduce photobleaching with a reduction in signal. Photobleaching can also be managed by limiting the number and duration of recordings by using computer-controlled shutters.
The largest effect of strong illumination in zebrafish hearts is not phototoxicity or photobleaching but rather to photo release of the inhibitory action of blebbistatin, which is apparent in very long recordings (∼60 s). Multiple shorter recordings can allow the blebbistatin effects to reaccumulate in between recordings. Nevertheless, laser exposure and the resulting movement artifact and photobleaching make optical mapping recordings a limited resource, and ECG recordings can be used to monitor electrical activity in between optical mapping recordings.
When the voltage-sensitive dye RH 237 is depolarized, its emission becomes blue shifted such that there is a decrease in the signal acquired through a 700-nm long-pass filter (23). Because RH 237 has a broad emission spectrum, an upright voltage signal can be acquired by monitoring “orange” light near 600 nm, which also coincides with the emission spectra of Rhod-2. In the absence of Rhod-2 labeling or when Rhod-2 labeling is very weak, a small voltage signal can be observed in the calcium camera when RH 237 labeling is very bright in the zebrafish heart. Since action potentials contain much faster upstroke kinetics than their respective calcium transients, avoiding calcium recordings with significant RH 237 contributions is straightforward.
The simultaneous recordings of voltage and calcium transients clearly show independent dynamics and well-separated voltage and calcium peaks. Atrial and ventricular recordings show elevated calcium levels at diastolic membrane potentials which do not contain bleed-through effects. Voltage and calcium responses are expected to be heart rate dependent, and the relationship can be investigated using electrical field stimulation. Variable-rate simulation sweeps through a range of heart rates, and the effect of a single accelerated cardiac cycle is well resolved by this optical mapping system and steady-state rate effects are more pronounced.
Excitation-contraction coupling in single ventricular zebrafish myocytes is more strongly dependent on transsarcolemmal calcium fluxes and is less reliant on calcium release from the SR than mammalian myocytes (3). Calcium currents in ventricular zebrafish myocytes are also larger and significant Ca2+ entry through reverse-mode NCX activity occurs at positive potentials (35). The importance of the L-type calcium channel and NCX in zebrafish cardiology is also apparent in the island beat (L-type calcium channel) (29) mutant and in the tremblor (NCX) (9, 20) mutant zebrafish. Both of these mutations have chamber-specific effects, resulting in atrial fibrillation and silent ventricles and are both embryonically lethal. The sensitivity of optical mapping techniques to small changes in voltage or calcium dynamics may be applicable to detecting intermediate changes in calcium handling in heterozygous zebrafish similar to the intermediate effects found in voltage dynamics in kch2(1) and reggae mutants (13).
One of the advantages of optical mapping is the ability to simultaneously investigate atrial and ventricular voltage and calcium dynamics as well as AV conduction disorders. The role of atrial contraction in determining cardiac output is more pronounced in teleosts including zebrafish than in mammals (15), and many zebrafish mutants have differential atrial and ventricular effects. Although zebrafish have limited SR calcium release under basal conditions, zebrafish myocytes can store significant amounts of calcium within the SR. Spontaneous release of SR calcium stores can induce early afterdepolarization (EAD) and calcium release events (3), and the arrhythmogenicity of these events can be investigated with optical mapping in the whole heart. SR calcium load can be increased by elevated extracellular calcium and by increased heart rate, either by pharmacology or by electrical stimulation. Drug-induced long-QT may also increase SR calcium load by slowing NCX-mediated calcium efflux. Relaxation of the calcium transient, as measured by optical mapping, can occur at diastolic potentials, and the current zebrafish models of long-QT may also contain irregularities in their calcium dynamics that would not be apparent in microelectrode recordings.
In this optical mapping setup, we use voltage-sensitive and calcium-sensitive dyes to simultaneously acquire data from an excised heart, and the advancement of this technique has benefited from the ongoing advancements in camera technology. Although the price of cameras continues to fall, high-end scientific cameras can still be cost prohibitive. This report outlines the construction and use of an inexpensive optical mapping system with integrated ECG and programmable electrical stimulation and demonstrates some of its capabilities. With zebrafish emerging as a prominent model of vertebrate cardiac physiology, this capable and economical system is expected to make significant contributions to understanding zebrafish excitation-contraction coupling and cardiac diseases.
GRANTS
The authors acknowledge the generous support of the Natural Sciences and Engineering Research Council (NSERC) of Canada, the Canadian Institutes of Health Research (CIHR), and the Collaborative Health Research Program (NSERC/CIHR) to G. F. Tibbits. M. F. Beg and M. V. Sarunic are Michael Smith Foundation for Health Research (MSFHR) Scholars and G. F. Tibbits is a Tier I Canada Research Chair.
REFERENCES
- 1.Arnaout R, Ferrer T, Huisken J, Spitzer K, Stainier DY, Tristani-Firouzi M, Chi NC. Zebrafish model for human long QT syndrome. Proc Natl Acad Sci USA 104: 11316–11321, 2007. [DOI] [PMC free article] [PubMed] [Google Scholar]
- 2.Baudenbacher F, Schober T, Pinto JR, Sidorov VY, Hilliard F, Solaro RJ, Potter JD, Knollmann BC. Myofilament Ca2+ sensitization causes susceptibility to cardiac arrhythmia in mice. J Clin Invest 118: 3893–3903, 2008. [DOI] [PMC free article] [PubMed] [Google Scholar]
- 3.Bovo E, Dvornikov AV, Mazurek SR, de Tombe PP, Zima AV. Mechanisms of Ca2+ handling in zebrafish ventricular myocytes. Pflügers Arch 465: 1775–1784, 2013. [DOI] [PMC free article] [PubMed] [Google Scholar]
- 4.Chaudhari GH, Chennubhotla KS, Chatti K, Kulkarni P. Optimization of the adult zebrafish ECG method for assessment of drug-induced QTc prolongation. J Pharmacol Toxicol Methods 67: 115–120, 2013. [DOI] [PubMed] [Google Scholar]
- 5.Choi BR, Salama G. Simultaneous maps of optical action potentials and calcium transients in guinea-pig hearts: mechanisms underlying concordant alternans. J Physiol 529: 171–188, 2000. [DOI] [PMC free article] [PubMed] [Google Scholar]
- 6.Ding W, Lin E, Ribeiro A, Sarunic MV, Tibbits GF, Beg MF. Automatic cycle averaging for denoising approximately periodic spatiotemporal signals. IEEE Trans Med Imaging 33: 1749–1759, 2014. [DOI] [PubMed] [Google Scholar]
- 7.Dou Y, Arlock P, Arner A. Blebbistatin specifically inhibits actin-myosin interaction in mouse cardiac muscle. Am J Physiol Cell Physiol 293: C1148–C1153, 2007. [DOI] [PubMed] [Google Scholar]
- 8.Dvornikov AV, Dewan S, Alekhina OV, Pickett FB, de Tombe PP. Novel approaches to determine contractile function of the isolated adult zebrafish ventricular cardiac myocyte. J Physiol 592: 1949–1956, 2014. [DOI] [PMC free article] [PubMed] [Google Scholar]
- 9.Ebert AM, Hume GL, Warren KS, Cook NP, Burns CG, Mohideen MA, Siegal G, Yelon D, Fishman MC, Garrity DM. Calcium extrusion is critical for cardiac morphogenesis and rhythm in embryonic zebrafish hearts. Proc Natl Acad Sci USA 102: 17705–17710, 2005. [DOI] [PMC free article] [PubMed] [Google Scholar]
- 10.Efimov IR, Nikolski VP, Salama G. Optical imaging of the heart. Circ Res 95: 21–33, 2004. [DOI] [PubMed] [Google Scholar]
- 11.Fedorov VV, Lozinsky IT, Sosunov EA, Anyukhovsky EP, Rosen MR, Balke CW, Efimov IR. Application of blebbistatin as an excitation-contraction uncoupler for electrophysiologic study of rat and rabbit hearts. Heart Rhythm 4: 619–626, 2007. [DOI] [PubMed] [Google Scholar]
- 12.Fedorov VV, Lozinsky IT, Sosunov EA, Anyukhovsky EP, Rosen MR, Balke CW, Efimov IR. Application of blebbistatin as an excitation-contraction uncoupler for electrophysiologic study of rat and rabbit hearts. Heart Rhythm 4: 619–626, 2007. [DOI] [PubMed] [Google Scholar]
- 13.Hassel D, Scholz EP, Trano N, Friedrich O, Just S, Meder B, Weiss DL, Zitron E, Marquart S, Vogel B, Karle CA, Seemann G, Fishman MC, Katus HA, Rottbauer W. Deficient zebrafish ether-a-go-go-related gene channel gating causes short-QT syndrome in zebrafish reggae mutants. Circulation 117: 866–875, 2008. [DOI] [PubMed] [Google Scholar]
- 14.Herron TJ, Lee P, Jalife J. Optical imaging of voltage and calcium in cardiac cells and tissues. Circ Res 110: 609–623, 2012. [DOI] [PMC free article] [PubMed] [Google Scholar]
- 15.Ho YL, Shau YW, Tsai HJ, Lin LC, Huang PJ, Hsieh FJ. Assessment of zebrafish cardiac performance using Doppler echocardiography and power angiography. Ultrasound Med Biol 28: 1137–1143, 2002. [DOI] [PubMed] [Google Scholar]
- 16.Holcomb MR, Woods MC, Uzelac I, Wikswo JP, Gilligan JM, Sidorov VY. The potential of dual camera systems for multimodal imaging of cardiac electrophysiology and metabolism. Exp Biol Med (Maywood) 234: 1355–1373, 2009. [DOI] [PMC free article] [PubMed] [Google Scholar]
- 17.Hou JH, Kralj JM, Douglass AD, Engert F, Cohen AE. Simultaneous mapping of membrane voltage and calcium in zebrafish heart in vivo reveals chamber-specific developmental transitions in ionic currents. Front Physiol 5: 344, 2014. [DOI] [PMC free article] [PubMed] [Google Scholar]
- 18.Hwang WY, Fu Y, Reyon D, Maeder ML, Kaini P, Sander JD, Joung JK, Peterson RT, Yeh JR. Heritable and precise zebrafish genome editing using a CRISPR-Cas system. PLos One 8: e68708, 2013. [DOI] [PMC free article] [PubMed] [Google Scholar]
- 19.Jou CJ, Spitzer KW, Tristani-Firouzi M. Blebbistatin effectively uncouples the excitation-contraction process in zebrafish embryonic heart. Cell Physiol Biochem 25: 419–424, 2010. [DOI] [PMC free article] [PubMed] [Google Scholar]
- 20.Langenbacher AD, Dong Y, Shu X, Choi J, Nicoll DA, Goldhaber JI, Philipson KD, Chen JN. Mutation in sodium-calcium exchanger 1 (NCX1) causes cardiac fibrillation in zebrafish. Proc Natl Acad Sci USA 102: 17699–17704, 2005. [DOI] [PMC free article] [PubMed] [Google Scholar]
- 21.Laughner JI, Ng FS, Sulkin MS, Arthur RM, Efimov IR. Processing and analysis of cardiac optical mapping data obtained with potentiometric dyes. Am J Physiol Heart Circ Physiol 303: H753–H765, 2012. [DOI] [PMC free article] [PubMed] [Google Scholar]
- 22.Lin E, Ribeiro A, Ding W, Hove-Madsen L, Sarunic MV, Beg MF, Tibbits GF. Optical mapping of the electrical activity of isolated adult zebrafish hearts: acute effects of temperature. Am J Physiol Regul Integr Comp Physiol 306: R823–R836, 2014. [DOI] [PMC free article] [PubMed] [Google Scholar]
- 23.Loew LM. Design and use of organic voltage sensitive dyes. In: Membrane Potential Imaging in the Nervous System, editied by Canepari M and Zeceviv D. New York: Springer, 2010, p. 13–23. [Google Scholar]
- 24.Milan DJ, Jones IL, Ellinor PT, MacRae CA. In vivo recording of adult zebrafish electrocardiogram and assessment of drug-induced QT prolongation. Am J Physiol Heart Circ Physiol 291: H269–H273, 2006. [DOI] [PubMed] [Google Scholar]
- 25.Milan DJ, Jones IL, Ellinor PT, MacRae CA. In vivo recording of adult zebrafish electrocardiogram and assessment of drug-induced QT prolongation. Am J Physiol Heart Circ Physiol 291: H269–H273, 2006. [DOI] [PubMed] [Google Scholar]
- 26.Milan DJ, Peterson TA, Ruskin JN, Peterson RT, MacRae CA. Drugs that induce repolarization abnormalities cause bradycardia in zebrafish. Circulation 107: 1355–1358, 2003. [DOI] [PubMed] [Google Scholar]
- 27.Mironov SF, Vetter FJ, Pertsov AM. Fluorescence imaging of cardiac propagation: spectral properties and filtering of optical action potentials. Am J Physiol Heart Circ Physiol 291: H327–H335, 2006. [DOI] [PubMed] [Google Scholar]
- 28.Nemtsas P, Wettwer E, Christ T, Weidinger G, Ravens U. Adult zebrafish heart as a model for human heart? An electrophysiological study. J Mol Cell Cardiol 48: 161–171, 2010. [DOI] [PubMed] [Google Scholar]
- 29.Rottbauer W, Baker K, Wo ZG, Mohideen MA, Cantiello HF, Fishman MC. Growth and function of the embryonic heart depend upon the cardiac-specific L-type calcium channel alpha1 subunit. Dev Cell 1: 265–275, 2001. [DOI] [PubMed] [Google Scholar]
- 30.Scholz EP, Niemer N, Hassel D, Zitron E, Burgers HF, Bloehs R, Seyler C, Scherer D, Thomas D, Kathofer S, Katus HA, Rottbauer WA, Karle CA. Biophysical properties of zebrafish ether-a-go-go related gene potassium channels. Biochem Biophys Res Commun 381: 159–164, 2009. [DOI] [PubMed] [Google Scholar]
- 31.Swift LM, Asfour H, Posnack NG, Arutunyan A, Kay MW, Sarvazyan N. Properties of blebbistatin for cardiac optical mapping and other imaging applications. Pflügers Arch 464: 503–512, 2012. [DOI] [PMC free article] [PubMed] [Google Scholar]
- 32.Tsai CT, Wu CK, Chiang FT, Tseng CD, Lee JK, Yu CC, Wang YC, Lai LP, Lin JL, Hwang JJ. In-vitro recording of adult zebrafish heart electrocardiogram-a platform for pharmacological testing. Clin Chim Acta 412: 1963–1967, 2011. [DOI] [PubMed] [Google Scholar]
- 33.Venkataraman R, Baldo MP, Hwang HS, Veltri T, Pinto JR, Baudenbacher FJ, Knollmann BC. Myofilament calcium de-sensitization and contractile uncoupling prevent pause-triggered ventricular tachycardia in mouse hearts with chronic myocardial infarction. J Mol Cell Cardiol 60: 8–15, 2013. [DOI] [PMC free article] [PubMed] [Google Scholar]
- 34.Weiss JN, Garfinkel A, Karagueuzian HS, Chen PS, Qu Z. Early afterdepolarizations and cardiac arrhythmias. Heart Rhythm 7: 1891–1899, 2010. [DOI] [PMC free article] [PubMed] [Google Scholar]
- 35.Zhang PC, Llach A, Sheng XY, Hove-Madsen L, Tibbits GF. Calcium handling in zebrafish ventricular myocytes. Am J Physiol Regul Integr Comp Physiol 300: R56–R66, 2011. [DOI] [PubMed] [Google Scholar]


