

Abstract
The hypoxic and cold environment at high altitudes requires that small mammals sustain high rates of O2 transport for exercise and thermogenesis while facing a diminished O2 availability. We used laboratory-born and -raised deer mice (Peromyscus maniculatus) from highland and lowland populations to determine the interactive effects of ancestry and hypoxia acclimation on exercise performance. Maximal O2 consumption (V̇o2max) during exercise in hypoxia increased after hypoxia acclimation (equivalent to the hypoxia at ∼4,300 m elevation for 6–8 wk) and was consistently greater in highlanders than in lowlanders. V̇o2max during exercise in normoxia was not affected by ancestry or acclimation. Highlanders also had consistently greater capillarity, oxidative fiber density, and maximal activities of oxidative enzymes (cytochrome c oxidase and citrate synthase) in the gastrocnemius muscle, lower lactate dehydrogenase activity in the gastrocnemius, and greater cytochrome c oxidase activity in the diaphragm. Hypoxia acclimation did not affect any of these muscle traits. The unique gastrocnemius phenotype of highlanders was associated with higher mRNA and protein abundances of peroxisome proliferator-activated receptor γ (PPARγ). Vascular endothelial growth factor (VEGFA) transcript abundance was lower in highlanders, and hypoxia acclimation reduced the expression of numerous genes that regulate angiogenesis and energy metabolism, in contrast to the observed population differences in muscle phenotype. Lowlanders exhibited greater increases in blood hemoglobin content, hematocrit, and wet lung mass (but not dry lung mass) than highlanders after hypoxia acclimation. Genotypic adaptation to high altitude, therefore, improves exercise performance in hypoxia by mechanisms that are at least partially distinct from those underlying hypoxia acclimation.
Keywords: high-altitude adaptation, oxygen transport, capillarity, oxidative capacity, PPARγ
high altitude is one of the harshest terrestrial environments inhabited by endothermic vertebrates. The decline in oxygen tension with elevation can reduce aerobic scope dramatically by limiting tissue oxygen supply and mitochondrial respiration (73). High-altitude hypoxia is a particularly severe challenge to small endotherms, because the cold temperatures at elevation require that they concurrently sustain high rates of oxygen transport to fuel thermogenesis (24). This requires small highland natives to somehow overcome the hypoxia-induced decrements in aerobic capacity (i.e., maximal rate of oxygen consumption, V̇o2max).
Both acclimatization and genotypic (evolutionary) adaptation to high altitude can potentially enhance V̇o2max of highland natives in hypoxia (54, 63). The hypoxia acclimation response that is typical of lowlanders can involve adaptive physiological adjustments that improve oxygen transport rates, but it can also include maladaptive responses that are counterproductive to oxygen transport over the course of prolonged hypoxia exposure (47, 63, 72). The unique genotypic adaptations of highlanders generally improve oxygen transport in hypoxia (54, 63) and could, in principle, involve adaptive modifications in the ancestral acclimatization response to environmental hypoxia. Although there is good evidence that genotypic adaptation to high altitudes often blunts maladaptive hypoxia responses (18, 59), relatively few studies have assessed the interactive effects of highland ancestry and hypoxia acclimation on V̇o2max and its physiological basis in highland natives.
The capacity for oxygen diffusion in active skeletal muscle is one of the most important determinants of V̇o2max in hypoxia (8, 56, 69). Although some evidence suggests that acclimatization to high-altitude hypoxia increases muscle capillarity, it is more common for capillarity to be unaltered by high-altitude hypoxia in mammals (43). This finding is counter-intuitive given the potential benefit of muscle capillarity for oxygen transport in hypoxia, and the general expectation is that tissue oxygen limitation is a primary signal for angiogenesis (22). Some highland birds are characterized by increased muscle capillarity (33, 44, 55), but the potential interactive effects of highland ancestry and hypoxia acclimation on muscle capillarity are poorly understood.
The deer mouse (Peromyscus maniculatus) is an emerging model species for studying high-altitude physiology. This species has the broadest altitudinal distribution of any North American mammal, stretching from below sea level in Death Valley, California, to more than 4,300 m above sea level in numerous mountain ranges (30). Highland deer mice are subject to strong directional selection for increased aerobic capacity in hypoxia (25), presumably due to the high premium on thermogenesis and aerobic exercise performance under conditions of hypoxia and cold stress. Highland populations of deer mice are genetically distinct from lowland populations, and the inferred levels of gene flow are very low across the Great Plains-Colorado Front Range transition (60). Deer mice have proven to be extremely useful for understanding the genetic, molecular, and structural adaptations to high altitude that increase hemoglobin-oxygen affinity and that likely improve blood-oxygen transport in hypoxia (10, 48, 61, 62). Integrative physiological studies of deer mice, therefore, hold great promise for elucidating the mechanistic basis of high-altitude adaptation and acclimatization across the oxygen transport pathway.
The objective of this study was to determine how highland ancestry (which may reflect genotypic adaptation) and hypoxia acclimation affect V̇o2max, as well as muscle capillarity and oxidative phenotype in deer mice. To overcome the inherent limitations of studying individuals in their native environment for disentangling the effects of ancestry and environment, we established captive breeding colonies from wild-caught mice native to high and low altitudes. Our results on first generation (F1) lab-raised mice suggest that both genotypic adaptation and hypoxia acclimation can improve oxygen transport capacity in hypoxia, but that adaptation alone affects muscle capillarity and oxidative phenotype.
MATERIALS AND METHODS
Populations of highland and lowland deer mice.
Captive breeding populations of deer mice were created, as previously described (12). Adults were live trapped at high altitude on the summit of Mount Evans (Clear Creek County, CO, at 39°35′18′′N, 105°38′38′′W, 4,350 m above sea level) (P. m. rufinus) and at low altitude in the Great Plains (Nine Mile Prairie, Lancaster County, NE, at 40°52′12′′N, 96°48′20.3′′W, 430 m above sea level) (P. m. nebracensis). Mice were then transported to the University of Nebraska (elevation 360 m) and housed in common-garden lab conditions to be used as a parental stock to produce F1 progeny. The F1 progeny were born and raised in a common normoxic environment and then shipped to McMaster University (elevation 50 m) for all experiments in this study. Mice were held at McMaster University in standard holding conditions at 24–25°C with unlimited access to chow and water for at least 1 mo before experimentation (12:12-h light-dark photoperiod). All animal protocols followed guidelines established by the Canadian Council on Animal Care and were approved by the McMaster University Animal Research Ethics Board.
Treatments.
Mice from each population were split into two acclimation groups: 1) normobaria in standard normoxic holding conditions, or 2) hypobaric hypoxia (barometric pressure of 60 kPa) equivalent to that at an elevation of 4,300 m. Mice in the hypoxia acclimation group were placed in specially designed hypobaric chambers, and pressure was decreased gradually over the first few days, as described previously (45). Mice were weighed every 3 days during cage cleaning, which required that the hypobaric groups be returned to normobaria for a brief period (<1 h). Mice were subjected to respirometry measurements (see below) after 6–8 wk of acclimation. After these measurements were completed, blood was collected from the maxillary vein using a lancet, and blood hemoglobin concentration was measured using Drabkin's reagent (Sigma-Aldrich, Oakville, ON, Canada), according to the manufacturer's instructions. Hematocrit was also measured on a subset of mice. Mice were then euthanized by cervical dislocation, lungs were weighed (i.e., lung wet mass) and frozen, and tissues were sampled as described below. Lungs were later dried to constant mass at 60°C in an oven to determine lung dry mass.
Respirometry measurements.
Maximal rates of oxygen consumption (V̇o2max) were measured in each mouse in both normoxia and normobaric hypoxia (12% O2 fraction, equivalent to 4,300 m elevation) using open-flow respirometry in a rodent treadmill (working chamber volume of ∼800 ml) that has been described previously (53). Mice were first placed on the treadmill and allowed to rest for 10 min to become accustomed to the chamber. Incurrent air was delivered at a flow rate of 2,000 ml/min using a mass-flow meter and pump (Sable Systems, Las Vegas, NV). Incurrent normoxic air was pulled from outside of the building and scrubbed free of water and CO2 using drierite, soda lime, and ascarite. Incurrent hypoxic air was delivered from a certified compressed gas mixture (balance N2). Excurrent chamber air was subsampled at 200 ml/min, dried using prebaked drierite, and passed through O2 and CO2 analyzers (Sable Systems). The treadmill (kept at a constant angle of 10°) was initially set at 4 m/min, and the speed was increased by 3 m/min every 2 min until exhaustion. This was defined as when any two of the following three conditions were met: 1) the mouse could no longer maintain position on the treadmill belt, 2) there is no increase in O2 consumption rate with speed, and/or 3) respiratory exchange ratio (quotient of CO2 production and O2 consumption rates) was greater than one. Data were acquired every 1 s with Expedata data acquisition software (Sable Systems), and V̇o2max was calculated as previously described (37). Normoxic and hypoxic exercise trials were conducted ∼1 wk apart for each mouse, and the order in which the trials were conducted was randomized.
Resting rates of oxygen consumption (V̇o2rest) were measured in a subset of unfasted mice from both populations that were acclimated to normoxia. Measurements were made at room temperature as described for treadmill exercise with the following exceptions. Trials were conducted in a small (∼500 ml) metabolic chamber that was covered to minimize stress, and air was supplied at a flow rate of 650 ml/min. Normoxic air was first supplied to the chamber for 1 h, followed by a 1-h exposure to hypoxic air (12% O2 fraction). The V̇o2rest data reported here are the minimum rates of oxygen consumption measured for one continuous minute in normoxia and in hypoxia.
Muscle histology.
One gastrocnemius muscle from each mouse was coated in embedding medium, frozen in liquid N2-cooled isopentane, and stored at −80°C. Tissue was sectioned (10 μm) transverse to muscle fiber length in a cryostat at −20°C. Capillaries were identified by staining for alkaline phosphatase activity (assay buffer concentrations in mM: 1.0 nitroblue tetrazolium, 0.5 5-bromo-4-chloro-3-indoxyl phosphate, 28 NaBO2, and 7 MgSO4; pH 9.3) for 1 h at room temperature. Oxidative muscle fibers (both slow and fast) were identified by staining for succinate dehydrogenase activity (assay buffer concentrations in mM: 0.6 nitroblue tetrazolium, 2.0 KH2PO4, 15.4 Na2HPO4, and 16.7 sodium succinate) for 1 h at room temperature. Slow oxidative muscle fibers were identified by slow myosin immunoreactivity using a mouse IgA primary antibody (S58; Developmental Studies Hybridoma Bank, Iowa City, IA) as follows. Sections were fixed in acetone for 10 min, blocked in 10% normal goat serum [made up of PBS (0.15 mol/l, pH 7.4) containing 1% Triton X-100 and 1.5% BSA (PBS/TX/BSA)] for 1 h, and incubated overnight at 2°C in S58 antibody solution (1:10 dilution in PBS/TX/BSA). The next morning, sections were treated with peroxidase blocking reagent (Dako, Burlington, ON, Canada) for 10 min, incubated in secondary antibody (rat anti-mouse biotin IgA; Southern Biotech, Birmingham, AL) solution (1:20 dilution in PBS/TX/BSA) for 1 h, incubated in ExtrAvidin-Peroxidase (1:50 dilution in PBS/TX/BSA; Sigma-Aldrich, Oakville, ON, Canada) for 30 min, and finally developed (0.4 mg/ml 3-amino-9-ethyl-carbazole and 0.02% H2O2 in 0.05 M sodium acetate buffer, pH 5.0) for ∼5 min. Sections were well rinsed in PBS between each of the above steps.
Stereological methods were used to make unbiased measurements of several histological variables for the above sections, as previously described (17, 71). Images were collected systematically using light microscopy, such that there was equal representation of images analyzed from across the entire gastrocnemius. Sufficient images were analyzed for each sample to account for heterogeneity, determined by the number of replicates necessary to yield a stable mean value (roughly half of the entire section was imaged). The density of fast oxidative fibers was calculated as the difference between the densities of oxidative fibers and slow oxidative fibers.
Fluorescence immunohistochemistry was also used to concurrently identify capillaries and slow oxidative muscle fibers, using a rat IgG primary antibody against CD31 protein (BD Biosciences, Mississauga, ON, Canada) and the S58 antibody, respectively, to qualitatively confirm the measurements that were made using light microscopy. Sections were blocked in 10% normal goat serum in PBS/TX/BSA for 1 h, and incubated overnight at 2°C in PBS/TX/BSA solution containing the S58 (1:10 dilution) and CD31 (1:400 dilution) primary antibodies. The next morning, sections were incubated in secondary antibody diluted in PBS/TX/BSA (1:400, Alexa Fluor 488 goat anti-rat IgG; 1:200, Alexa Fluor 594 goat anti-mouse IgG; Life Technologies, Burlington, ON, Canada) for 2 h. Sections were well rinsed in PBS between each of the above steps. Stained sections were imaged using a confocal fluorescence microscope.
Enzyme activity measurements.
Gastrocnemius and diaphragm muscles were frozen in liquid N2, powdered under liquid N2, and stored at −80°C. Samples weighing ≥20 mg were homogenized in 20 volumes of homogenization buffer (concentrations in mM: 100 KH2PO4, 5 ethylenediaminetetraacetic acid, and 0.1% Triton-X-100, at pH 7.2). Cytochrome c oxidase (COX) activity was assayed shortly after homogenization, and citrate synthase (CS) and lactate dehydrogenase (LDH) activities were measured after storage of homogenate at −80°C. Activity was assayed at 37°C by measuring the change in absorbance over time (CS, 412 nm; COX, 550 nm; LDH, 340 nm) under the following conditions (in mM unless otherwise stated): CS, 40 Tris, 0.01 oxaloacetate, 0.23 acetyl-coA, 0.1 DTNB, pH 8.0; COX, 100 KH2PO4, 0.1 reduced cytochrome c, pH 7.0; LDH, 40 Tris, 0.28 NADH, 2.4 pyruvate, and at pH 7.4. Preliminary experiments verified that substrate concentrations were saturating. All enzyme assays were run in triplicate. Enzyme activities were determined by subtracting the background rate (measured in control reactions that contained no substrate) from the rates measured in the presence of substrate. Extinction coefficients were determined empirically for each assay in the appropriate assay conditions.
RNA extraction and quantitative real-time PCR.
Total RNA was isolated from 30–40 mg of the powdered muscle samples using TRIzol reagent (Life Technologies), following the manufacturer's instructions. cDNA was then synthesized using SuperScript II RNase H− reverse transcriptase (Invitrogen, Burlington, ON, Canada) from 1 μg of total RNA (treated with DNase I), according to the manufacturer's instructions using a mixture of random hexamer and oligo-dT primers. The resulting cDNA was diluted 50-fold using RNase and DNase-free water (Invitrogen).
Transcript sequences were mined from deer mouse sequences in the NCBI sequence read archive (accession no. SRA051883, SRA091630) (11, 13), and were used as a template on which to design primers for quantitative real-time PCR (qPCR) using Primer 3 software (32, 68) (Table 1). Each qPCR reaction contained 4 μl of the five-fold diluted cDNA, 5 μl of Sso Fast Eva Green supermix (Bio-Rad, Mississauga, ON, Canada), 0.4 μl of each of forward and reverse primer (final concentration of 10 μM), and 0.2 μl of RNase and DNase-free water. Each reaction was run in duplicate using a CFX Connect real-time system (Bio-Rad), beginning with a 30-s initial denaturation at 95°C followed by 40 cycles of 95°C for 5 s and 60°C for 30 s. A control run with no template was run for each primer set to check for the presence of contaminants, and a dissociation curve was constructed after amplification for each sample to ensure that only a single product was amplified. Agarose gel electrophoresis of representative products was used to verify the presence of a single amplicon of the appropriate size. A standard curve for each primer set was generated for one sample, and all other samples were expressed relative to this standard. All results were normalized to the cDNA level of 12S rRNA gene. The cDNA level of 12S, as well as β-actin (actb), did not vary between groups.
Table 1.
Primers used for quantitative real-time PCR analysis of gene expression
| Target Transcript | Forward Primer | Reverse Primer |
|---|---|---|
| Angpt1 | TCAGTGGCTGCAAAAACTTG | TCAGTTTTCGGGTCTGCTCT |
| Angpt2 | GATCTTCCTCCAGCCCCTAC | TGCACCACATTCTGTTGGAT |
| Flt1 | AGCGGGACTTCTTCTTCCTC | CTGCAATCCTCGTCTTCCTC |
| Kdr | CCACCTCACCTGTTTCCTGT | TCTGTCTGGCTGTCATCTGG |
| Nrd1d1 | GCTCCACTTGTCTCCCTCAG | GAGTCAGGGACTGGAAGCTG |
| Ppara | CTCGTGCAGGTCATCAAGAA | ACCTAGGCTCAGCCCTCTTC |
| Ppard | CCCAGAATTCCTCTCCTTCC | ACAGCTCCGGTCACACTTCT |
| Pparg | CCGTGCAAGAGATCACAGAA | GGGCTCCATAAAGTCACCAA |
| Ppargc1a | CAAGCTGTTTTTGACGACGA | AGAGCAAGAAGGCGACACAT |
| Ppargc1b | AGAGGAACTGGTCAGCCTCA | CGTCAAGGACTCCTCAAAGC |
| Pprc1 | TTCCCTCATCTCCCTCATTG | CTCTCCCGAGGAGACACAAG |
| Tek | TTGGCCATGTGACAGTTTGT | CAAATGCCACACATCACTCC |
| Vegfa | GTACCTCCACCATGCCAAGT | ACCTCATTAGGGGCACACAC |
| 12S | CTGGCCATCGCTTAAAACTC | TTGCTTCCCACCTCATAAGC |
| Actb | GTCGTACCACTGGCATTGTG | AGGGCAACATAGCACAGCTT |
Western blot analysis.
Peroxisome proliferator-activated receptor γ (PPARγ) protein was measured in gastrocnemius muscle by Western blot analysis. The powdered muscle samples were briefly homogenized with a motorized homogenizer in ice-cold buffer (150 mM NaCl, 50 mM Tris·HCl, 1.0% Triton X-100, 0.5% deoxycholic acid, and 0.1% SDS, at pH 8.0). The protein isolates were denatured for 5 min at 100°C in Laemmli sample buffer (Bio-Rad) containing β-mercaptoethanol. Denatured proteins were separated in precast 12% sodium dodecyl sulfate-polyacrylamide gels (Bio-Rad) for 45 min at 120 V and then for 15 min at 150 V in a Mini-Protein Tetra System (Bio-Rad). Separated proteins were transferred to polyvinylidene difluoride membranes (Bio-Rad) at 25 V for 10 min using a Trans Blot Turbo Transfer System (Bio-Rad). Membranes were incubated in blocking solution overnight [5% skim milk powder in PBS-Tween (PBST) buffer: 1.5 mM NaH2PO4·H2O, 8.1 mM Na2HPO4, 145.5 mM NaCl, 0.05% Tween-20, at pH 7.4]. Membranes were then washed for 5 min in PBST and incubated for 1 h with primary antibody (a rabbit polyclonal antibody raised against human PPARγ that recognizes both γ1 and γ2 human isoforms and detects a band at ∼75 kDa; ab19481; Abcam, Cambridge, MA) diluted 1:500 in PBST containing 1% BSA (PBST-BSA). Membranes were then incubated for 1 h with donkey anti-rabbit secondary antibody (horseradish peroxidase conjugated; Santa Cruz Biotechnology, Santa Cruz, CA) at a dilution of 1:10,000 in PBST-BSA. Membranes were developed in ECL Clarity Solution (Bio-Rad), and band intensity was detected by chemiluminescence using a ChemiDoc MP Imaging System (Bio-Rad). A common sample was included on each gel to control for transfer efficiency, and bands were quantified using the gel analysis feature of Image Lab software (Bio-Rad). The band intensity of each sample was normalized to the amount of loaded protein (determined by Coomassie blue staining) and to the normalized band intensity of the common sample and is expressed here relative to lowland mice acclimated to normoxia.
Calculations and statistics.
V̇o2max data were corrected for body mass (Mb) using the residuals from allometric regressions. Least-squares regressions to the equation V̇o2max = a Mbb were carried out using GraphPad Prism software (La Jolla, CA). The residual from the regression was calculated for each individual, and these residuals were used for statistical comparisons (see below). Data are reported graphically as residuals as well as the sum of the residual and the expected V̇o2max value for an average-sized 22-g mouse (i.e., V̇o2max corrected to a body mass of 22 g). A similar residual approach was used to examine variation in capillarity that was independent of muscle oxidative phenotype, but in this case, we used a linear regression.
Data are generally reported as means ± SE (except when data points from individual samples are shown). Two-factor ANOVA and Bonferroni multiple-comparisons tests were used as appropriate to assess the main effects and interactions of ancestral altitude and acclimation environment. A significance level of P < 0.05 was used throughout.
RESULTS
Respirometry.
Both high-altitude ancestry and hypoxia acclimation improved aerobic exercise capacity in hypoxia. The maximal rate of oxygen consumption (V̇o2max) in hypoxia (measured on a treadmill at 12% inspired O2 fraction) increased by ∼13% in both populations after 6–8 wk of acclimation to hypobaric hypoxia (60 kPa total pressure, equivalent to that at an elevation of 4,300 m), based on comparisons between hypoxia and normoxia acclimation groups within each population (Fig. 1A). Hypoxic V̇o2max was ∼8% higher in highland deer mice than in lowland deer mice when compared in either normoxic or hypoxic acclimation treatments (Fig. 1A). There was no significant interaction between ancestry and acclimation treatment, indicating that the ancestral acclimation response of V̇o2max to hypoxia has been retained in high-altitude mice that are subject to chronic hypoxia in their native habitat. Because we observed allometric rather than isometric scaling of V̇o2max to body mass, we used a residual-based approach to correct for body mass before making these comparisons (Fig. 1B).
Fig. 1.

Maximal rates of oxygen consumption (V̇o2max) in hypoxia were greater in highland deer mice than in lowland deer mice. The effects of highland ancestry and hypoxia acclimation on hypoxic V̇o2max were assessed by calculating the residuals (A) for an allometric regression of hypoxic V̇o2max to body mass (Mb; V̇o2max = 0.67 Mb0.49) (B). Similar comparisons were made for normoxic V̇o2max with the residuals (C) for the regression of normoxic V̇o2max to body mass (V̇o2max = 0.53 Mb0.65) (D). A and C: left axis shows the hypoxic and normoxic V̇o2max for an average-sized 22-g mouse, calculated for each group by adding the residual to the V̇o2max predicted at 22 g by the regression. There was a significant effect on hypoxic V̇o2max of both ancestry (*F1,43 = 5.02; P = 0.030) and acclimation (†F1,43 = 12.20; P = 0.001), with no significant interaction between each factor (F1,43 = 0.0192; P = 0.891), but there was no significant variation in normoxic V̇o2max (ancestry F1,43 = 0.188; P = 0.667; acclimation F1,43 = 2.27; P = 0.139; interaction F1,43 < 0.001; P = 0.999). B and D: dashed gray lines represent 95% confidence intervals of the allometric regression, and n = 9 for normoxic lowlanders (Nor-low, ▲), n = 10 for hypoxic lowlanders (Hyp-low, △), n = 14 for normoxic highlanders (Nor-high, dark gray inverted triangles), n = 14 for hypoxic highlanders (Hyp-high, light gray inverted triangles).
Aerobic exercise capacity in normoxia was not affected by either high-altitude ancestry or hypoxia acclimation. Hypoxia acclimation led to only a slight (∼4%), but statistically nonsignificant, increase in V̇o2max in normoxia, and there were no differences between highlanders and lowlanders (Fig. 1C). Rates of oxygen consumption measured in normoxia-acclimated mice at rest were similar in highland mice (0.96 ± 0.10 ml/min at 21% O2, 0.41 ± 0.07 ml/min at 12% O2) and lowland mice (1.11 ± 0.09 ml/min at 21% O2, 0.45 ± 0.08 ml/min at 12% O2), suggesting that mice can increase rates of aerobic metabolism by approximately four-fold when exercising in normoxia and approximately five- to six-fold when exercising in hypoxia and that the observed effects of highland ancestry on V̇o2max should result in comparable improvements in aerobic scope.
Lung and blood measurements.
There were interactive effects of high-altitude ancestry and hypoxia acclimation on lung size. Lung wet mass increased by ∼23% in lowland mice in response to hypoxia acclimation, but this response was blunted to only ∼8% in the highland mice (Fig. 2A). The effect of ancestry on the magnitude of the response was not attributable to differences in lung dry mass, which underwent a similar ∼20–30% increase in both groups. Instead, it is the difference in lung water content that distinguishes lowland mice (81.0 ± 0.6%) from highland mice (79.2 ± 0.6%) after hypoxia acclimation.
Fig. 2.
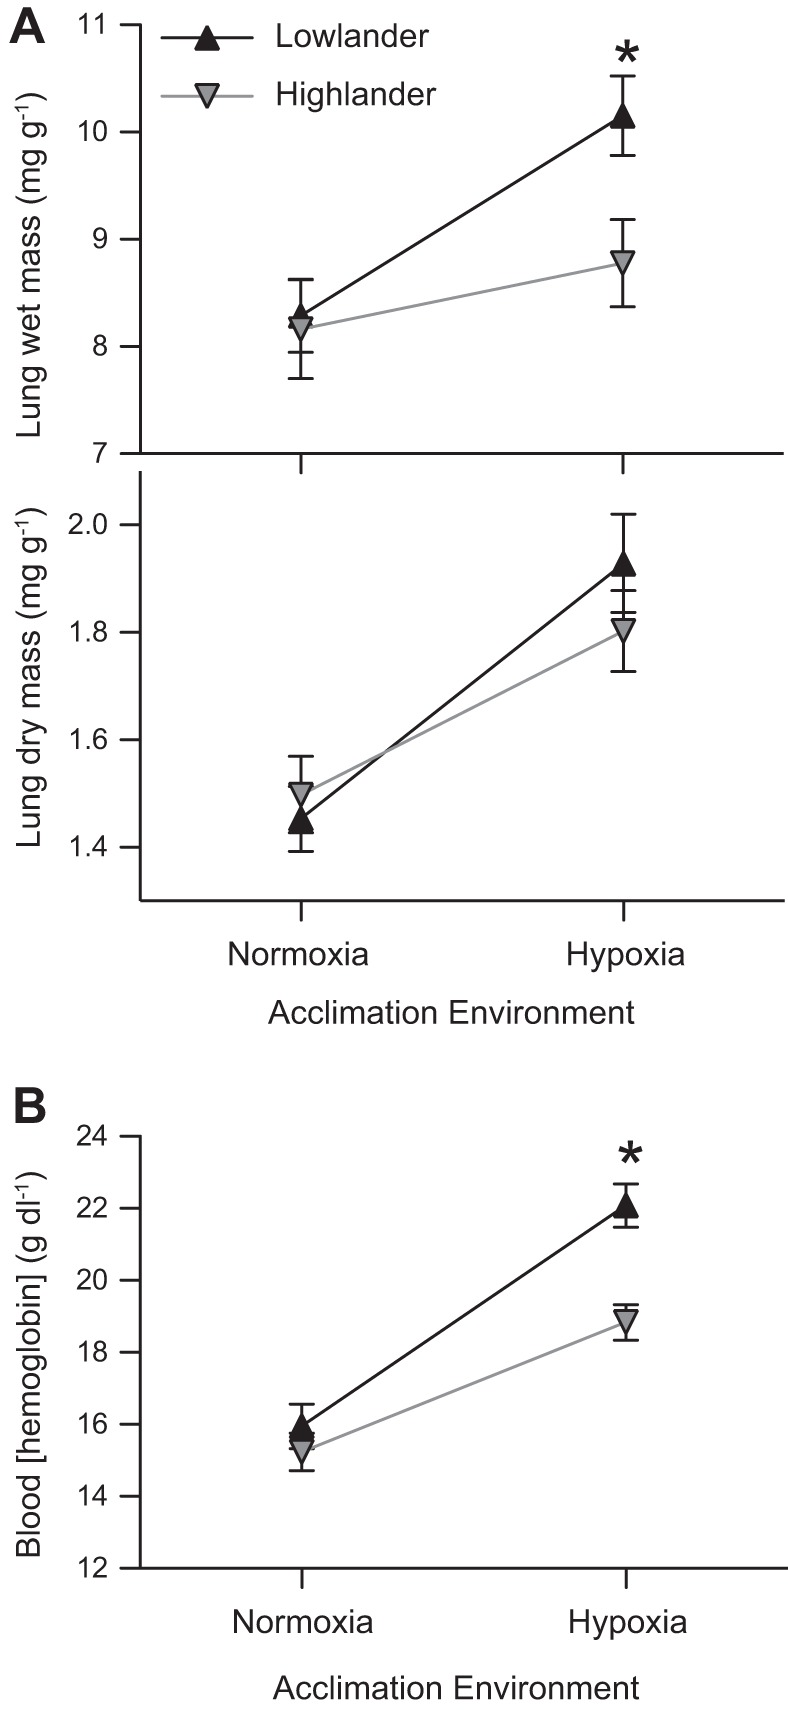
Some responses to hypoxia acclimation are blunted in highland deer mice. A: hypoxia acclimation increased both wet lung mass (F1,72 = 9.35; P = 0.003) and dry lung mass (F1,70 = 24.32; P < 0.001) (both relative to body mass). The effect of altitude of ancestry on wet lung mass neared significance (F1,72 = 3.42; P = 0.069), and there was a significant pairwise difference between highlanders and lowlanders in hypoxia (*P < 0.001), but there were no effects of ancestry on dry lung mass (F1,70 = 0.261; P = 0.611). Normoxic lowlanders, n = 16 and 14, respectively; all other groups, n = 20. B: hemoglobin content of the blood was affected by hypoxia acclimation (F1,65 = 76.37 P < 0.001), ancestry (F1,65 = 12.62; P = 0.001), and their interaction (F1,65 = 5.18; P = 0.026). Normoxic lowlanders, n = 14; hypoxic lowlanders, n = 18; normoxic highlanders, n = 18; and hypoxic highlanders, n = 19.
There were similar interactive effects of high-altitude ancestry and hypoxia acclimation on blood hemoglobin content and hematocrit. Hemoglobin content was similar between populations in normoxia, but it increased by a much greater magnitude in lowland mice (∼38%) than in highland mice (∼23%) after hypoxia acclimation (Fig. 2B). The blunted response in the highlanders resulted in a significant ancestry × acclimation environment interaction for blood hemoglobin content. Blood hematocrit also increased by a greater magnitude in lowlanders (46.2 ± 0.9% in normoxia, 59.1 ± 2.1% in hypoxia; n = 7) than in highlanders (42.6 ± 1.4% in normoxia, 51.5 ± 2.0% in hypoxia; n = 10), as there was a significant main effect of both altitude of ancestry (F1,30 = 10.28; P = 0.003) and hypoxia acclimation (F1,30 = 38.80; P < 0.001) and a significant pairwise difference between highlanders and lowlanders in hypoxia.
Muscle phenotype.
High-altitude ancestry, but not hypoxia acclimation, was associated with elevated capillarity in the locomotory (gastrocnemius) muscle. Several indices of capillarity were greater in highland mice than in lowland mice, including capillary surface density (∼35–41% higher), capillary-to-fiber ratio (∼20–30% higher), and capillary density (∼9–18% higher) (Figs. 3 and 4). The greater effect of ancestry on capillary surface density than on capillary density may have been associated with an increase in vessel tortuosity in the highland mice relative to the lowland mice. This was suggested by a large difference in the pattern of capillary staining, observed using both alkaline phosphatase histochemistry (Fig. 3, A and B) and immunohistochemistry against CD31 protein (Fig. 3, G and H): staining wrapped the muscle fibers much more often in highland mice (probably indicating that the capillary was sectioned longitudinally to vessel length) than in lowland mice (where staining was more discrete, indicating that the capillary was sectioned transversely).
Fig. 3.

Histological analysis of capillarity and fiber type in the gastrocnemius muscle of deer mice. Quantification using stereological methods was carried out for capillaries that were identified using alkaline phosphatase activity (A and B), oxidative muscle fibers that were identified using succinate dehydrogenase (SDH) activity (C and D), and slow oxidative muscle fibers that were identified by staining slow myosin ATPase using peroxidase immunohistochemistry (E and F). Capillaries (green) and slow myosin (red) were also identified concurrently using fluorescence immunohistochemistry (G and H). There were clear differences in staining intensity between highland (A, C, E, G) and lowland (B, D, F, H) deer mice.
Fig. 4.
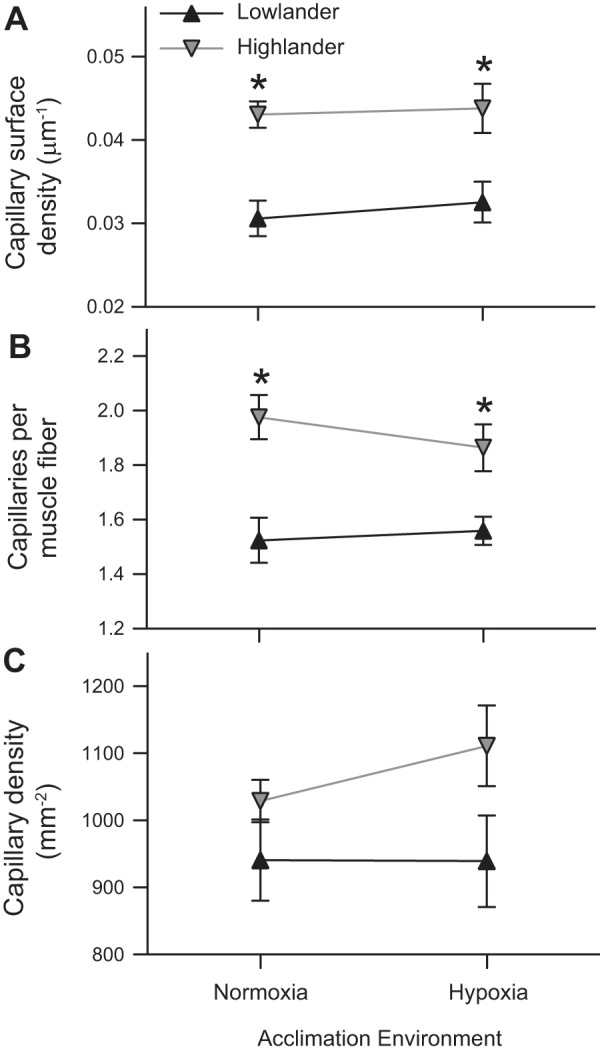
Capillarity in the gastrocnemius muscle is greater in highland deer mice than in lowland deer mice, but it is not affected by hypoxia acclimation. There were significant effects of altitude of ancestry on capillary surface density (CSD; μm of capillary surface per μm2 of transverse muscle area) (F1,33 = 25.06; P < 0.001) (A), the number of capillaries per muscle fiber (C:F) (F1,33 = 23.64; P < 0.001) (B), and the density of capillaries (CD; capillaries per mm2 of transverse muscle area) (F1,33 = 5.22; P = 0.029) (C). The effects of hypoxia acclimation were not significant (CSD F1,33 = 0.319; P = 0.576; C:F F1,33 = 0.242; P = 0.626; and CD F1,33 = 0.504; P = 0.483). *Significant pairwise difference between highlanders and lowlanders within an acclimation environment (P < 0.05). Normoxic lowlanders, n = 8; hypoxic lowlanders, n = 9; normoxic highlanders, n = 10; and hypoxic highlanders, n = 10.
High-altitude ancestry was also associated with a more oxidative phenotype of the gastrocnemius muscle. Highland deer mice had a greater proportion of oxidative fibers in the muscle, ∼25–30% as a proportion of the total transverse area of the muscle and ∼7–17% as a proportion of total fiber number (Figs. 3 and 5). The main cause of these differences was a 60–70% higher abundance of slow oxidative (type I) muscle fibers by area (Figs. 3 and 5), but there were also smaller nonsignificant differences in the abundance of fast oxidative (type IIa) muscle fibers (Table 2). The differences in areal density between populations were generally greater than the differences in numerical density because both slow and fast oxidative fibers were larger in highland deer mice (by ∼20% or more) with no difference in the size of fast glycolytic fibers (Table 2). In contrast, hypoxia acclimation had no significant effects on fiber-type composition in the gastrocnemius muscle.
Fig. 5.

Highland deer mice have a more oxidative phenotype in the gastrocnemius muscle. There were significant effects of altitude of ancestry on the areal density of oxidative fibers [AA(ox,m), area of oxidative fibers relative to the total transverse area of the muscle (F1,34 = 19.59; P < 0.001)], the numerical density of oxidative fibers [NN(ox,m), number of oxidative fibers relative to the total number of fibers (F1,34 = 8.44; P = 0.006)], and the areal [AA(sox,m); F1,33 = 28.18; P < 0.001], and numerical [NN(sox,m); F1,33 = 8.24; P = 0.007] densities of slow oxidative fibers. The effects of hypoxia acclimation were not significant [AA(ox,m) F1,34 = 0.122; P = 0.729; NN(ox,m) F1,34 = 0.306; P = 0.584; AA(sox,m) F1,33 < 0.001; P = 0.994; NN(sox,m) F1,33 = 0.270; P = 0.607]. *Significant pairwise difference between highlanders and lowlanders within an acclimation environment (P < 0.05). Normoxic lowlanders, n = 9/9; hypoxic lowlanders, n = 10/10; normoxic highlanders, n = 10/9; hypoxic highlanders, n = 9/9 (oxidative fibers/slow oxidative fibers, respectively).
Table 2.
Fiber types in the gastrocnemius muscle of deer mice
| Variable | Env. | Lowlanders | Highlanders | Main Effect Variable | F | P |
|---|---|---|---|---|---|---|
| AA(IIa,m) | Norm | 0.288 ± 0.034 | 0.341 ± 0.032 | Anc. | 2.524 | 0.122 |
| Hyp | 0.285 ± 0.018 | 0.314 ± 0.009 | Env. | 0.340 | 0.564 | |
| NN(IIa,m) | Norm | 0.340 ± 0.031 | 0.390 ± 0.028 | Anc. | 0.389 | 0.537 |
| Hyp | 0.366 ± 0.023 | 0.347 ± 0.012 | Env. | 0.119 | 0.733 | |
| Type I area | Norm | 1025 ± 58 | 1523 ± 90* | Anc. | 23.61 | <0.001 |
| Hyp | 1141 ± 77 | 1362 ± 64 | Env. | 0.087 | 0.770 | |
| Type IIa area | Norm | 1393 ± 86 | 1691 ± 80 | Anc. | 7.067 | 0.012 |
| Hyp | 1350 ± 95 | 1548 ± 108 | Env. | 0.992 | 0.327 | |
| Type IIb area | Norm | 2185 ± 169 | 2483 ± 124 | Anc. | 0.157 | 0.695 |
| Hyp | 2325 ± 137 | 2145 ± 168 | Env. | 0.442 | 0.511 |
Transverse area of each fiber type (slow oxidative, type I; fast oxidative, type IIa; fast glycolytic, type IIb) are reported in square micrometers.
AA(IIa,m), areal density of fast oxidative fibers; NN(IIa,m), numerical density of fast oxidative fibers; Norm, normoxia; Hyp, hypoxia.
One degree of freedom for each main effect variable (Anc., altitude of ancestry; Env., acclimation environment) and 33 for the residual.
Significant pairwise difference between highlanders and lowlanders within an acclimation environment.
We used a regression approach to assess whether the variation in capillarity was merely a result of the potentially greater oxygen demands associated with having a more oxidative muscle phenotype. There is generally a strong relationship between the mitochondrial oxygen demands of a tissue and the capillary surface available for oxygen supply (27). Consistent with this expectation, there was a strong linear correlation between capillary surface density and the areal density of oxidative fibers (Fig. 6A). However, residuals of capillary surface density from this regression to the areal density of oxidative fibers were significantly higher in highland deer mice than in lowland deer mice (Fig. 6B). This observation suggests that capillarity is enhanced in highlanders by a greater magnitude than would be expected solely from the effects of having a greater abundance of oxidative muscle fibers.
Fig. 6.

Highland deer mice have a greater capillarity than expected from the variation in muscle oxidative phenotype. A: there was a strong linear correlation between capillary surface density (CSD) and the areal density of oxidative fibers [AA(ox,m)] in the gastrocnemius muscle [CSD = 0.0699 AA(ox,m) + 0.00591; P < 0.001]. Symbols are as described in Fig. 1, and dashed lines represent the 95% confidence interval of the regression. B: there was a significant effect of altitude of ancestry on the residual CSD from the regression in A (F1,32 = 4.78; P = 0.036), reflected by a greater overall residual CSD in highlanders than in lowlanders (*), but there was no significant effect of hypoxia acclimation (F1,32 = 1.91; P = 0.177).
The histological differences in capillarity and oxidative phenotype were associated with commensurate differences in the maximal in vitro activity of oxidative enzymes. Highland deer mice had ∼52–71% higher activities of COX, ∼29–35% higher activities of CS, and ∼20–30% lower activities of LDH in the gastrocnemius muscle (Fig. 7). Differences were not restricted to the locomotory muscle, as there was a similar difference in COX activity in the diaphragm (Fig. 7). Interestingly, the ratio of COX/CS activities in the gastrocnemius was significantly greater in highland deer mice (0.75 ± 0.03 in normoxia and 0.64 ± 0.04 in hypoxia) than in lowland deer mice (0.56 ± 0.06 in normoxia and 0.56 ± 0.09 in hypoxia) (F1,30 = 6.52; P = 0.016). Comparable differences in the COX/CS ratios in the diaphragm were also observed between highland (0.83 ± 0.09 in normoxia and 0.83 ± 0.06 in hypoxia) and lowland (0.46 ± 0.06 in normoxia and 0.61 ± 0.06 in hypoxia) mice (F1,30 = 15.71; P < 0.001).
Fig. 7.

Oxidative capacity in the gastrocnemius muscle and diaphragm. There was a significant effect of altitude of ancestry on the activities of cytochrome c oxidase (COX; F1,30 = 16.52; P < 0.001), citrate synthase (CS; F1,30 = 15.88; P < 0.001), and lactate dehydrogenase (LDH; F1,30 = 13.52; P < 0.001) in the gastrocnemius muscle, but no effect of hypoxia acclimation (COX F1,30 < 0.001; P = 0.980; CS F1,30 = 1.96; P = 0.172; LDH F1,30 = 2.39; P = 0.133). There was also a significant effect of ancestry on the activities of COX (F1,33 = 18.94; P < 0.001) in the diaphragm, but not on the activities of CS (F1,33 = 2.14; P = 0.153) or LDH (F1,33 = 1.26; P = 0.269), and there were no significant effects of hypoxia acclimation (COX F1,33 = 3.18; P = 0.084; CS F1,33 = 2.44; P = 0.128; LDH F1,33 = 0.578; P = 0.452). *Significant pairwise difference between highlanders and lowlanders within an acclimation environment (P < 0.05). Normoxic lowlanders, n = 7/7; hypoxic lowlanders, n = 7/10; normoxic highlanders, n = 9/10; hypoxic highlanders, n = 11/10 (gastrocnemius/diaphragm, respectively).
Expression of candidate genes in the muscle.
The expression of 13 candidate genes that are important for regulating angiogenesis and energy metabolism (including mitochondrial biogenesis) was compared between populations and acclimation environments, and two of these candidate genes were differentially expressed between highland and lowland deer mice (Fig. 8, Table 3). PPARγ transcript (Pparg) abundance was approximately twofold higher in highlanders than in lowlanders (Fig. 8B). PPARγ protein abundance was elevated in highlanders by a comparable magnitude, but its abundance also increased with hypoxia acclimation (Fig. 9). The level of transcript abundance of VEGF A (Vegfa), detected using qPCR primers (Table 1) that were designed to recognize all known Vegfa splice variants, was only 35–55% in highlanders compared with the abundance in lowlanders.
Fig. 8.

Expression of candidate genes involved in regulating angiogenesis (A) and energy metabolism (B). Reaction norms for gene expression in each acclimation environment are shown with normoxia on the left and hypoxia on the right. The relative abundance of vascular endothelial growth factor (VEGF) A (Vegfa) and peroxisome proliferator-activated receptor (PPAR) γ (Pparg) transcripts was significantly affected by altitude of ancestry (Vegfa F1,20 = 13.56; P = 0.002; Pparg F1,20 = 14.48; P = 0.001). Expression of several genes decreased in response to hypoxia acclimation, including Vegfa, PPARα (Ppara), PPARδ (Ppard), PPARγ coactivator (PGC) 1β (Ppargc1b), PGC-related protein 1 (Pprc1), and nuclear receptor subfamily 1 group D member 1 (Rev-ErbA α; Nrd1d1). The expression of the remaining candidate genes were unaffected by both ancestry and acclimation environment, including angiopoietin 1 (Angpt1), angiopoietin 2 (Angpt2), VEGF receptor 1 (Flt1), VEGF receptor 2 (Kdr), angiopoietin receptor (Tek), and PGC-1α (Ppargc1a). Two-factor ANOVA results are shown in Table 2. *Significant pairwise difference between highlanders and lowlanders within an acclimation environment (P < 0.05). †Significant main effect of acclimation environment (see Table 3). Normoxic lowlanders, n = 7; hypoxic lowlanders, n = 4; normoxic highlanders, n = 7; hypoxic highlanders, n = 6.
Table 3.
Two-factor ANOVA results for gene expression data
| Altitude of Ancestry |
Acclimation Environment |
|||
|---|---|---|---|---|
| Transcript | F | P | F | P |
| Angpt1 | 2.734 | 0.116 | 0.599 | 0.449 |
| Angpt2 | 0.229 | 0.638 | 0.018 | 0.895 |
| Flt1 | 0.083 | 0.776 | 0.736 | 0.401 |
| Kdr | 0.059 | 0.810 | 0.835 | 0.371 |
| Nrd1d1 | 0.177 | 0.679 | 10.80 | 0.004 |
| Ppara | 0.014 | 0.907 | 5.650 | 0.028 |
| Pparg | 14.48 | 0.001 | 0.106 | 0.748 |
| Ppargc1a | 0.175 | 0.680 | 0.232 | 0.636 |
| Ppargc1b | 0.768 | 0.391 | 8.454 | 0.009 |
| Ppard | 1.398 | 0.250 | 6.446 | 0.019 |
| Pprc1 | 8.047 | 0.545 | 8.047 | 0.011 |
| Tek | 0.128 | 0.724 | 3.385 | 0.081 |
| Vegfa | 13.56 | 0.002 | 7.502 | 0.014 |
One degree of freedom for each main effect variable (altitude of ancestry, acclimation environment) and their interaction, and 20 degrees of freedom for the residual.
Fig. 9.
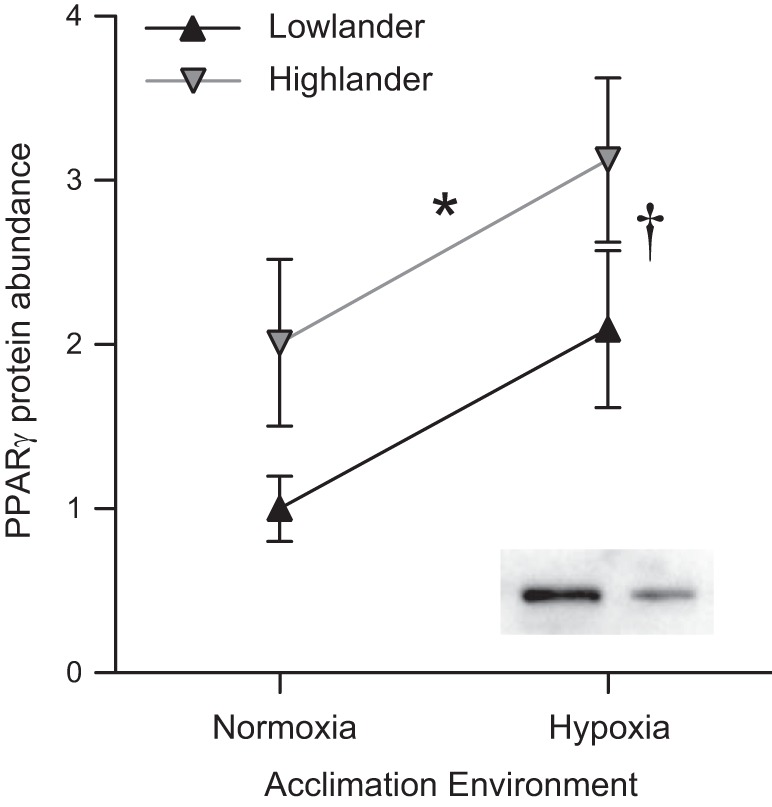
Highland deer mice have higher PPARγ protein abundance in the gastrocnemius muscle. There was a significant main effect on PPARγ protein abundance of both altitude of ancestry (*F1,24 = 5.36; P = 0.030) and acclimation environment (†F1,24 = 6.25; P = 0.020), with no significant interaction between each factor (F1,24 < 0.001; P = 0.982) (n = 7 for all groups). Insets are representative immunoreactive bands for a highlander (left) and a lowlander (right), each acclimated to hypoxia.
The expression of several candidate genes decreased in the muscle in response to hypoxia acclimation (Fig. 8, Table 3). Vegfa expression decreased in response to hypoxia in both populations to levels of transcript abundance that were 42–66% of those in normoxia, suggesting that both highland ancestry and hypoxia acclimation altered Vegfa expression in the same direction. The expression of several metabolic regulators also decreased in response to hypoxia acclimation (to levels ranging from 25 to 56% of normoxic controls), including PPARα (Ppara), PPARδ (Ppard), PPARγ coactivator (PGC) 1β (Ppargc1b), PGC-related protein 1 (Pprc1), and nuclear receptor subfamily 1 group D member 1 (“Rev-ErbA α”; Nrd1d1). The expression of the remaining candidate genes—angiopoietin 1 (Angpt1), angiopoietin 2 (Angpt2), VEGF receptor 1 (Flt1), VEGF receptor 2 (Kdr), angiopoietin receptor (Tek), and PGC-1α (Ppargc1a)—were unaffected by both ancestry and acclimation environment. There were no candidate genes whose transcripts increased in abundance in response to hypoxia acclimation.
DISCUSSION
Deer mice at high altitudes sustain high metabolic rates to support locomotion and thermogenesis (24) and are under strong directional selection for an increased aerobic capacity in hypoxia (25). Our results show that high-altitude adaptation has promoted an enhanced rate of maximal oxygen consumption (V̇o2max) in hypoxia in F1 generation deer mice with highland ancestry. Hypoxia acclimation also enhanced V̇o2max in hypoxia by a similar magnitude in both highland and lowland mice and should have, thus, facilitated the overall process of high-altitude adaptation in this species. The effects of highland ancestry on aerobic capacity were associated with an increase in the capillarity and oxidative capacity of the locomotory muscle, possibly due, in part, to an increase in the expression of PPARγ. Both genotypic adaptation and phenotypic plasticity, therefore, contribute to aerobic performance (and presumably fitness) at high altitudes, but each process is at least partially underpinned by distinct physiological and molecular mechanisms.
Oxygen transport at high altitudes.
Our results show that both genotypic adaptation and phenotypic plasticity can enhance V̇o2max in hypoxia in deer mice. Although previous findings have suggested that both ancestry and environment can contribute to V̇o2max in high-altitude deer mice (9, 10, 12, 52), we are the first to use F1 generation mice to clearly distinguish their relative effects. There was no statistical interaction between the effects of highland ancestry and hypoxia acclimation on V̇o2max in hypoxia (Fig. 1), suggesting that genotypic adaptation has not changed the overall functional outcome of the ancestral acclimatization response to high-altitude hypoxia. Like the increase in V̇o2max, the dry mass of the lungs increased in parallel after hypoxia acclimation in highland and lowland deer mice (Fig. 2), suggesting that each population increased the amount of lung tissue available for gas exchange to enhance oxygen uptake in hypoxia (23, 31).
Genotypic adaptation to high altitudes appears to have blunted the increases in lung water, blood hemoglobin content, and hematocrit that occur with hypoxia acclimation in lowland deer mice (Fig. 2). The former may indicate that highland deer mice are less prone to developing pulmonary edema in hypoxia, which is counterproductive to gas exchange and can result from hypoxic pulmonary vasoconstriction and hypertension in lowland species that sojourn to high elevation (6, 41). This would be consistent with some other highland mammals, in which the degree of hypoxic pulmonary hypertension is modest compared with lowlanders (18, 39). Alternatively, the blunted increase in lung water content in highlanders may indicate that their lungs contain proportionally less blood. The attenuated increase in blood hemoglobin content and hematocrit after hypoxia acclimation in highlanders is also consistent with findings in many other highland taxa (5, 47, 59) and may have arisen because a strong erythropoietic response can overshoot the optimal blood hemoglobin content at elevation, increase blood viscosity, and lead to cardiovascular complications. These patterns are consistent with countergradient variation, in which genotypic adaptation opposes the ancestral acclimation response, and have likely arisen because the ancestral responses are maladaptive at high altitudes (63).
The higher hypoxic V̇o2max in highland deer mice is associated with greater capillarity in the locomotory muscle (Figs. 3 and 4). The magnitude of this increase in capillarity appears to be greater than the increase in abundance of oxidative fibers (Fig. 6). This would suggest that oxygen diffusion capacity is further enhanced to improve oxygen transport in hypoxia if the variation in oxidative fiber density is reflective of similar variation in muscle oxidative capacity. The comparable population differences in the areal density of oxidative fibers and the activity of CS (but not COX) in the gastrocnemius muscle (Fig. 7) suggest that this might, indeed, be the case. Surprisingly, the increase in capillarity was not associated with highland deer mice having a higher V̇o2max in normoxia (Fig. 1), despite the strong theoretical advantage that a high oxygen diffusion capacity should impart for V̇o2max across a wide range of environmental oxygen tensions (8, 56, 69). This distinction underscores the complexity and interactions between the various systems-level adjustments, potentially from across the O2 cascade (i.e., ventilation, pulmonary O2 diffusion, circulation, tissue O2 diffusion, O2 utilization), which could improve V̇o2max in hypoxia. The best understood high-altitude adaptation in deer mice (and in many other species) is an increase in inherent hemoglobin-oxygen affinity (10, 48, 61, 62), which is generally presumed to be adaptive under severe hypoxia because it helps preserve arterial oxygen saturation in spite of the reduced alveolar and arterial Po2, thereby minimizing decrements in peripheral oxygen delivery. In normoxia, however, when arterial blood is fully saturated, a high hemoglobin-oxygen affinity will reduce the mean capillary O2 tension (the driving force for O2 diffusion) and could act to reduce V̇o2max (4, 42, 66, 67). Therefore, the combination of a high hemoglobin-oxygen affinity and an increase in oxygen diffusion capacity in the muscle would act synergistically to improve V̇o2max in hypoxia but could act in opposition and have no effect on V̇o2max in normoxia.
High-altitude adaptation and muscle phenotype.
The highly oxidative phenotype of skeletal muscle in highland deer mice is consistent with previous findings in some high-altitude bird species (33, 44, 55) and could have multiple potential benefits at high altitudes. Highland animals must generally cope with colder temperatures than lowland animals, so a more oxidative muscle phenotype could have evolved to enhance the capacity for shivering and possibly nonshivering thermogenesis (46). A highly oxidative muscle phenotype may also be a strategy for increasing the total mitochondrial O2 flux of an entire muscle when intracellular O2 tensions fall (29, 57). Mitochondrial respiration can become O2 limited during intracellular hypoxia (20), which would limit the maximum attainable respiration of individual muscle fibers. The greater abundance of oxidative fibers in highland deer mice could, therefore, represent a surplus aerobic capacity in normoxia, but an important counterbalance for the inhibitory effects of hypoxia in individual muscle fibers.
The oxidative muscle phenotype of highland deer mice occurs in conjunction with an increase in the activity and expression of enzymes involved in oxidative phosphorylation, the tricarboxylic acid cycle, and fatty acid oxidation (11, 13). The magnitude of the differences between populations was comparable (∼25%) for the areal density of oxidative fibers (Fig. 5), citrate synthase activity, and lactate dehydrogenase activity (Fig. 7). The change in fiber-type composition in the gastrocnemius muscle of highland mice may, therefore, drive an increased capacity for substrate oxidation and a reduced capacity for anaerobic glycolysis. In contrast, the magnitude of the increase in cytochrome c oxidase activity in highlanders was greater than the increase in oxidative fiber density, and the ratio of COX/CS activity was also greater in highlanders. This excess capacity of COX should have important implications for mitochondrial function in hypoxia because it would allow each COX enzyme to operate at a lower turnover rate, which would help sustain mitochondrial respiration at lower oxygen tensions (i.e., it would increase mitochondrial oxygen affinity) (21).
Unlike the appreciable differences between populations, hypoxia acclimation had only modest and statistically insignificant effects on muscle capillarity and oxidative capacity. This is consistent with many (but not all) previous studies of high-altitude acclimation in lowland mammals, in which muscle capillarity and oxidative capacity do not change or even decrease in response to hypoxia (34, 43).
Muscle phenotype and gene expression.
The highly capillarized and oxidative phenotype of the skeletal muscle of highlanders was associated with elevated mRNA expression and protein abundance of PPARγ (Figs. 8 and 9), consistent with recent findings that the pparg gene is a strong target of selection in high-altitude Tibetan and Mongolian peoples (74). Although PPARγ expression is generally lower in muscle than in adipose tissue, activation of muscle-specific PPARγ can promote insulin sensitivity, shift the skeletal muscle toward a more oxidative phenotype, and increase COX expression in the muscle (2, 28). This could result from PPARγ-induced production of adiponectin and a corresponding increase in mitochondrial biogenesis (1, 2, 50). PPARγ activation has also been shown to increase capillarity in adipose tissue (19), so the upregulation of PPARγ that we observed in the locomotory muscle of highlanders could have contributed to the heightened capillarity in this population. In contrast, transcripts of many other regulators of energy metabolism (i.e., most other PPAR and PGC transcripts measured) declined in hypoxia and were expressed at similar levels between populations (Fig. 8), counter to the general expectation that these regulators will be expressed at higher levels in muscles enriched with slow oxidative fibers (38).
The highly capillarized muscle of highlanders was not associated with a persistent upregulation of genes involved in angiogenesis in the muscle (22). In fact, the combined transcript abundance of all vegfa splice variants declined in hypoxia and was lower in highlanders (Fig. 8). This is consistent with previous observations that chronic hypoxia reduces VEGF expression in the skeletal muscle of rats (49), but it contrasts a recent suggestion that high expression of some VEGF splice variants is associated with highland residency in the plateau pika (Ochotona curzoniae) (35). It is possible that the higher muscle capillarity in highland mice is initiated by enhanced VEGF expression in early development, but we had anticipated that persistent differences in VEGF expression might contribute to maintaining the differences in muscle capillarity into adulthood. High basal capillarity in the muscle of mice that are selectively bred for voluntary wheel running is associated with elevated VEGF protein in several locomotory muscles (3). Furthermore, basal capillarity is reduced substantially by a targeted deletion of VEGF from all cell types in the muscle tissue of cage-confined mice (assessed using intramuscular injection of Cre recombinase into a localized region of the gastrocnemius of VEGFloxP mice) (65). In contrast, targeted deletion of VEGF in only the myofibers in the muscle has no effect on basal capillarity in cage-confined mice, although it does inhibit the angiogenic response to exercise training (15). Therefore, it is foreseeable that our results could be ascribed to differences in VEGF expression patterns between cell types in the muscle. Overall variation in VEGF transcript abundance for the whole muscle could be driven by patterns of expression in myofibers that are not related to basal muscle capillarity, such as the lower expression in highlanders and the general decline in hypoxia. Higher expression could have gone undetected in other less abundant cell types in the muscle (e.g., vascular endothelial cells, smooth muscle, etc.) of highlanders, and such cryptic differences in gene expression may have contributed to their higher basal capillarity. Alternatively, if the differential expression of other genes causes the highly capillarized phenotype of highlanders, the associated increase in cellular O2 tension could lessen the stimulus for VEGF expression.
Differences in the expression of other genes could also contribute to the observed differences in muscle phenotype between highland and lowland mice. Whole-transcriptome sequencing (RNA-Seq) of the gastrocnemius muscle has detected several genes that are differentially expressed between highland and lowland populations of deer mice (13). Many of these genes are associated with gene ontologies involved in energy metabolism (“oxidation-reduction process” and “cellular lipid metabolic process”), which should be, at least partly, a consequence (rather than a cause) of the differences in fiber-type composition of the gastrocnemius muscle between populations. Many of the genes that were differentially expressed between populations were also associated with the gene ontology “skeletal muscle fiber development” (e.g., ky, myoz2, and snf1lk) (13). This is consistent with results in mice that evolved a highly oxidative muscle phenotype in response to selective breeding for voluntary wheel running, in which many genes involved in muscle plasticity, development, or calcium signaling are differentially expressed (7).
Our results are consistent with growing evidence that suggests that high-altitude adaptation targets pathways involved in O2 and energy supply. Genes in hypoxia signaling pathways, which regulate vascular O2 supply and metabolic pathway flux, appear to have been frequent targets of high-altitude adaptation (26, 36, 59). Genes in oxidative pathways are often more highly expressed in the muscle of wild populations of multiple highland taxa of mammals and birds (11, 12, 14, 70). The genome of a bird species endemic to the Tibetan plateau (ground tit, Parus humilis) appears to have undergone a lineage-specific expansion in the size of gene families linked to aerobic energy metabolism (e.g., fatty-acid metabolism pathways) (51). Genetic changes in the coding region of genes involved in oxidative phosphorylation have also arisen in multiple highland taxa (16, 40, 58, 64). Therefore, increases in the capacity for vascular O2 supply and aerobic energy production appear to be of considerable advantage for coping with the hypoxia and/or cold temperatures at high altitudes.
DISCLOSURES
No conflicts of interest, financial or otherwise, are declared by the authors.
AUTHOR CONTRIBUTIONS
Author contributions: M.A.L., S.M., P.P., A.D.C., C.M.I., Z.A.C., J.F.S., G.B.M., and G.R.S. performed experiments; M.A.L., S.M., P.P., A.D.C., C.M.I., and G.R.S. analyzed data; M.A.L., S.M., P.P., A.D.C., C.M.I., Z.A.C., J.F.S., G.B.M., and G.R.S. edited and revised manuscript; M.A.L., S.M., P.P., A.D.C., C.M.I., Z.A.C., J.F.S., G.B.M., and G.R.S. approved final version of manuscript; G.R.S. conception and design of research; G.R.S. interpreted results of experiments; G.R.S. prepared figures; G.R.S. drafted manuscript.
ACKNOWLEDGMENTS
This research was principally supported by a Natural Sciences and Engineering Research Council of Canada (NSERC) Discovery Grant to G. R. Scott, with additional support from a NSERC Discovery Grant to G. B. McClelland, a National Institutes of Health grant to J. F. Storz (HL-087216), and a National Science Foundation grant to Z. A. Cheviron and J. F. Storz (IOS-1354934 and 1354390). The authors would like to thank Todd Elogio, Daphne Lau, Colin Nurse, and Angela Scott for technical assistance, as well as three anonymous referees for comments on a previous version of the manuscript.
REFERENCES
- 1.Amin RH, Mathews ST, Alli A, Leff T. Endogenously produced adiponectin protects cardiomyocytes from hypertrophy by a PPARγ-dependent autocrine mechanism. Am J Physiol Heart Circ Physiol 299: H690–H698, 2010. [DOI] [PMC free article] [PubMed] [Google Scholar]
- 2.Amin RH, Mathews ST, Camp HS, Ding L, Leff T. Selective activation of PPARγ in skeletal muscle induces endogenous production of adiponectin and protects mice from diet-induced insulin resistance. Am J Physiol Endocrinol Metab 298: E28–E37, 2010. [DOI] [PubMed] [Google Scholar]
- 3.Audet GN, Meek TH, Garland T Jr, Olfert IM. Expression of angiogenic regulators and skeletal muscle capillarity in selectively bred high aerobic capacity mice. Exp Physiol 96: 1138–1150, 2011. [DOI] [PubMed] [Google Scholar]
- 4.Bencowitz HZ, Wagner PD, West JB. Effect of change in P50 on exercise tolerance at high altitude: a theoretical study. J Appl Physiol 53: 1487–1495, 1982. [DOI] [PubMed] [Google Scholar]
- 5.Black CP, Tenney SM. Oxygen transport during progressive hypoxia in high altitude and sea level waterfowl. Respir Physiol 39: 217–239, 1980. [DOI] [PubMed] [Google Scholar]
- 6.Bouzat P, Walther G, Rupp T, Doucende G, Payen JF, Levy P, Verges S. Time course of asymptomatic interstitial pulmonary oedema at high altitude. Respir Physiol Neurobiol 186: 16–21, 2013. [DOI] [PubMed] [Google Scholar]
- 7.Burniston JG, Meek TH, Pandey SN, Broitman-Maduro G, Maduro MF, Bronikowski AM, Garland T, Chen YW. Gene expression profiling of gastrocnemius of “minimuscle” mice. Physiol Genomics 45: 228–236, 2013. [DOI] [PMC free article] [PubMed] [Google Scholar]
- 8.Cano I, Mickael M, Gomez-Cabrero D, Tegnér J, Roca J, Wagner PD. Importance of mitochondrial in maximal O2 transport and utilization: A theoretical analysis. Respir Physiol Neurobiol 189: 477–483, 2013. [DOI] [PMC free article] [PubMed] [Google Scholar]
- 9.Chappell MA, Hammond KA, Cardullo RA, Russell GA, Rezende EL, Miller C. Deer mouse aerobic performance across altitudes: effects of developmental history and temperature acclimation. Physiol Biochem Zool 80: 652–662, 2007. [DOI] [PubMed] [Google Scholar]
- 10.Chappell MA, Snyder LRG. Biochemical and physiological correlates of deer mouse α-chain hemoglobin polymorphisms. Proc Natl Acad Sci USA 81: 5484–5488, 1984. [DOI] [PMC free article] [PubMed] [Google Scholar]
- 11.Cheviron ZA, Bachman GC, Connaty AD, McClelland GB, Storz JF. Regulatory changes contribute to the adaptive enhancement of thermogenic capacity in high-altitude deer mice. Proc Natl Acad Sci USA 109: 8635–8640, 2012. [DOI] [PMC free article] [PubMed] [Google Scholar]
- 12.Cheviron ZA, Bachman GC, Storz JF. Contributions of phenotypic plasticity to differences in thermogenic performance between highland and lowland deer mice. J Exp Biol 216: 1160–1166, 2013. [DOI] [PMC free article] [PubMed] [Google Scholar]
- 13.Cheviron ZA, Connaty AD, McClelland GB, Storz JF. Functional genomics of adaptation to hypoxic cold-stress in high-altitude deer mice: transcriptomic plasticity and thermogenic performance. Evolution 68: 48–62, 2014. [DOI] [PMC free article] [PubMed] [Google Scholar]
- 14.Cheviron ZA, Whitehead A, Brumfield RT. Transcriptomic variation and plasticity in rufous-collared sparrows (Zonotrichia capensis) along an altitudinal gradient. Mol Ecol 17: 4556–4569, 2008. [DOI] [PubMed] [Google Scholar]
- 15.Delavar H, Nogueira L, Wagner PD, Hogan MC, Metzger D, Breen EC. Skeletal myofiber VEGF is essential for the exercise training response in adult mice. Am J Physiol Regul Integr Comp Physiol 306: R586–R595, 2014. [DOI] [PMC free article] [PubMed] [Google Scholar]
- 16.Di Rocco F, Parisi G, Zambelli A, Vida-Rioja L. Rapid evolution of cytochrome c oxidase subunit II in camelids (Tylopoda, Camelidae). J Bioenerg Biomembr 38: 293–297, 2006. [DOI] [PubMed] [Google Scholar]
- 17.Egginton S. Numerical and areal density estimates of fibre type composition in a skeletal muscle (rat extensor digitorum longus). J Anat 168: 73–80, 1990. [PMC free article] [PubMed] [Google Scholar]
- 18.Ge RL, Kubo K, Kobayashi T, Sekiguchi M, Honda T. Blunted hypoxic pulmonary vasoconstrictive response in the rodent Ochotona curzoniae (pika) at high altitude. Am J Physiol Heart Circ Physiol 274: H1792–H1799, 1998. [DOI] [PubMed] [Google Scholar]
- 19.Gealekman O, Guseva N, Gurav K, Gusev A, Hartigan C, Thompson M, Malkani S, Corvera S. Effect of rosiglitazone on capillary density and angiogenesis in adipose tissue of normoglycaemic humans in a randomised controlled trial. Diabetologia 55: 2794–2799, 2012. [DOI] [PMC free article] [PubMed] [Google Scholar]
- 20.Gnaiger E. Bioenergetics at low oxygen: dependence of respiration and phosphorylation on oxygen and adenosine diphosphate supply. Respir Physiol 128: 277–297, 2001. [DOI] [PubMed] [Google Scholar]
- 21.Gnaiger E, Lassnig B, Kuznetsov A, Rieger G, Margreiter R. Mitochondrial oxygen affinity, respiratory flux control and excess capacity of cytochrome c oxidase. J Exp Biol 201: 1129–1139, 1998. [DOI] [PubMed] [Google Scholar]
- 22.Gustafsson T. Vascular remodelling in human skeletal muscle. Biochem Soc Trans 39: 1628–1632, 2011. [DOI] [PubMed] [Google Scholar]
- 23.Hammond KA, Szewczak J, Krol E. Effects of altitude and temperature on organ phenotypic plasticity along an altitudinal gradient. J Exp Biol 204: 1991–2000, 2001. [DOI] [PubMed] [Google Scholar]
- 24.Hayes JP. Field and maximal metabolic rates of deer mice (Peromyscus maniculatus) at low and high altitudes. Physiol Zool 62: 732–744, 1989. [Google Scholar]
- 25.Hayes JP, O'Connor CS. Natural selection on thermogenic capacity of high-altitude deer mice. Evolution 53: 1280–1287, 1999. [DOI] [PubMed] [Google Scholar]
- 26.Hendrickson SL. A genome wide study of genetic adaptation to high altitude in feral Andean horses of the paramo. BMC Evol Biol 13: 273, 2013. [DOI] [PMC free article] [PubMed] [Google Scholar]
- 27.Hepple RT. Skeletal muscle: microcirculatory adaptation to metabolic demand. Med Sci Sports Exerc 32: 117–123, 2000. [DOI] [PubMed] [Google Scholar]
- 28.Hevener AL, He W, Barak Y, Le J, Bandyopadhyay G, Olson P, Wilkes J, Evans RM, Olefsky J. Muscle-specific Pparg deletion causes insulin resistance. Nat Med 9: 1491–1497, 2003. [DOI] [PubMed] [Google Scholar]
- 29.Hochachka PW. Exercise limitations at high altitude: the metabolic problem and search for its solution. In: Circulation, Respiration, and Metabolism, edited by Gilles R. Berlin: Springer-Verlag, 1985, p. 240–249. [Google Scholar]
- 30.Hock RJ. Physiological responses of deer mice to various native altitudes. In: The Physiological Effects of High Altitude, edited by Weihe WH. New York: Macmillan, 1964, p. 59–72. [Google Scholar]
- 31.Hsia CC, Carbayo JJ, Yan X, Bellotto DJ. Enhanced alveolar growth and remodeling in Guinea pigs raised at high altitude. Respir Physiol Neurobiol 147: 105–115, 2005. [DOI] [PubMed] [Google Scholar]
- 32.Koressaar T, Remm M. Enhancements and modifications of primer design program Primer3. Bioinformatics 23: 1289–1291, 2007. [DOI] [PubMed] [Google Scholar]
- 33.León-Velarde F, Sanchez J, Bigard AX, Brunet A, Lesty C, Monge C. High altitude tissue adaptation in Andean coots: capillarity, fiber area, fiber type and enzymatic activities of skeletal muscle. J Comp Physiol B 163: 52–58, 1993. [DOI] [PubMed] [Google Scholar]
- 34.Levett DZ, Radford EJ, Menassa DA, Graber EF, Morash AJ, Hoppeler H, Clarke K, Martin DS, Ferguson-Smith AC, Montgomery HE, Grocott MPW, Murray AJ, and Group tCXER. Acclimatization of skeletal muscle mitochondria to high-altitude hypoxia during an ascent of Everest. FASEB J 26: 1431–1441, 2012. [DOI] [PubMed] [Google Scholar]
- 35.Li H, Guo S, Ren Y, Wang D, Yu H, Li W, Zhao X, Chang Z. VEGF189 expression is highly related to adaptation of the plateau pika (Ochotona curzoniae) inhabiting high altitudes. High Alt Med Biol 14: 395–404, 2013. [DOI] [PMC free article] [PubMed] [Google Scholar]
- 36.Li Y, Wu DD, Boyko AR, Wang GD, Wu SF, Irwin DM, Zhang YP. Population variation revealed high-altitude adaptation of Tibetan mastiffs. Mol Biol Evol 31: 1200–1205, 2014. [DOI] [PubMed] [Google Scholar]
- 37.Lighton JRB. Measuring Metabolic Rates: a Manual for Scientists. New York: Oxford University Press, 2008. [Google Scholar]
- 38.Lin J, Wu H, Tarr PT, Zhang CY, Wu Z, Boss O, Michael LF, Puigserver P, Isotani E, Olson EN, Lowell BB, Bassel-Duby R, Spiegelman BM. Transcriptional co-activator PGC-1α drives the formation of slow-twitch muscle fibres. Nature 418: 797–801, 2002. [DOI] [PubMed] [Google Scholar]
- 39.Llanos AJ, Ebensperger G, Herrera EA, Reyes RV, Pulgar VM, Seron-Ferre M, Diaz M, Parer JT, Giussani DA, Moraga FA, Riquelme RA. Fetal and postnatal pulmonary circulation in the Alto Andino. Placenta 32: S100–S103, 2011. [DOI] [PubMed] [Google Scholar]
- 40.Luo YJ, Gao WX, Gao YQ, Tang S, Huang QY, Tan XL, Chen J, Huang TS. Mitochondrial genome analysis of Ochotona curzoniae and implication of cytochrome c oxidase in hypoxic adaptation. Mitochondrion 8: 352–357, 2008. [DOI] [PubMed] [Google Scholar]
- 41.Maggiorini M, Melot C, Pierre S, Pfeiffer F, Greve I, Sartori C, Lepori M, Hauser M, Scherrer U, Naeije R. High-altitude pulmonary edema is initially caused by an increase in capillary pressure. Circulation 103: 2078–2083, 2001. [DOI] [PubMed] [Google Scholar]
- 42.Mairbaurl H. Red blood cell function in hypoxia at altitude and exercise. Int J Sports Med 15: 51–63, 1994. [DOI] [PubMed] [Google Scholar]
- 43.Mathieu-Costello O. Muscle adaptation to altitude: tissue capillarity and capacity for aerobic metabolism. High Alt Med Biol 2: 413–425, 2001. [DOI] [PubMed] [Google Scholar]
- 44.Mathieu-Costello O, Agey PJ, Wu L, Szewczak JM, MacMillen RE. Increased fiber capillarization in flight muscle of finch at altitude. Respir Physiol 111: 189–199, 1998. [DOI] [PubMed] [Google Scholar]
- 45.McClelland GB, Hochachka PW, Weber JM. Carbohydrate utilization during exercise after high-altitude acclimation: a new perspective. Proc Natl Acad Sci USA 95: 10,288–10,293, 1998. [DOI] [PMC free article] [PubMed] [Google Scholar]
- 46.Mineo PM, Cassell EA, Roberts ME, Schaeffer PJ. Chronic cold acclimation increases thermogenic capacity, non-shivering thermogenesis and muscle citrate synthase activity in both wild-type and brown adipose tissue deficient mice. Comp Biochem Physiol A 161: 395–400, 2012. [DOI] [PMC free article] [PubMed] [Google Scholar]
- 47.Monge C, León-Velarde F. Physiological adaptation to high altitude: oxygen transport in mammals and birds. Physiol Rev 71: 1135–1172, 1991. [DOI] [PubMed] [Google Scholar]
- 48.Natarajan C, Inoguchi N, Weber RE, Fago A, Moriyama H, Storz JF. Epistasis among adaptive mutations in deer mouse hemoglobin. Science 340: 1324–1327, 2013. [DOI] [PMC free article] [PubMed] [Google Scholar]
- 49.Olfert IM, Breen EC, Mathieu-Costello O, Wagner PD. Chronic hypoxia attenuates resting and exercise-induced VEGF, flt-1, and flk-1 mRNA levels in skeletal muscle. J Appl Physiol 90: 1532–1538, 2001. [DOI] [PubMed] [Google Scholar]
- 50.Qiao L, Kinney B, Yoo HS, Lee B, Schaack J, Shao J. Adiponectin increases skeletal muscle mitochondrial biogenesis by suppressing mitogen-activated protein kinase phosphatase-1. Diabetes 61: 1463–1470, 2012. [DOI] [PMC free article] [PubMed] [Google Scholar]
- 51.Qu Y, Zhao H, Han N, Zhou G, Song G, Gao B, Tian S, Zhang J, Zhang R, Meng X, Zhang Y, Zhang Y, Zhu X, Wang W, Lambert D, Ericson PGP, Subramanian S, Yeung C, Zhu H, Jiang Z, Li R, Lei F. Ground tit genome reveals avian adaptation to living at high altitudes in the Tibetan plateau. Nat Commun 4: 2071, 2013. [DOI] [PubMed] [Google Scholar]
- 52.Russell GA, Rezende EL, Hammond KA. Development partly determines the aerobic performance of adult deer mice, Peromyscus maniculatus. J Exp Biol 211: 35–41, 2008. [DOI] [PubMed] [Google Scholar]
- 53.Schippers MP, Ramirez O, Arana M, Pinedo-Bernal P, McClelland GB. Increase in carbohydrate utilization in high-altitude Andean mice. Curr Biol 22: 2350–2354, 2012. [DOI] [PubMed] [Google Scholar]
- 54.Scott GR. Elevated performance: the unique physiology of birds that fly at high altitudes. J Exp Biol 214: 2455–2462, 2011. [DOI] [PubMed] [Google Scholar]
- 55.Scott GR, Egginton S, Richards JG, Milsom WK. Evolution of muscle phenotype for extreme high altitude flight in the bar-headed goose. Proc R Soc Lond B Biol Sci 276: 3645–3653, 2009. [DOI] [PMC free article] [PubMed] [Google Scholar]
- 56.Scott GR, Milsom WK. Flying high: a theoretical analysis of the factors limiting exercise performance in birds at altitude. Respir Physiol Neurobiol 154: 284–301, 2006. [DOI] [PubMed] [Google Scholar]
- 57.Scott GR, Richards JG, Milsom WK. Control of respiration in flight muscle from the high-altitude bar-headed goose and low-altitude birds. Am J Physiol Regul Integr Comp Physiol 297: R1066–R1074, 2009. [DOI] [PubMed] [Google Scholar]
- 58.Scott GR, Schulte PM, Egginton S, Scott ALM, Richards JG, Milsom WK. Molecular evolution of cytochrome c oxidase underlies high-altitude adaptation in the bar-headed goose. Mol Biol Evol 28: 351–363, 2011. [DOI] [PubMed] [Google Scholar]
- 59.Simonson TS, Yang Y, Huff CD, Yun H, Qin G, Witherspoon DJ, Bai Z, Lorenzo FR, Xing J, Jorde LB, Prchal JT, Ge R. Genetic evidence for high-altitude adaptation in Tibet. Science 329: 72–75, 2010. [DOI] [PubMed] [Google Scholar]
- 60.Storz JF, Natarajan C, Cheviron ZA, Hoffmann FG, Kelly JK. Altitudinal variation at duplicated β-globin genes in deer mice: effects of selection, recombination, and gene conversion. Genetics 190: 203–216, 2012. [DOI] [PMC free article] [PubMed] [Google Scholar]
- 61.Storz JF, Runck AM, Moriyama H, Weber RE, Fago A. Genetic differences in hemoglobin function between highland and lowland deer mice. J Exp Biol 213: 2565–2574, 2010. [DOI] [PMC free article] [PubMed] [Google Scholar]
- 62.Storz JF, Runck AM, Sabatino SJ, Kelly JK, Ferrand N, Moriyama H, Weber RE, Fago A. Evolutionary and functional insights into the mechanism underlying high-altitude adaptation of deer mouse hemoglobin. Proc Natl Acad Sci USA 106: 14450–14455, 2009. [DOI] [PMC free article] [PubMed] [Google Scholar]
- 63.Storz JF, Scott GR, Cheviron ZA. Phenotypic plasticity and genetic adaptation to high-altitude hypoxia in vertebrates. J Exp Biol 213: 4125–4136, 2010. [DOI] [PMC free article] [PubMed] [Google Scholar]
- 64.Sun J, Zhong H, Chen SY, Yao YG, Liu YP. Association between MT-CO3 haplotypes and high-altitude adaptation in Tibetan chicken. Gene 529: 131–137, 2013. [DOI] [PubMed] [Google Scholar]
- 65.Tang K, Breen EC, Gerber HP, Ferrara NM, Wagner PD. Capillary regression in vascular endothelial growth factor-deficient skeletal muscle. Physiol Genomics 18: 63–69, 2004. [DOI] [PubMed] [Google Scholar]
- 66.Turek Z, Kreuzer F, Ringnalda BE. Blood gases at several levels of oxygenation in rats with a left-shifted blood oxygen dissociation curve. Pflügers Arch 376: 7–13, 1978. [DOI] [PubMed] [Google Scholar]
- 67.Turek Z, Kreuzer F, Turek-Maischeider M, Ringnalda BE. Blood O2 content, cardiac output, and flow to organs at several levels of oxygenation in rats with a left-shifted blood oxygen dissociation curve. Pflügers Arch 376: 201–207, 1978. [DOI] [PubMed] [Google Scholar]
- 68.Untergrasser A, Cutcutache I, Koressaar T, Ye J, Faircloth BC, Remm M, Rozen SG. Primer3—new capabilities and interfaces. Nucleic Acids Res 40: e115, 2012. [DOI] [PMC free article] [PubMed] [Google Scholar]
- 69.Wagner PD. Determinants of maximal oxygen transport and utilization. Annu Rev Physiol 58: 21–50, 1996. [DOI] [PubMed] [Google Scholar]
- 70.Wang HB, Zan LS, Zhang YY. Profiling of the yak skeletal muscle tissue gene expression and comparison with the domestic cattle by genome array. Animal 8: 28–35, 2014. [DOI] [PubMed] [Google Scholar]
- 71.Weibel ER. Stereological Methods. Toronto: Academic, 1979. [Google Scholar]
- 72.West JB. High-altitude medicine. Am J Respir Crit Care Med 186: 1229–1237, 2012. [DOI] [PubMed] [Google Scholar]
- 73.West JB. Human limits for hypoxia: the physiological challenge of climbing Mt. Everest. Ann NY Acad Sci 899: 15–27, 2000. [DOI] [PubMed] [Google Scholar]
- 74.Xing J, Wuren T, Simonson TS, Watkins WS, Witherspoon DJ, Wu W, Qin G, Huff CD, Jorde LB, Ge RL. Genomic analysis of natural selection and phenotypic variation in high-altitude mongolians. PLoS Genet 9: e1003634, 2013. [DOI] [PMC free article] [PubMed] [Google Scholar]