Abstract
Most P2-type layered oxides exhibit Na+/vacancy-ordered superstructures because of strong Na+–Na+ interaction in the alkali metal layer and charge ordering in the transition metal layer. These superstructures evidenced by voltage plateaus in the electrochemical curves limit the Na+ ion transport kinetics and cycle performance in rechargeable batteries. Here we show that such Na+/vacancy ordering can be avoided by choosing the transition metal ions with similar ionic radii and different redox potentials, for example, Cr3+ and Ti4+. The designed P2-Na0.6[Cr0.6Ti0.4]O2 is completely Na+/vacancy-disordered at any sodium content and displays excellent rate capability and long cycle life. A symmetric sodium-ion battery using the same P2-Na0.6[Cr0.6Ti0.4]O2 electrode delivers 75% of the initial capacity at 12C rate. Our contribution demonstrates that the approach of preventing Na+/vacancy ordering by breaking charge ordering in the transition metal layer opens a simple way to design disordered electrode materials with high power density and long cycle life.
 Sodium-containing layered oxides are promising battery cathodes, but their performance suffers from the formation of sodium ion-vacancy ordered superstructures. Here, the authors present a P2-Na0.6[Cr0.6Ti0.4]O2 layered oxide with disordered cations, leading to high battery performance.
Layered oxides have attracted great attention because of their unique low-dimensional structure and physical/chemical properties. In particular, they are a class of important cathode materials for rechargeable batteries. Among them, LiCoO2 is still the most successful high-energy-positive electrode material for lithium-ion batteries1. In sodium-ion batteries showing worldwide interest for large-scale energy storage recently2,3,4,5,6,7, NaxCoO2 is known as the first layered oxide investigated as a Na intercalation host8. In this compound, depending on sodium content and temperature an interplay between Na+–Na+ and Na+–Co3+/4+ electrostatic interactions coupled with Co3+/4+ charge ordering results in the formation of numerous Na+/vacancy-ordered superstructures. Such ordered superstructures have distinct voltage plateaus in electrochemical curves9, lower Na+ ion diffusion coefficient (by up to two orders of magnitude10) and even reduced dimensionality of ionic transport11. The combination of these phenomena in turn results in rapid capacity-fading during cycling. Such a common behaviour was also observed in other layered oxides with brucite-type octahedral (MO6) layers, for example, NaxMnO2 (ref. 12, 13, 14, 15), NaxVO2 (ref. 16), Na2/3Ni1/3Mn2/3O2 (ref. 17), Na2/3Co2/3Mn1/3O2 (ref. 18), and so on. The goal of this work was to understand the conditions leading to Na+/vacancy ordering and potentially find a way to prevent it. We focused on P2-type layered oxides, which are known to be especially favourable for high Na+ ion diffusion in trigonal prismatic interlayer space.
In general, there are three types of ordering in P2-Nax[M1,M2]O2-layered oxides: transition metal ordering, charge ordering and Na+/vacancy ordering, which affect each other (Table 1). In the case of transition metal ordering, we found that as expected it is mainly controlled by the difference in the ionic radii of M1 and M2, as illustrated by a large number of P2-layered oxides6,8,9,12,13,14,15,16,17,18,19,20,21,22,23,24,25,26,27,28,29,30,31,32,33,34,35. Large difference in ionic radii is favourable for forming ordered arrangement while small difference tends to form disordered arrangement. In line with the general trend well established in crystal chemistry, we found the critical difference ionic radii to be ∼15%. If the radii difference is higher than 15% and M1/M2 content is close to a rational ratio, then an ordered structure is expected; otherwise M1 and M2 are disordered. Occurrence of charge ordering is determined by the redox potentials (that is, Fermi level) of M1 and M2. Small difference is favourable for charge ordering even if M1 and M2 are chemically disordered, for example, Nax[MnyCo1-y]O2 (y<0.5; Table 1), whereas large difference tends to form charge disordering. Finally, Na+/vacancy ordering and charge ordering are coupled to each other. There is no charge ordering without Na+/vacancy ordering and vice versa.
Table 1. Possible ordered combinations in P2-type layered oxides.
| M1/M2 | Charge | Na+/vacancy | Example | Ratio of M1/M2 ionic radii |
|---|---|---|---|---|
| Disordered | Disordered | Disordered | Na2/3[Fe1/2Mn1/2]O2 (ref. 31) | 1 |
| Ordered | Disordered | Disordered | Na2[Ni2Te]O6 (ref. 20) | 1.23 |
| Disordered | Ordered | Disordered | X | |
| Ordered | Ordered | Disordered | X | |
| Disordered | Disordered | Ordered | X | |
| Disordered | Ordered | Ordered | Nax[MnyCo1−y]O2 (refs 18, 21, 34; y<0.5) | 1.15 |
| Ordered | Disordered | Ordered | X | |
| Ordered | Ordered | Ordered | Na2/3[Ni1/3Mn2/3]O2 (ref. 17) | 1.30 |
More materials are listed in Supplementary Table 1. (Note that ‘X' in Example column refers to ‘no example'.)
Here we intentionally chose the transition metal ions with very similar ionic radii and substantially different redox potential versus Na, such as Cr3+ and Ti4+ in expectation to build the P2-layered oxide free of Na+/vacancy ordering. Disordered arrangement of Cr3+ and Ti4+ in the transition metal layers prevents M3+/4+ charge ordering such as observed in NaxCoO2 (ref. 9) and NaxVO2 (ref. 16) that in turn prevents Na+/vacancy ordering. Using neutron powder diffraction (NPD) we show that P2-Na0.6[Cr0.6Ti0.4]O2 synthesized through a simple solid-state reaction is Na+/vacancy-disordered at any sodium content in the studied range of x=0.33–1.0 in Nax[Cr0.6Ti0.4]O2 and temperature from 3 to 1,073 K that leads to its very high ionic conductivity and ability to withstand high charge/discharge rates.
Results
Crystal structure of P2-Na0.6[Cr0.6Ti0.4]O2
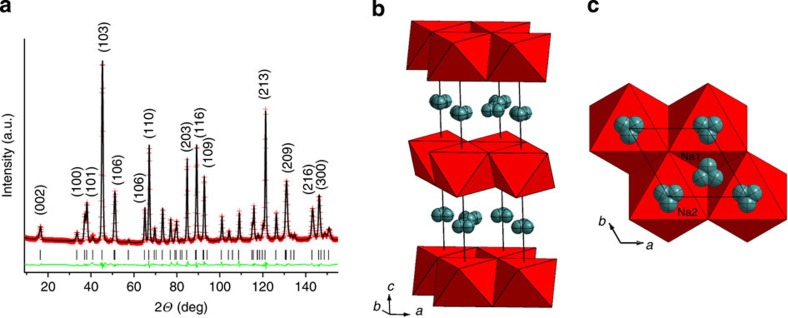
This oxide was synthesized by a simple solid-state reaction using precursors of Na2CO3, Cr2O3 and TiO2. The inductively coupled plasma (ICP) result confirms the composition of Na0.605[Cr0.6Ti0.4]O2. The morphology of the sample was investigated with scanning electron microscopy (SEM). As shown in the inset of Supplementary Fig. 1, the distribution of particle size of the as-prepared sample is in the range of 1–4 μm. Sample phase purity was verified using powder X-ray diffraction. All the diffraction peaks were found in good agreement with the JCPDS No. 52-537 (ref. 36) that indicated a pure P2 phase material. The crystal structure of the material was further studied in detail using NPD. Crystal structure of the P2-type is built of brucite-type edge-sharing octahedral layers containing transition metals with trigonal prismatic interlayer space containing sodium37. There are two inequivalent trigonal prismatic positions available for Na atoms: sharing faces and edges with transition metal octahedra, designated in the following text Na1 and Na2, respectively. For the title composition Na0.6[Cr0.6Ti0.4]O2, two questions of crucial importance were whether Cr and Ti are ordered in the octahedral layers and whether Na atoms are ordered over Na1 and Na2 prisms. Both aspects were studied in detail using NPD, which was clearly a technique of choice in this case. First, in contrast to X-ray diffraction, NPD is extremely sensitive to Cr and Ti distribution because of an opposite sign of the neutron-scattering lengths (3.635 and −3.370 fm, respectively). Second, again in contrast to X-ray diffraction, in the case of random distribution of Cr and Ti the contribution of transition metals to the total diffraction pattern is rather small (bcoh(Cr0.6Ti0.4)=0.833 fm) that makes NPD more sensitive to the contribution from the sodium sublattice (bcoh(Na0.6)=2.18 fm).
At room temperature the high-quality NPD data unambiguously revealed absence of supercell diffraction peaks and therefore a high symmetry model (space group P63/mmc no. 194) with a unit cell (a∼3 Å, c∼11 Å) and random distribution of Cr/Ti and Na over a single octahedral site and two trigonal prismatic sites, respectively, was successfully used to analyse the data (also see Supplementary Fig. 2). The absence of Cr/Ti ordering is not surprising as their ionic radii are extremely close (0.615 and 0.605 Å, respectively)38. Furthermore, in the beginning, we used a model with Na atoms placed in the centres of prisms, that is, 2c and 2b Wyckoff sites, respectively. However, Difference Fourier map revealed clearly off-centre nuclear density, which could not be adequately modelled by anisotropic thermal parameters because of the point symmetry of the sites. Therefore, both Na1 and Na2 positions were split into 6-h (x, 2x, 1/4) sites that significantly improved refinement quality. The Rp and Rwp reduced from 2.30% and 2.99% to 2.08% and 2.73%, respectively, with only two additional variables, which is certainly statistically significant39. Such sodium site splitting was previously proposed in several structural studies of various P2-type materials40,41,42. The Rietveld plot and crystallographic parameters are presented in Fig. 1 and Supplementary Tables 2 and 3, respectively. We believe that similar off-centre Na location may exist in all the other P2-Nax[M1,M2]O2 compositions with M1=V–Ni and M2=Ti, Li, Mg, and so on because of the asymmetric local coordination of Na by M1 and M2. Uncompensated electrostatic repulsion displaces Na+ from prism centres.
Figure 1. Structure of P2-Na0.6[Cr0.6Ti0.4]O2.
(a) The Rietveld plot for P2-Na0.6[Cr0.6Ti0.4]O2 refined against NPD data collected at 300 K. The red crosses and black and green solid lines indicate the observed and calculated patterns and their difference, respectively. The tick marks indicate the position of the diffraction peaks. Rp=2.08%, Rwp=2.73%. (b,c) General view of the crystal structure and view along the c axis showing splitting of Na1 and Na2 sites from the centres of prisms.
Sodium storage performance
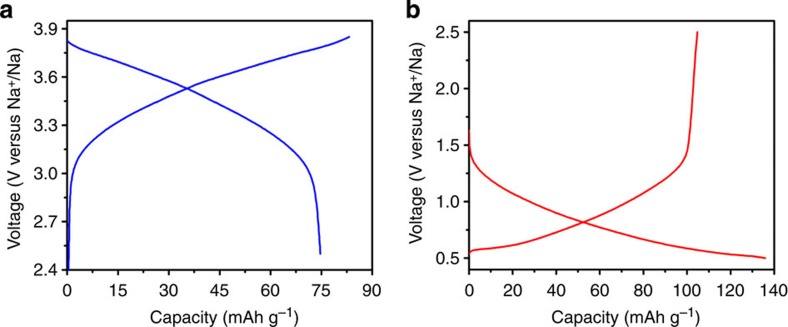
The sodium storage performance of P2-Na0.6[Cr0.6Ti0.4]O2 in sodium half cells using 0.8 M NaPF6 in ethylene carbonate (EC)/diethyl carbonate (DEC) as the electrolyte is shown in Figs 2 and 3. Since the valence state of Cr in this compound is 3+, it can be oxidized to 4+ on Na deintercalation, enabling it as a possible positive electrode. Meanwhile, the valence state of Ti in this compound is 4+; it can be reduced to 3+ on Na intercalation, making it a possible negative electrode. Figure 2 shows the typical first charge and discharge curves of Na0.6[Cr0.6Ti0.4]O2 electrodes in the voltage ranges of 2.5–3.85 and 0.5–2.5 V, respectively. It can be seen that all the charge and discharge curves show smooth slopes without plateaus, indicating the sodium deintercalation and intercalation through a single-phase reaction. This is further supported by the in situ XRD results as discussed later. This behaviour is very different from some other P2-type electrodes such as NaxCoO2, NaxVO2, where multiple plateaus were observed during sodium deintercalation/intercalation, which is related to the formation of Na+/vacancy and charge-ordered superstructures9,16. In the case of Na0.6[Cr0.6Ti0.4]O2, the disordered distribution of Cr and Ti in the transition metal layer as discussed above is responsible for such sodium storage mechanism.
Figure 2. Typical first charge/discharge profiles of P2-Na0.6[Cr0.6Ti0.4]O2 electrodes in the NaPF6-based electrolyte.
(a) P2-Na0.6[Cr0.6Ti0.4]O2 tested as positive electrode in the voltage range of 2.5–3.85 V and (b) P2-Na0.6[Cr0.6Ti0.4]O2 tested as negative electrode in the voltage range of 0.5–2.5 V.
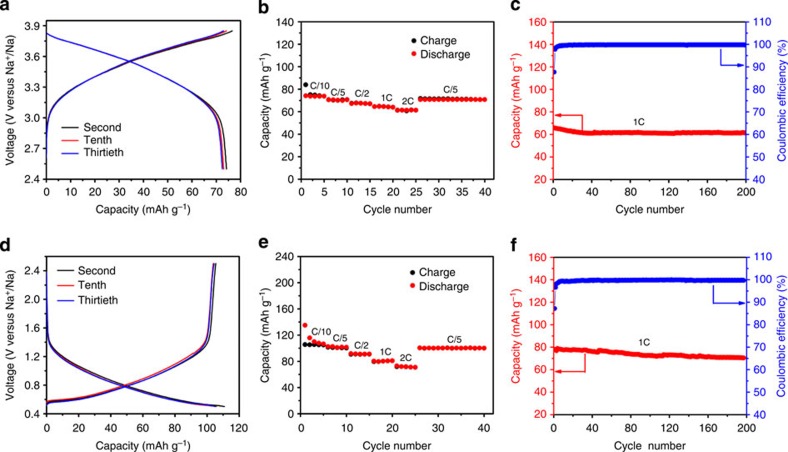
Figure 3. Sodium storage performance of P2-Na0.6[Cr0.6Ti0.4]O2 electrodes in the NaPF6-based electrolyte.
(a) The second, tenth and thirtieth charge/discharge profiles at a current rate of C/10 (7.6 mA g−1) in the voltage range of 2.5–3.85 V versus Na+/Na. (b) Rate capability. The capacity versus cycle number at various current rates. (c) Long-term cycling performance. The capacity and Coulombic efficiency versus cycle number at a current rate of 1C. (d) The second, tenth and thirtieth charge/discharge profiles at a current rate of C/10 (11.2 mA g−1) in the voltage range of 0.5–2.5 V versus Na+/Na. (e) Rate capability. The capacity versus cycle number at various current rates. (f) Long-term cycling performance. The capacity and Coulombic efficiency versus cycle number at a current rate of 1C.
Interestingly, the average Na storage voltage for the positive electrode is ca. 3.5 V, which is much higher than that of O3-type NaCrO2 (ca. 3 V) with the same Cr3+/Cr4+ redox couple43. This is likely related to the different sodium contents in Na0.6[Cr0.6Ti0.4]O2 and NaCrO2 samples. The reversible discharge capacity is ∼74 mAh g−1, corresponding to 0.26 Na deintercalation/intercalation per formula unit. The rate capability of the Na0.6[Cr0.6Ti0.4]O2 electrode was also tested in a sodium-ion battery. It can be seen from Fig. 3b that the reversible capacities are 74, 70, 67, 64 and 61 mAh g−1 at constant current rates of C/10, C/5, C/2, 1C and 2C, respectively. The capacity retention at 1C is 82% of the initial capacity. The long-term cyclic stability of this material is also excellent at current rates of 0.1C and 1C as shown in Fig. 3a,c. The Na0.6[Cr0.6Ti0.4]O2 electrode exhibits over 200 cycles with capacity retention of 94% at a current rate of 1C. The Coulombic efficiency after initial cycles reaches nearly 99.4%.
For the negative electrode side, the average sodium storage voltage is ca. 0.8 V, which is similar to P2-Na0.66[Li0.22Ti0.78]O2 (ref. 22). In the Na0.6[Cr0.6Ti0.4]O2, the available vacancy in the alkali layer will allow 0.4 Na intercalation into the host, corresponding to a capacity of 112 mAh g−1, which is in good agreement with the observed reversible charge capacity of 105 mAh g−1. The Coulombic efficiency of the first cycle is ∼80% in the NaPF6-based electrolyte. This low Coulombic efficiency is because of the reduction of the used electrolyte to form the solid electrolyte interphase (SEI) layer on the surface of the electrode. It is noted that when a NaClO4-based electrolyte was used, an even much lower Coulombic efficiency of 54% was observed as shown in Supplementary Fig. 3, indicating a serious decomposition of the electrolyte. It was found that the thickness of the formed amorphous SEI layer on the electrode from the NaPF6-based electrolyte is much thinner than that from the NaClO4-based electrolyte (Supplementary Fig. 4), which coincides with the observation of irreversible capacity loss in different electrolytes. Nevertheless, a similar Na storage performance in terms of rate capability and long cycle stability was also achieved in the NaClO4-based electrolyte (Supplementary Fig. 3). In terms of rate performance, it displays slightly lower rate capability compared with that of the positive electrode as shown in Fig. 3e and Supplementary Fig. 5. This is likely related to smaller number of available vacancies for the Na content (x=0.6–1) in the Nax[Cr0.6Ti0.4]O2 negative electrode, resulting in slower Na+ ion diffusion because of the strong repulsive electrostatic interactions among Na+ ions. Again, it can be seen from Fig. 3d,f that the material presents very stable cycling performance at low and high current rates. After 200 cycles at 1C rate, the capacity retention is 90.4% (also see Supplementary Fig. 6). The superior Na storage performance from both positive and negative electrodes originates from the peculiar cation-disordered feature in Na0.6[Cr0.6Ti0.4]O2. This performance is much better than that of other P2-type oxides with ordered structure6,9,13,15,16,17,18,20,24.
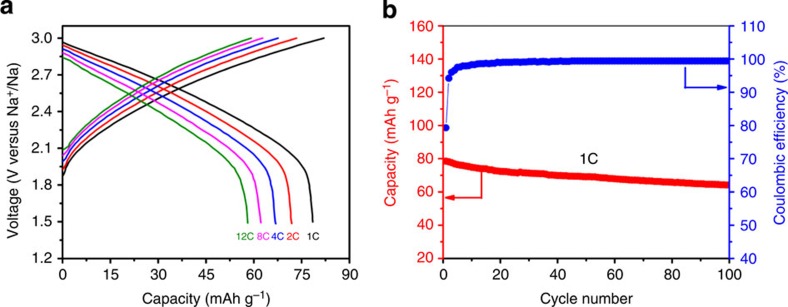
On the basis of above results, a sodium-ion full cell was also demonstrated using P2-Na0.6[Cr0.6Ti0.4]O2 as both negative and positive electrodes. The greatest advantage of using the same materials as both negative and positive electrodes is to significantly decrease the material's processing cost. Preliminary results show that the full cell delivers an average operating voltage plateau at ∼2.53 V and extraordinary rate (Fig. 4a) and superior cycling performance (Fig. 4b and Supplementary Fig. 7). Even at a very high rate of 12C, the capacity retention is 75% of that at 1C rate. The energy densities of this system are calculated to be 82 and 94 Wh kg−1 at current rates of 1C and C/5 based on the mass of positive and negative electrodes. This battery system shows the best performance among symmetric rechargeable batteries reported so far. Although the energy density of this system is not high compared with other reported systems, we can expect that the cost should be much lower than other systems because the abundant elements are used and the same material is used as both positive and negative electrodes. This system may have promising applications in the fields where power capability, cycle life and cost are more critical than energy density, such as large-scale electrical energy storage.
Figure 4. Full-cell performance of P2-Na0.6[Cr0.6Ti0.4]O2 as both positive and negative electrodes in the NaPF6-based electrolyte.
(a) Discharge profiles of Na0.6[Cr0.6Ti0.4]O2/Na0.6[Cr0.6Ti0.4]O2 sodium-ion full cell at various rates. (b) The capacity and Coulombic efficiency versus cycle number of the full cell at 1C rate. The capacity was calculated based on the mass of negative electrode.
Discussion
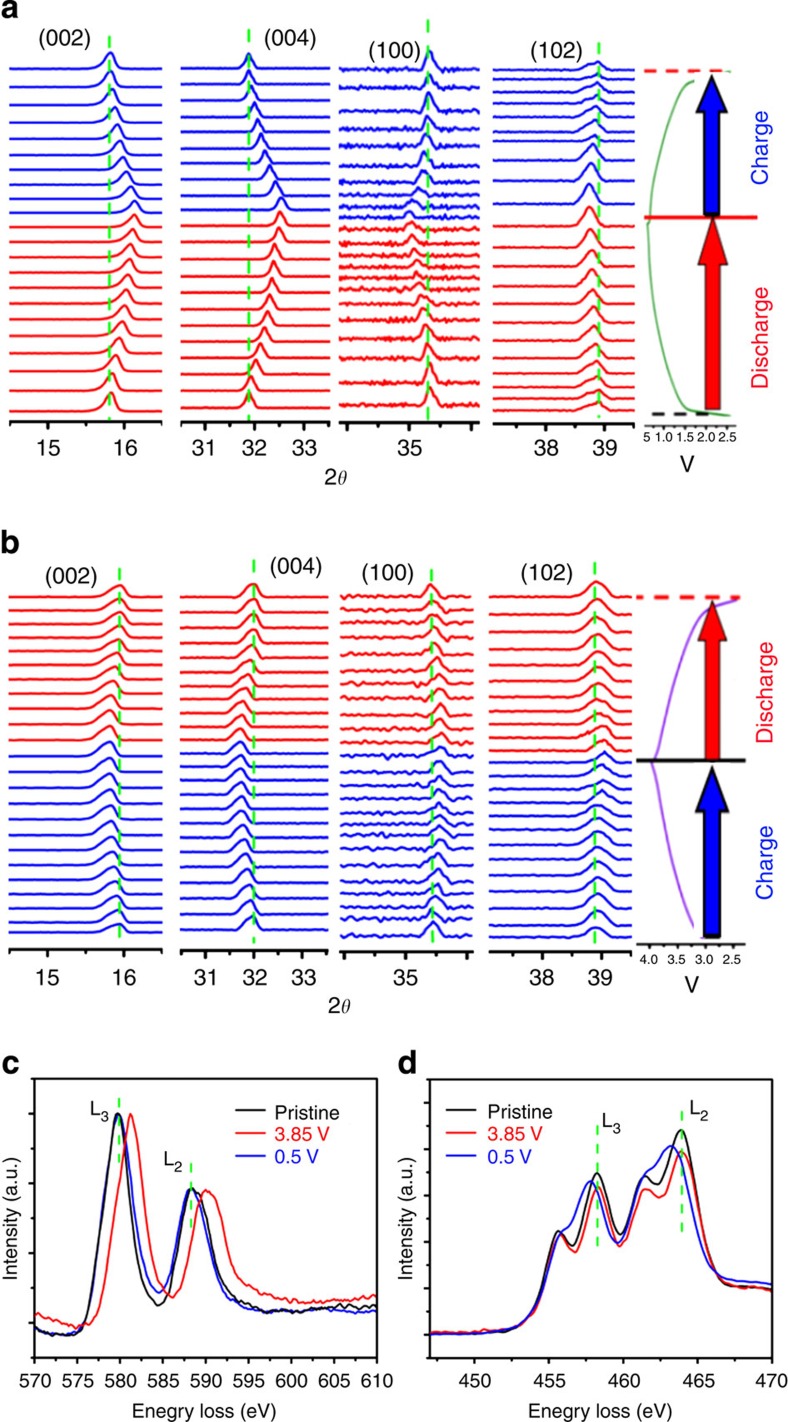
To elucidate the structure evolution during sodium deintercalation and intercalation, we carried out the electrochemical in situ XRD experiment and the results are displayed in Fig. 5. In Fig. 5a, on Na deintercalation, the (002) and (004) peaks continuously shift to lower two theta angles; while (100) and (102) peaks slightly shift to higher angles, no new peaks beyond P2 structure are observed, indicating a single phase reaction in agreement with the absence of voltage plateaus discussed above. The peak shift indicates that the ab plane contracts and the c axis expands as expected because of smaller ionic radius of Cr4+ and decreasing amount of Na+ ions holding transition metal layers together, respectively. The same behaviour is well known for all other materials with brucite-type layers of P2, O3 and P3 structures. In addition, these peak shifts are also highly reversible when Na is inserted back to the structure. A very similar behaviour but with the opposite trend is observed when the Na0.6[Cr0.6Ti0.4]O2 electrode was first discharged and then charged as shown in Fig. 5b. For both positive and negative electrodes, the Na storage mechanism is through a single phase reaction, that is, a wide solid-solution exists in Nax[Cr0.6Ti0.4]O2 in the studied range 0.33≤x≤1. In order to investigate the charge compensation mechanism, electron energy-loss spectrum (EELS) and X-ray absorption spectroscopy (XAS) were performed. Figure 5c,d displays the corresponding EELS profiles of Cr-L2,3 and Ti-L2,3 edges for the pristine Na0.6[Cr0.6Ti0.4]O2 sample and the Na0.6[Cr0.6Ti0.4]O2 electrodes charged to 3.85 V and discharged to 0.5 V, respectively. In the case of positive electrode, the Cr-L2,3 edge shifts to a higher energy while Ti-L2,3 edge keeps unchanged on charged to 3.85 V. The shift of Cr-L2,3 could be assigned to the formation of Cr4+, which is further supported by the XAS results as shown in Supplementary Fig. 8 (refs 44, 45). For the negative electrode, only the Ti-L2,3 edge changes significantly, corresponding to the Ti4+/Ti3+ reduction during Na insertion46. These results indicate that Cr3+/Cr4+ is responsible for the charge compensation on Na extraction, whereas Ti4+/Ti3+ is involved in the charge compensation during Na insertion, which is in excellent agreement with our initial design.
Figure 5. Crystal and electronic structure evolution during electrochemical desodiation and sodiation.
In situ XRD patterns collected during the first charge/discharge of the Na/Na0.6[Cr0.6Ti0.4]O2 cells under a current rate of C/5 at voltage ranges of 0.5–2.5 V (a) and 2.5–3.85 V (b). EELS for Cr-L2,3 (c) and Ti-L2,3 (d) edges for the pristine Na0.6[Cr0.6Ti0.4]O2 sample and the Na0.6[Cr0.6Ti0.4]O2 electrodes charged to 3.85 V and discharged to 0.5 V, respectively.
To confirm that the disordered Cr/Ti distribution in the transition metal layer prevents Na+ ordering at any temperature and sodium content such as known to occur in NaxCoO2 (refs 9, 11), we used chemical method to prepare three different compositions, Na0.33[Cr0.6Ti0.4]O2, Na0.5[Cr0.6Ti0.4]O2 and Na1[Cr0.6Ti0.4]O2, and collected high-quality NPD data for those samples at room temperature (Supplementary Fig. 9) and the Na0.6[Cr0.6Ti0.4]O2 sample in the wide range of temperature from 3 to 1,073 K. Since, as discussed above, in Na0.6[Cr0.6Ti0.4]O2 sodium positions were found to be displaced at room temperature from the centres of trigonal prisms and were expected to be even more disordered at lower Na content and high temperature, the further analysis of the NPD data was performed using not only the Rietveld method but also the Maximum Entropy Method.
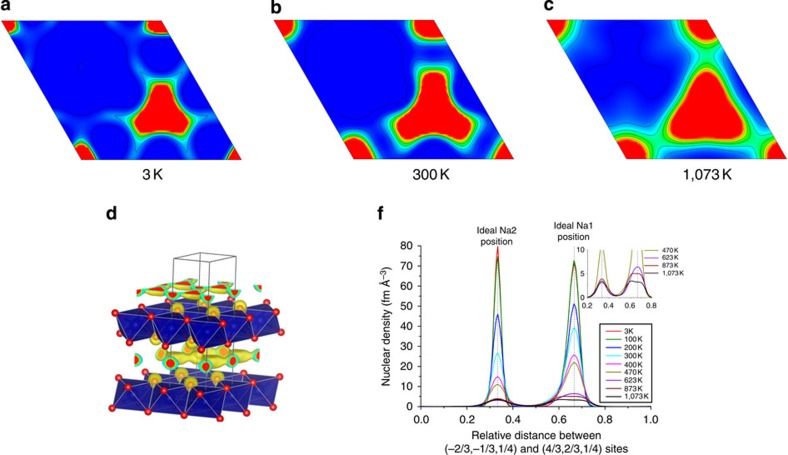
The analysis of the NPD data collected for Na0.6[Cr0.6Ti0.4]O2 on cooling down to 3 K showed no evidence of Cr/Ti and Na+/vacancy ordering such as that found in Na0.7CoO2 (ref. 11). Instead, the sodium nuclear density was found to gradually delocalize with the increase in temperature (Fig. 6). At high temperature, sodium is disordered into an almost liquid-like state (Fig. 6c) as expected for a material with high ionic conductivity (∼0.6 S cm−1 at 1,073 K)32. At low temperature the sodium nuclear density becomes more localized, but even at 3 K sodium atoms are still randomly distributed over the Na1 and Na2 sites, and centroids of nuclear density distribution are not in the prism centres (Fig. 6f, inset). On heating from 3 to 1,073 K Na0.6[Cr0.6Ti0.4]O2 demonstrates normal Debye-type thermal expansion without anomalies (Supplementary Fig. 10). As expected, the c axis expands significantly faster than the ab plane as illustrated by linear thermal expansion coefficients estimated in the high temperature range, 22.5 × 10⁻⁶ and 11.5 × 10⁻⁶ K−1, respectively. Also as expected, the c axis expands mostly because of the expansion of sodium-containing interlayer space rather than that of transition metal layers (Supplementary Fig. 10, inset), that in turn further promotes Na+ ion mobility.
Figure 6. Nuclear density distribution of sodium calculated by the MEM using neutron powder diffraction data.
(Top) Section of nuclear density at z=0.25 for Na0.6[Cr0.6Ti0.4]O2 at 3 K (a), 300 K (b) and 1,073 K (c); (bottom, d) general view of the crystal structure with nuclear density at 1,073 K; (bottom, f) nuclear density distribution along the line connecting ideal Na1 and Na2 sites as a function of temperature. Inset shows the data at high temperature in greater detail.
The NPD data analysis results for Nax[Cr0.6Ti0.4]O2 as a function of x were found to be consistent with the in situ XRD data. The lower the content of sodium is, the shorter a,b axes and longer c axis are, because of reduction in the average octahedral cation radius and decreasing number of sodium cations holding octahedral layers together, respectively (Fig. 7a). An important consequence of such a combination of the unit cell contraction and expansion is that the unit cell volume changes with x very slightly, within 0.5% (Fig. 7a, inset). Furthermore, compared with the parent material Na0.6[Cr0.6Ti0.4]O2, sodium-rich and sodium-poor compositions have slightly smaller and larger cell volume, respectively. This means that changes in the total volume of a symmetric battery using Na0.6[Cr0.6Ti0.4]O2 as both negative electrode and positive electrode will be negligible. This is very different from the commercialized LiCoO2/graphite battery system where both electrodes expand on charging.
Figure 7. Structure parameters of Nax[Cr0.6Ti0.4]O2.
(a) Cell parameters of Nax[Cr0.6Ti0.4]O2 as a function of Na content at 300 K; inset shows relative change of cell parameters and cell volume with respect to those for the parent Na0.6[Cr0.6Ti0.4]O2 material; (b) Na+ ion distribution over Na1 and Na2 sites as a function of x; (c) Na1 and Na2 displacement from the centres of prisms as a function of x.
A close of examination of sodium distribution over the Na1 and Na2 sites revealed expected behaviour. When sodium content decreases the growing interlayer distance and number of sodium vacancies further increase Na+ ion mobility and overall Na+ disorder, which results in the tendency of Na1 and Na2 sites to both equalize occupancies (Fig. 7b) and further delocalize sodium nuclear density (Fig. 7c). This is consistent with the rate performance. Therefore, lowering of x in Nax[Cr0.6Ti0.4]O2 has an effect similar to increasing temperature (Fig. 6a–f).
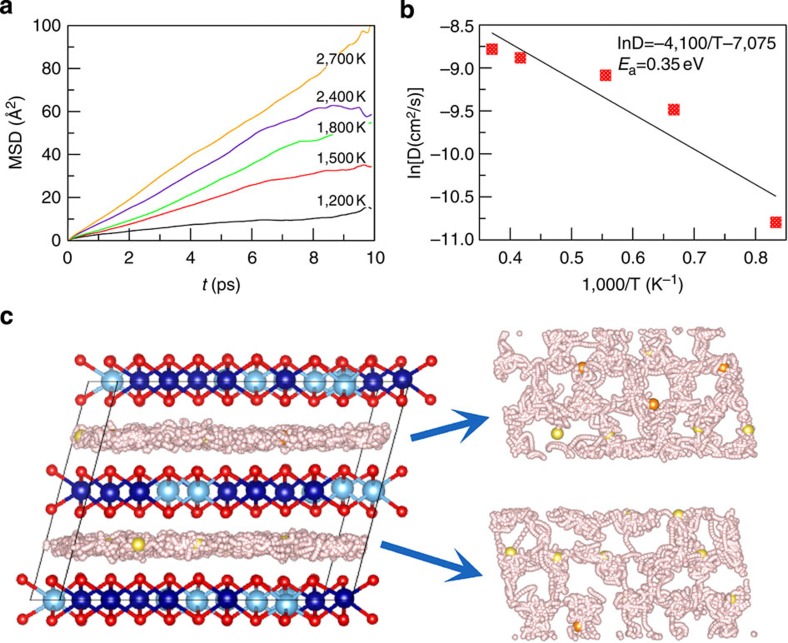
To obtain a microscopic picture of the Na+ ion transport we also performed first-principles molecular dynamics (FPMD) simulations as implemented in the VASP (Viena ab initio simulation package) code47. A special quasi-random structure (SQS) was constructed to simulate the disordered configuration of Na+/vacancy and Cr/Ti using a 108-atom supercell through the ATAT code48. This structure is built from the hexagonal cell with the transformation matrix [−3,−2,0;1,−1,1;0,5,0]. Figure 8 shows the results of FPMD simulations for the P2-Na0.6[Cr0.6Ti0.4]O2 system. The mean square displacements (MSDs) of Na+ ion for P2-Na0.6[Cr0.6Ti0.4]O2 at various temperatures are displayed in Fig. 8a. The obvious Na+ ion migration can be observed for all these temperatures. As the temperature increases, the Na+ ions diffuse more and more easily. To obtain the diffusion coefficient (D), the slope of each curve is fitted in the range from 2 to 8 ps. Figure 8b shows the Arrhenius plot for this material. The diffusion energy barrier (Ea) is extracted from the slope of the Arrhenius plot. The calculated activation energy barrier for P2-Na0.6[Cr0.6Ti0.4]O2 is (0.35±0.07) eV, which is comparable to the experimental measurements, 0.24 eV, indicating the effectiveness of our simulations. The detailed diffusion process of Na+ ions is shown in Fig. 8c, where the trajectories of the Na+ ions are given to illustrate the migration pathways. The positions of Cr, Ti and O atoms are fixed at their initial ones for clarity, since no breaking of Cr–O and Ti–O bonds is found in all the simulations. It is clear to see that the Na+ ions migrate within two-dimensional channels, since no diffusion between the Na+ layer and the transition metal layer can be found. The top view of trajectories in each Na+ layer reveals similar pictures with the section of nuclear density given in Fig. 7. Both of them indicate the pathways along ideal Na1–Na2–Na1 sites.
Figure 8. Na+ ion transport properties of P2-Na0.6[Cr0.6Ti0.4]O2 obtained by FPMD simulations.
(a) MSD at 1,200, 1,500, 1,800, 2,400 and 2,700 K. (b) Arrhenius plot of diffusion coefficients, from which the Na+ ion migration energy barrier of 0.35 eV is obtained. (c) Trajectories (small grey bullets) of Na+ ion in FPMD simulations at 1,800 K from 5 to 8 ps in P2-Na0.6[Cr0.6Ti0.4]O2, the top view of each Na+ layer is given in the right panel. The initial positions of Na1 (yellow), Na2 (orange), Cr (blue), Ti (light blue) and O (red) are shown for clarity.
In summary, through selecting transition metals of Cr3+ and Ti4+ with very similar ionic radii and a substantial difference in redox potential, we designed a P2-Na0.6[Cr0.6Ti0.4]O2-layered oxide simultaneously Cr/Ti and Na+/vacancy-disordered in the complete studied wide range of sodium content and temperature. It was demonstrated that this cation-disordered material can function as both positive and negative electrodes with average operation voltages of 3.5 and 0.8 V, corresponding to the redox couples of Cr3+/Cr4+ and Ti3+/Ti4+, respectively. A symmetric sodium-ion battery using the same P2-Na0.6[Cr0.6Ti0.4]O2 electrode material demonstrates charge/discharge curves free of voltage plateaus, outstanding rate performance and long cycle life. Our study highlights the importance of designing a disordered transition metal/charge arrangement in the layered oxides as a promising strategy to improve their Na-storage performance in terms of rate capability and long cycle stability for the development of high-power and long-life room-temperature sodium-ion batteries.
Methods
Synthesis
The resulting material was prepared by a solid-state reaction using precursors of Na2CO3 (99%), Cr2O3 (99%) and TiO2 (99.5%, anatase form). A phase-pure compound was obtained when an excess of 2 mol% Na2CO3 was used. The starting materials were ground in an agate mortar and pressed into pellets under pressure of 20 MPa. Then, the pellets were heated at 1,000 °C for 15 h under Ar atmosphere in an alumina crucible.
Characterizations
The morphologies of the materials were investigated using a scanning electron microscope (Hitachi S-4800). Powder X-ray diffraction was performed using a Bruker D8 Advance diffractometer equipped with a Cu Kα radiation source (λ1=1.54060 Å, λ2=1.54439 Å) and a LynxEye_XE detector. The XRD pattern was refined using the TOPAS software based on the Rietveld method. In the in situ XRD studies, the working electrode was prepared using PVDF as binder on an Al foil. A specially designed Swagelok cell equipped with an X-ray-transparent beryllium window was used for the in situ measurements. The in situ XRD patterns were collected with an interval of 30 min for each 2θ scan from 10° to 80° on charge and discharge at a current rate of C/10, between 0.5∼2.5 and 2.5–3.85 V versus Na+/Na. An aluminium foil was placed between the cathode electrode and the beryllium window, to prevent beryllium oxidation at high operating voltages.
The Na0.6[Cr0.6Ti0.4]O2 powder was chemically sodiated49 by chemical reduction with sodium-biphenyl-1,2-dimethoxyethane (DME) solution as sodiation reagent. In a typical process, 0.0956, g pure sodium was dissolved into 10 ml colourless 1 M biphenyl-DME solution, forming a dark-green organic solution as the sodiating reagent. Then, 1 g Na0.6[Cr0.6Ti0.4]O2 powder was immersed into this solution (corresponding to 0.4 mol Na per 1 mol Na0.6[Cr0.6Ti0.4]O2). The slurry was stirred until the colour of the solution-fade completely to obtain the sodiated products. The products were washed by DME several times, and dried in the vacuum for overnight. Chemically sodium deintercalation of the sample was accomplished by reaction with a strong oxidant of nitronium tetrafluoroborate (NO2BF4, Aldrich, 98%)50. Solid NO2BF4 was dissolved in acetonitrile and Na0.6[Cr0.6Ti0.4]O2 (molar ratio, NO2BF4: Na0.6[Cr0.6Ti0.4]O2=0.1:1 or 0.27:1) was added to the resulting solution. The slurry was stirred overnight at room temperature, filtered under vacuum and then finally washed several times with acetonitrile.
NPD data were collected using the high-resolution powder diffractometer Echidna at the OPAL research reactor (ANSTO, Lucas Heights) using wavelengths of 1.6215 Å. The NPD data analysis with Rietveld and Maximum Entropy Methods were performed using General structure analysis system51 and Dysnomia/RIETAN-FP codes52,53. The crystal structures and nuclear density are visualized with the VESTA 3 program60.
EELS spectra were collected with a Gatan GIF spectrometer attached to a JEOL 2010F field emission microscope operating at 200 KeV. The transmission electron microscope was operating at a diffraction mode with a camera length of 8 mm. The spectrometer was set at 0.2 eV per channel with a collection aperture of 1 mm.The EELS spectrum background was subtracted by power law fitting. The electronic states of the Cr during the charge and discharge processes were probed using X-ray absorption near-edge structure spectroscopy techniques at Cr K-edges. The ex situ XAS data at the Cr K-edge were recorded at room temperature in the transmission mode at beam line BL14W1 of the Shanghai Synchrotron Radiation Facility (SSRF), China. The station was operated with a Si (111) double crystal monochromator. The photon energy was calibrated with the first inflection point of Cr K-edge in the relevant metal foil. Analysis of the XAS spectra was carried out by using programme code of IFEFFIT54.
Electrochemistry
The working electrode was prepared by spreading the slurry of the active materials (75 wt.%), acetylene black (20 wt.%) and the polyvinylidene fluoride PVDF (5 wt.%) binder on the Al foil. The working electrodes were dried at 100 °C under vacuum for 10 h. The electrolytes are 1 M NaClO4 or 0.8 M NaPF6 in EC/DEC (4:6 in volume). The coin-type (CR2032) cells were assembled with pure sodium foil as the counter electrode, and a glass fibre as the separator in an argon-filled glove box. The charge and discharge measurements were carried out on a Land BT2000 battery test system (Wuhan, China) in voltage ranges of 0.5–2.5 and 2.5–3.85 V under room temperature. A sodium-ion full cell was constructed using P2- Na0.6[Cr0.6Ti0.4]O2 as both the negative and positive electrodes in a 2032 coin-type cell. The weight ratio of the two electrodes (negative/positive) was 1:1.3–1.4 (ref. 55). The full cells were charged and discharged between the voltage range of 1.5–3.0 V at various C-rates (C/10 current rate corresponds to 10.6 mA g−1).
Density functional theory calculations
To simulate the disordered configurations of Na+/vacancy and Cr/Ti, the SQS is constructed using a 108-atom supercell through the ATAT code56. This structure is built from the hexagonal cell with the transformation matrix [–3,–2,0;1,–1,1;0,5,0]. The FPMD method is adopted to investigate the Na+ ion transport properties in P2-Na0.6[Cr0.6Ti0.4]O2. The simulations are performed using the density functional theory as implemented in the VASP code47,56. The present data are obtained using the generalized gradient approximation with a parameterized exchange-correlation functional according to Perdew–Burke–Ernzerhof57. The Na(2p,3s), Cr(3p,3d,4s), Ti(3p,3d,4s) and O(2s,2p) orbital are treated as valence states. The energy cutoffs for plane wave basis set and augmentation charges are 500 and 756 eV, respectively. The SQS structure is first optimized to obtain the equilibrium lattice parameters and ionic positions on a 3 × 3 × 2 k-mesh. The energy and force convergence criterion for the relaxation are 10−5 eV and 0.01 eV Å−1, respectively. Then, the FPMD simulations are carried out for 10 ps at each temperature by a Nose thermostat58,59, and a time step of 1 fs is used to integrate the equation of motion. To keep the computational cost at a reasonable level, only the Γ point is used for the Brillouin zone sampling in FPMD calculations. The MSD can be used to characterize the diffusion behaviour of the system,
 |
where ri(t) is the position of the i-th Na+ ion at the time t, and the average is over the time steps and all the Na+ ions. According to the Einstein equation, the slope of the MSD presents the diffusion coefficient D,
 |
The activation energy barrier for Na+-ion diffusion can be extracted from the diffusion coefficients at various temperatures according to Arrhenius equation.
Author contributions
Y.-S.H. and M.A. designed this work; Y.W. carried out the synthesis and electrochemical experiments; Y.W. performed in situ XRD measurements; Y.W. performed ex situ XAS measurements, transmission electron microscope and EELS; M.A. collected the NPD data and refined the NPD results; R.X. performed the first principles calculations, Y.-S.H., R.X. and M.A. wrote the paper; all the authors participated in analysis of the experimental data and discussions of the results as well as preparing the paper.
Additional information
How to cite this article: Wang, Y. et al. P2-Na0.6[Cr0.6Ti0.4]O2 cation-disordered electrode for high-rate symmetric rechargeable sodium-ion batteries. Nat. Commun. 6:6954 doi: 10.1038/ncomms7954 (2015).
Supplementary Material
Supplementary Figures 1-10 and Supplementary Tables 1-3
Acknowledgments
This work was supported by funding from the NSFC (51222210, 11234013), ‘973' Projects (2012CB932900) and One Hundred Talent Project of the Chinese Academy of Sciences. M.A. would like to thank Professor V.B. Nalbandyan for guidance and Dr A.I. Beskrovny for help in collecting preliminary unpublished NPD data at the IBR-2 reactor (JINR, Dubna). We acknowledge the support by the staff scientists of Dr Jingyuan Ma and Dr Wen Wen at beamline BL14W of the SSRF, China. We thank the BASF company for providing the electrolyte solvents used in this work.
References
- Mizushima K., Jones P. C., Wiseman P. J. & Goodenough J. B. LixCoO2 (0<x<1): a new cathode material for batteries of high energy density. Mater. Res. Bull. 15, 783–789 (1980). [Google Scholar]
- Palomares V., Casas-Cabanas M., Castillo-Martinez E., Han M. H. & Rojo T. Update on Na-based battery materials. A growing research path. Energy Environ. Sci. 6, 2312–2337 (2013). [Google Scholar]
- Pan H. L., Hu Y. S. & Chen L. Q. Room-temperature stationary sodium-ion batteries for large-scale electric energy storage. Energy Environ. Sci. 6, 2338–2360 (2013). [Google Scholar]
- Slater M. D., Kim D., Lee E. & Johnson C. S. Sodium-ion batteries. Adv. Funct. Mater. 23, 947–958 (2013). [Google Scholar]
- Kim S. W., Seo D. H., Ma X. H., Ceder G. & Kang K. Electrode materials for rechargeable sodium-ion batteries: potential alternatives to current lithium-ion batteries. Adv. Energy Mater. 2, 710–721 (2012). [Google Scholar]
- Kubota K., Yabuuchi N., Yoshida H., Dahbi M. & Komaba S. Layered oxides as positive electrode materials for Na-ion batteries. MRS Bull. 39, 416–422 (2014). [Google Scholar]
- Yabuuchi N., Kubota K., Dahbi M. & Komaba S. Research development on sodium-ion batteries. Chem. Rev. 114, 11636–11682 (2014). [DOI] [PubMed] [Google Scholar]
- Delmas C., Braconnier J.-J., Fouassier C. & Hagenmuller P. Electrochemical intercalation of sodium in NaxCoO2 bronzes. Solid State Ionics 3-4, 165–169 (1981). [Google Scholar]
- Berthelot R., Carlier D. & Delmas C. Electrochemical investigation of the P2-NaxCoO2 phase diagram. Nat. Mater. 10, 74–80 (2011). [DOI] [PubMed] [Google Scholar]
- Shu G. & Chou F. Sodium-ion diffusion and ordering in single-crystal P2-NaxCoO2. Phys. Rev. B 78, 052101 (2008). [Google Scholar]
- Medarde M. et al. 1D to 2D Na+ ion diffusion inherently linked to structural transitions in Na0.7CoO2. Phys. Rev. Lett. 110, 266401 (2013). [DOI] [PubMed] [Google Scholar]
- Mendiboure A., Delmas C. & Hagenmuller P. Electrochemical intercalation and deintercalation of NaxMnO2 bronzes. J. Solid State Chem. 57, 323–331 (1985). [Google Scholar]
- Caballero A. et al. Synthesis and characterization of high-temperature hexagonal P2-Na0.6MnO2 and its electrochemical behaviour as cathode in sodium cells. J. Mater. Chem. 12, 1142–1147 (2002). [Google Scholar]
- Li X. et al. Direct visualization of the Jahn-Teller effect coupled to Na ordering in Na5/8MnO2. Nat. Mater. 13, 586–592 (2014). [DOI] [PubMed] [Google Scholar]
- Su D., Wang C., Ahn H. J. & Wang G. Single crystalline Na0.7MnO2 nanoplates as cathode materials for sodium ion batteries with enhanced performance. Chem. Eur. J 19, 10884–10889 (2013). [DOI] [PubMed] [Google Scholar]
- Guignard M. et al. P2-NaxVO2 system as electrodes for batteries and electron-correlated materials. Nat. Mater. 12, 74–80 (2013). [DOI] [PubMed] [Google Scholar]
- Lu Z. & Dahn J. R. In situ X-ray diffraction study of P2-Na2/3[Ni1/3Mn2/3]O2. J. Electrochem. Soc. 148, A1225–A1229 (2001). [Google Scholar]
- Carlier D. et al. The P2-Na2/3Co2/3Mn1/3O2 phase: structure, physical properties and electrochemical behavior as positive electrode in sodium battery. Dalton Trans. 40, 9306–9312 (2011). [DOI] [PubMed] [Google Scholar]
- de Boisse B. M., Carlier D., Guignard M. & Delmas C. Structural and electrochemical characterizations of P2 and New O3-NaxMn1-yFeyO2 phases prepared by auto-combustion synthesis for Na-ion batteries. J. Electrochem. Soc. 160, A569–A574 (2013). [Google Scholar]
- Gupta A., Buddie Mullins C. & Goodenough J. B. Na2Ni2TeO6: evaluation as a cathode for sodium battery. J. Power Sources 243, 817–821 (2013). [Google Scholar]
- Wang X., Tamaru M., Okubo M. & Yamada A. Electrode properties of P2-Na2/3MnyCo1–yO2 as cathode materials for sodium-ion batteries. J. Phys. Chem. C 117, 15545–15551 (2013). [Google Scholar]
- Wang Y. S. et al. A zero-strain layered metal oxide as the negative electrode for long-life sodium ion batteries. Nat. Commun. 4, 3365 (2013). [DOI] [PubMed] [Google Scholar]
- Yuan D. D. et al. Synthesis and electrochemical behaviors of layered Na0.67Mn0.65Co0.2Ni0.15O2 microflakes as a stable cathode material for sodium-ion batteries. J. Mater. Chem. A 1, 3895–3899 (2013). [Google Scholar]
- Yoshida J. et al. New P2—Na0.70Mn0.60Ni0.30Co0.10O2 layered oxide as electrode material for Na-ion batteries. J. Electrochem. Soc. 161, A1987–A1991 (2014). [Google Scholar]
- Yoshida H. et al. P2-type Na2/3Ni1/3Mn2/3-xTixO2 as a new positive electrode for higher energy Na-ion batteries. Chem. Commun. 50, 3677–3680 (2014). [DOI] [PubMed] [Google Scholar]
- Kim D. et al. Enabling sodium batteries using lithium-substituted sodium layered transition metal oxide cathodes. Adv. Energy Mater. 1, 333–336 (2011). [Google Scholar]
- Yabuuchi N. et al. A new electrode material for rechargeable sodium batteries: P2-type Na2/3[Mg0.28Mn0.72]O2with anomalously high reversible capacity. J. Mater. Chem. A 2, 16851–16855 (2014). [Google Scholar]
- Shanmugam R. & Lai W. Na2/3Ni1/3Ti2/3O2: ‘bi-functional' electrode materials for Na-ion batteries. ECS Electrochem. Lett. 3, A23–A25 (2014). [Google Scholar]
- Yu H. et al. An ultrastable anode for long-life room-temperature sodium-ion batteries. Angew. Chem. Int. Ed. 126, 9109–9115 (2014). [DOI] [PubMed] [Google Scholar]
- Zhao J. et al. Electrochemical and thermal properties of P2-type Na2/3Fe1/3Mn2/3O2 for Na-ion batteries. J. Power Sources 264, 235–239 (2014). [Google Scholar]
- Yoncheva M. et al. Structure and reversible lithium intercalation in a new P'3-phase: Na2/3Mn1-yFeyO2 (y=0, 1/3, 2/3). J. Mater. Chem. 22, 23418–23427 (2012). [Google Scholar]
- Yuan D. et al. P2-type Na0.67Mn0.65Fe0.2Ni0.15O2 cathode material with high-capacity for sodium-ion battery. Electrochim. Acta 116, 300–305 (2014). [Google Scholar]
- Guignard M. et al. Vanadium clustering/declustering in P2-Na1/2VO2 layered oxide. Chem. Mater. 26, 1538–1548 (2014). [Google Scholar]
- Beck F. R. et al. Neutron diffraction and electrochemical studies of Na0.79CoO2 and Na0.79Co0.7Mn0.3O2 cathodes for sodium-ion batteries. J. Electrochem. Soc. 161, A961–A967 (2014). [Google Scholar]
- Lee D. H., Xu J. & Meng Y. S. An advanced cathode for Na-ion batteries with high rate and excellent structural stability. Phys. Chem. Chem. Phys. 15, 3304–3312 (2013). [DOI] [PubMed] [Google Scholar]
- Avdeev M. Y., Nalbandyan V. B. & Medvedev B. S. Hexagonal sodium titanate chromite: A new high-conductivity solid electrolyte. Inorg. Mater. 33, 500–503 (1997). [Google Scholar]
- Delmas C., Fouassier C. & Hagenmuller P. Structural classification and properties of the layered oxides. Phys. B & C 99, 81–85 (1980). [Google Scholar]
- Shannon R. Revised effective ionic radii and systematic studies of interatomic distances in halides and chalcogenides. Acta Crystallogr. A 32, 751–767 (1976). [Google Scholar]
- Hamilton W. Significance tests on the crystallographic R factor. Acta Crystallogr. 18, 502–510 (1965). [Google Scholar]
- Jorgensen J. D., Avdeev M., Hinks D. G., Burley J. C. & Short S. Crystal structure of the sodium cobaltate deuterate superconductor NaxCoO2·4xD2O x≈1/3. Phys. Rev. B 68, 214517 (2003). [Google Scholar]
- Viciu L., Huang Q. & Cava R. J. Stoichiometric oxygen content in NaxCoO2. Phys. Rev. B 73, 212107 (2006). [Google Scholar]
- Yabuuchi N. et al. New O2/P2-type Li-excess layered manganese oxides as promising multi-functional electrode materials for rechargeable Li/Na batteries. Adv. Energy Mater. 4, 201301453 (2014). [Google Scholar]
- Komaba S., Takei C., Nakayama T., Ogata A. & Yabuuchi N. Electrochemical intercalation activity of layered NaCrO2 vs. LiCrO2. Electrochem. Commun. 12, 355–358 (2010). [Google Scholar]
- Kubota K. et al. New insight into structural evolution in layered NaCrO2 during electrochemical sodium extraction. J. Phys. Chem. C 119, 166–175 (2014). [Google Scholar]
- Zhou Y.-N. et al. Phase transition behavior of NaCrO2 during sodium extraction studied by synchrotron-based X-ray diffraction and absorption spectroscopy. J. Mater. Chem. A 1, 11130–11134 (2013). [Google Scholar]
- Ohtomo A., Muller D. A., Grazul J. L. & Hwang H. Y. Artificial charge-modulation in atomic-scale perovskite titanate superlattices. Nature 419, 378–380 (2002). [DOI] [PubMed] [Google Scholar]
- Kresse G. & Joubert D. From ultrasoft pseudopotentials to the projector augmented-wave method. Phys. Rev. B 59, 1758–1775 (1999). [Google Scholar]
- van de Walle A., Asta M. & Ceder G. The Alloy Theoretic Automated Toolkit: A user guide. Calphad 26, 539–553 (2002). [Google Scholar]
- Sun Y. et al. Direct atomic-scale confirmation of three-phase storage mechanism in Li4Ti5O12 anodes for room-temperature sodium-ion batteries. Nat. Commun. 4, 2878 (2013). [DOI] [PubMed] [Google Scholar]
- Jian Z. L. et al. Superior electrochemical performance and storage mechanism of Na3V2(PO4)3 cathode for room-temperature sodium-ion batteries. Adv. Energy Mater. 3, 156–160 (2013). [Google Scholar]
- Larson A. C. & Von Dreele R. B. General structure analysis system (GSAS). Los Alamos National Laboratory Report LAUR 86, 748 (2004). [Google Scholar]
- Izumi F. & Momma K. Three-dimensional visualization in powder diffraction. Solid State Phenom. 130, 15–20 (2007). [Google Scholar]
- Momma K., Ikeda T., Belik A. A. & Izumi F. Dysnomia, a computer program for maximum-entropy method (MEM) analysis and its performance in the MEM-based pattern fitting. Powder Diffr. 28, 184–193 (2013). [Google Scholar]
- Newville M. IFEFFIT: interactive XAFS analysis and FEFF fitting. J. Synchrotron Radiat. 8, 322–324 (2001). [DOI] [PubMed] [Google Scholar]
- Hassoun J. et al. An advanced lithium-ion battery based on a graphene anode and a lithium iron phosphate cathode. Nano Lett. 14, 4901–4906 (2014). [DOI] [PubMed] [Google Scholar]
- van de Walle A. et al. Efficient stochastic generation of special quasirandom structures. Calphad 42, 13–18 (2013). [Google Scholar]
- Kresse G. & Furthmuller J. Efficient iterative schemes for ab initio total-energy calculations using a plane-wave basis set. Phys. Rev. B 54, 11169–11186 (1996). [DOI] [PubMed] [Google Scholar]
- Perdew J. P., Burke K. & Ernzerhof M. Generalized gradient approximation made simple (vol 77, pg 3865, 1996). Phys. Rev. Lett. 78, 1396–1396 (1997). [DOI] [PubMed] [Google Scholar]
- Nose S. A. A unified formulation of the constant temperature molecular-dynamics methodes. J. Chem. Phys. 81, 511–519 (1984). [Google Scholar]
- Momma K. & Izumi F. VESTA 3 for three-dimensional visualization of crystal, volumetric and morphology data. J. Appl. Cryst. 44, 1272–1276 (2011). [Google Scholar]
Associated Data
This section collects any data citations, data availability statements, or supplementary materials included in this article.
Supplementary Materials
Supplementary Figures 1-10 and Supplementary Tables 1-3


