

Abstract
Typical CD spectrum of the right-handed poly[d(A-T)2] was reversed when trans-bis(N-methylpyrimidium-4-yl)diphenyl porphyrin (trans-BMPyP) was bound, suggesting that the helicity of the polynucleotide was reversed to the left-handed form. The formation of the left-handed Z-form poly[d(A-T)2] was confirmed by 31P NMR, in which a single 31P peak of B-form poly[d(A-T)2] was split into two peaks, which is similar to the conventional B-Z transition of poly[d(G-C)2] induced by the high ionic strength. The observed B-Z transition is unique for poly[d(A-T)2]. The other polynucleotides, including poly[d(G-C)2], poly(dG)·poly(dC) and poly(dA)·poly(dT) remained as the right-handed form in the presence of the same porphyrin. This observation suggests that the porphyrin array that was formed along the poly[d(A-T)2] provides a template to which left-handed poly[d(A-T)2] is associated with an electrostatic interaction.
Z-form DNA has been the subject of extensive study since it was first detected by circular dichroism (hereafter referred to as CD) and absorption spectroscopy1, and its left-hand structure was resolved on the atomic level several years later2. Although the biological importance of the Z-form DNA has been underestimated because it is a high-energy conformation and requires relatively extreme conditions, such as a high ionic strength, negative super coiling3, dehydration4 and chemical modification,5 recent discoveries of Z-DNA specific proteins have highlighted its biological role in a range of in vivo processes6,7,8,9,10. The Z-conformation favors alternating purine-pyrimidine repeats, particularly alternated G-C base-pairs, even though the Z-form has been known for other mixed sequences8. On the other hand, it was recently reported that one of the Ru(II) complexes, namely [Ru(dip)2dppz]2+ (dip = 4,7-diphenyl-1,10-phenanthroline, dppz = dipyridophenazine) can efficiently induce the B to Z transition of range of DNA sequences including non-alternating purine-pyrimidine sequences and the sequences consisting of AT bases based on CD spectroscopy, NOESY and gel electrophoresis11. However, left-handed Z-form for AT sequence particularly poly[d(A-T)2] which possesses only alternating AT base pairs has not been known.
In addition to the direction of the helix, which results in the symmetrical appearance of a CD spectrum in the DNA absorption region12, one of the important differences in the Z-DNA from B-DNA in their conformation is the zigzag sugar phosphate backbone, producing a doublet in the 31P NMR spectrum13,14. Using these two criteria, this paper reports the formation of Z-form poly[d(A-T)2] induced by a cationic porphyrins, namely trans-bis(N-methylpyrimidium-4-yl)diphenyl porphyrin (trans-BMPyP, Fig. 1). This B-Z transition was found to be specific to the alternating AT polynucleotide. It is also shown that the poly[d(A-T)2] specific B-Z transition is closely related to the stacking of the cationic porphyrin along the polynucleotide stem.
Figure 1.
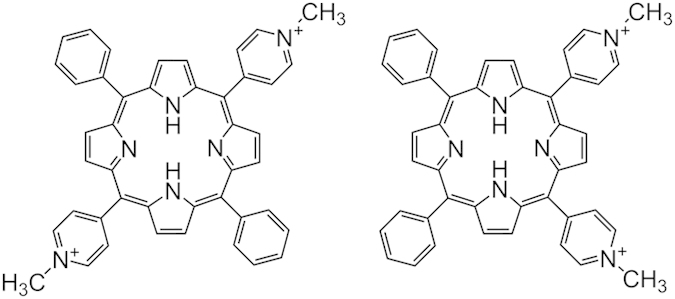
Chemical structure of trans- (left) and cis-bis(N-methylpyrimidium-4-yl)diphenyl porphyrin (right) (referred to as trans- and cis-BMPyP, respectively).
Results and Discussion
Selective formation of Z-form poly[d(A-T)2] by binding of trans-BMPyP
CD in the DNA absorption region is the most convenient method for detecting the Z-form of DNA. Fig. 2(a) shows the well-known CD spectrum of the B- and Z-form poly[d(G-C)2], in which the Z-form was induced by the addition of 4 M NaCl. Upon the binding of trans-BMPyP, the B-Z transition of poly[d(A-T)2] occurred quickly. In the absence of trans-BMPyP, poly[d(A-T)2] is the B-form with its positive CD band between 260 ~ 290 nm and negative band between 235 ~ 260 nm (Fig. 2(b)). As the trans-BMPyP concentration increased, the Z-form with its negative CD band between 270 ~ 300 nm (minimum at 279 nm) and positive band below 270 nm (maximum at 261 nm) was generated and the B-form disappeared. Although the positive and negative CD bands of poly[d(A-T)2] were observed at a shorter wavelength compared to 267 nm and 295 nm for conventional Z-poly[d(G-C)2], the overall inverse shape of the bisignate CD spectrum in the DNA absorption region indicated the formation of the Z-form for poly[d(A-T)2]. The contribution of the induced CD spectrum of poly[d(A-T)2]-bound trans-BMPyP might not be large because the absorbance of porphyrin in this region is quite small compared to that of poly[d(A-T)2]. Inversion in the CD spectrum by trans-BMPyP is specific to poly[d(A-T)2]. Judging from the shape of the CD spectrum, no other trans-BMPyP-polynucleotide complex forms the Z-form (Figure S1). In particular, alternating GC polynucleotide, poly[d(G-C)2], which is a representative polynucleotide to form the Z-form in the presence of a high salt concentration or in the presence of other stimuli, remained in the B-form in the presence of the same concentration of trans-BMPyP. Recently, the [Ru(dip)2dppz]2+ complex was reported to induce a B-Z transition for a range of DNA sequences including non-alternating purine-pyrimidine and AT-rich segments under low salt condition11, whereas the result shown in this study suggests that the formation of Z-DNA is specific to alternating AT sequence, poly[d(A-T)2]. The other cationic porphyrin, for example, cis-BMPyP (Fig. 1), did not induce a B-Z transition for poly[d(A-T)2] (Figure S2). In the presence of cis-BMPyP, the CD spectrum remained as the B-form with its positive band between 260 ~ 280 nm and a negative band between 230 ~ 260 nm.
Figure 2.
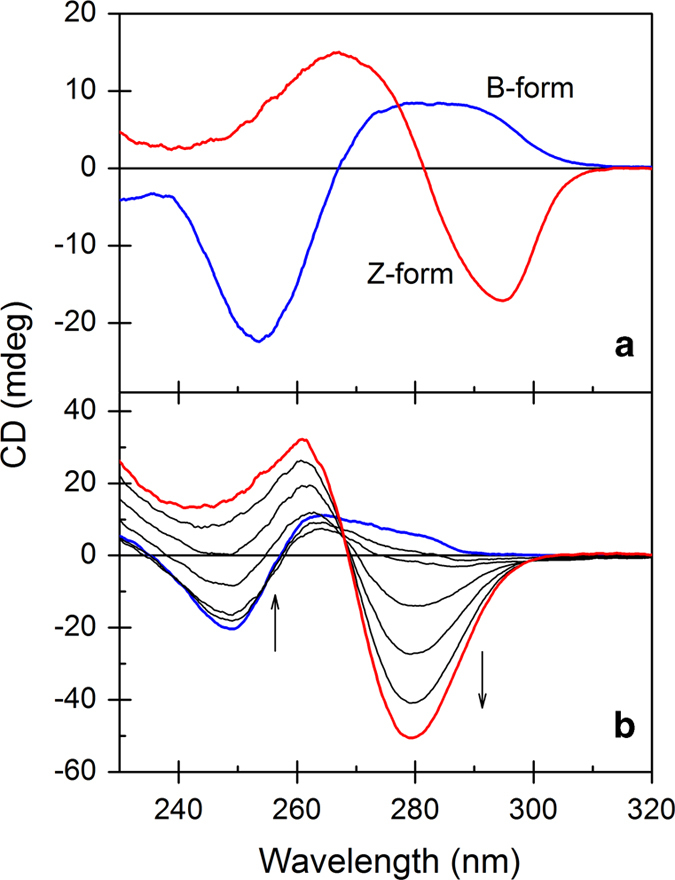
(a) CD spectrum of the B- and Z-form poly[d(G-C)2]. The Z-form was induced by the addition of 4 M NaCl. (b) Selected CD spectrum for the B-Z transition of poly[d(A-T)2] by the addition of trans-BMPyP. [Poly[d(A-T)2]] = 100 μM. To the direction of the arrow, the concentration of trans-BMPyP was increased from 0 to 24 μM in 4 μM increments.
The appearance of a negative CD band at a long wavelength does not necessarily guarantee the formation of the Z-form. For an example, poly[d(I-C)2], a synthetic polynucleotide, produced a Z-form-like CD spectrum. 31P NMR spectroscopy provides convincing evidence for confirmation of the Z-form DNA13,14. In the B-form DNA case, the environment of the phosphate group is homogeneous, whereas that for Z-form falls into two categories owing to its zigzag conformation. As a result, two 31P NMR peaks were observed for the Z-form DNAs. Fig. 3 shows the 31P NMR spectrum for various combinations of polynucleotide and cationic porphyrins. The B-form poly[d(G-C)2] produced one P31 NMR peak at −1.264 ppm. The addition of 4 M NaCl resulted in a split in the 31P NMR peak to 0.371 ppm and −1.016 ppm, reflecting the zigzag conformation of the phosphate groups. This justifies the suitability of 31P NMR for distinguishing the B- and Z-forms. Poly[d(A-T)2] also exhibited a single 31P NMR peak at - 1.234 ppm. On the other hand, the binding of trans-BMPyP resulted in a split of the peak to 0.231 ppm and - 1.313 ppm, similar to poly[d(G-C)2] in a high salt concentration. In addition to inverse CD, which was discussed previously, the 31P NMR spectrum also indicated the formation of the Z-form for poly[d(A-T)2]. In contrast, the binding of a similar porphyrin, cis-BMPyP, did not alter the appearance of the 31P NMR spectrum in a recognizable extent, suggesting that it is only trans-BMPyP that can induce the Z-form specifically for poly[d(A-T)2].
Figure 3.
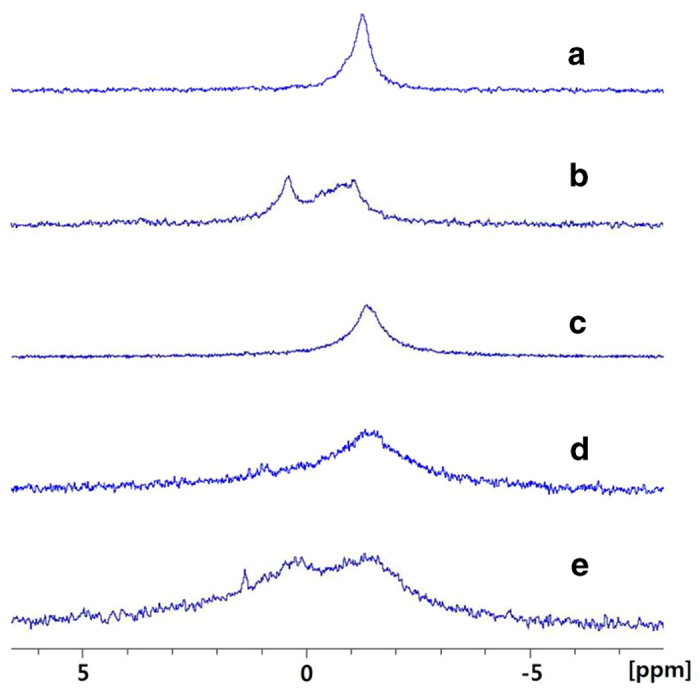
31P NMR spectrum of poly[d(G-C)2] (a), poly[d(G-C)2] + 4 M NaCl (b), poly[d(A-T)2] (c), poly[d(A-T)2] + cis-BMPyP (d) and poly[d(A-T)2] + trans-BMPyP (e) in 5 mM cacodylate buffer, pH 7.0 and 50 μL 99.9% D2O. [DNA] = 2 mM in bases and [Porphyrin] = 0.48 mM.
Interaction of trans-BMPyP with poly[d(A-T)2]
In general, the binding mode of cationic porphyrin to poly[d(A-T)2] can be classified as monomeric minor groove binding, moderate and extensive stacking with increasing [porphyrin]/[DNA base] ratio15,16,17,18,19,20. The characteristic CD spectrum, corresponding to each binding mode, has been reported. Porphyrins that bind at the minor groove of poly[d(A-T)2] in a monomeric manner produced a positive CD band, whereas moderately stacked porphyrins exhibited a bisignate CD spectrum in the Soret absorption region. For example, one of the structurally related meso-tetrakis(N-methylpyridium-4-yl)porphyrin (TMPyP) produced a positive CD signal at the Soret absorption region when bound to poly[d(A-T)2] at a low [porphyrin]/[DNA base] ratio, which was shown to bind across the minor groove, being stabilized by an electrostatic interaction between the DNA phosphate group and TMPyP20. As the relative concentration of TMPyP increased, the bisignate CD spectrum with a positive band between 390 ~ 430 nm and negative band between 430 ~ 460 nm was apparent, which was assigned to the moderately stacked porphyrin, involving a few porphyrin molecules. This type of stacking occurs in the major groove of DNA19. Similar behavior in the CD spectrum was observed for trans-BMPyP at low [porphyrin]/[DNA base] ratios when bound to DNA15 and poly[d(A-T)2]17,18. Fig. 4a shows the CD spectra of the trans-BMPyP-poly[d(A-T)2] complex in the [porphyrin]/[DNA base] ratio of 0.04 to 0.24. Although no CD signal was detected in the entire wavelength (220 ~ 800 nm) for both trans- and cis-BMPyP in the absence of polynucleotide, a positive CD signal was apparent at low [porphyrin]/[DNA base] ratios when associated with poly[d(A-T)2] which is in agreement with previous reports, suggesting that the trans-BMPyP binds the exterior of poly[d(A-T)2] at the minor groove. The intensity of this positive signal tended to increase until the [porphyrin]/[DNA base] ratio reached approximately 0.1. Above the [porphyrin]/[DNA base] ratio of 0.1, the bisignate CD spectrum with a negative band at 431 nm and a positive band at 443 nm became significant. The appearance of the bisignate CD with high intensity suggested that the poly[d(A-T)2] bound trans-BMPyP began to be stacked extensively or form an assembly, in which the porphyrins form an extended, electronically coupled, organized array15,16. As shown in Fig. 4b, the inversion of the CD spectrum corresponding to the B to Z transition of poly[d(A-T)2] coincides with the appearance of the bisignate CD spectrum in the Soret absorption region. This suggests that the B-Z transition of poly[d(A-T)2] is closely related to the formation of an extensive array of trans-BMPyP (Fig. 5). Any helical polymer of repeating, closely spaced negative charges to which trans-BMPyP binds has been suggested to be capable of providing the template needed to produce such an array15. In the current case of the B-Z transition, the formation of the Z form DNA and the extensive array of trans-BMPyP should be cooperative. A full B to Z transition was observed at the [porphyrin]/[DNA base] ratio of 0.2 ~ 0.25, which corresponds to one porphyrin bound per 4 to 5 DNA bases or 2 to 2.5 base pairs. At a higher porphyrin concentration, the CD signal at all wavelengths tended to decrease, suggesting further aggregation of the trans-BMPyP-poly[d(A-T)2] complex.
Figure 4.
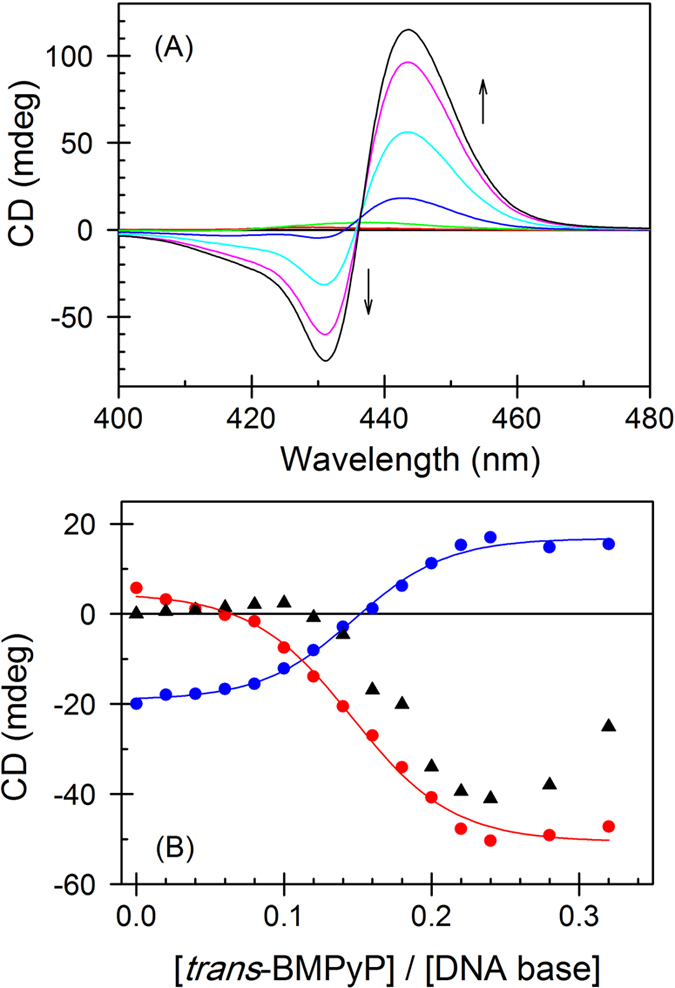
(a) CD spectrum of the trans-BMPyP + poly[d(A-T)2] complex in the Soret absorption region. To the direction of the arrow, [porphyrin]/[DNA base] was increased from 0 to 0.24 in 0.04 increments. (b) Change in the CD intensities at 249 nm (blue circles), 280 nm (red circles) and 431 nm (black triangles) with respect to the [porphyrin]/[polynucleotide base] ratio. The solid lines are drawn as a guide to the eyes. The CD intensity at 431 nm was divided by 3 for easy comparison. [DNA base] = 100 μM.
Figure 5.

Transform of B-form poly[d(A-T)2] to Z-form. Stacking of porphyrin along the polynucleotide stem and the conformation change of polynucleotide occurs simultaneously.
Mechanism of poly[d(A-T)2] specific B-Z transition
As it was mentioned previously, poly[d(G-C)2] has been well-known to form Z form in the presence of a high salt concentration, while trans-BMPyP induced B-Z transition was specific for poly[d(A-T)2]. Observed specificity can be elucidated by difference in the binding mode of trans-BMPyP to these synthetic polynucleotides. Trans-BMPyP has been known to bind at the minor groove of poly[d(A-T)2] at a low [porphyrin]/[DNA base] ratio producing a positive CD signal in the Soret absorption region17,18. As the porphyrin concentration increases, trans-BMPyP starts to stack along the DNA stem, which is represented by a large bisignate CD signal in the Soret absorption region. On the other hand, trans-BMPyP intercalates between base-pairs of poly[d(G-C)2], inducing a weak negative CD spectrum in the same absorption region17,18. Induced CD spectrum of the trans-BMPyP associated with poly[d(A-T)2] and poly[d(G-C)2] are compared in Fig. 6. As it was reported17, trans-BMPyP complexed with poly[d(G-C)2] exhibits a negative CD signal, which has been considered to be a diagnostics for intercalated cationic porphyrins. Therefore, it is conclusive that the binding mode of trans-BMPyP, that is stacking vs. intercalation causes poly[d(A-T)2] specific B-Z transition.
Figure 6.
CD spectrum of the trans-BMPyP + poly[d(A-T)2] (curve a), cis-BMPyP + poly[d(A-T)2] (curve b) and trans-BMPyP + poly[d(G-C)2] (curve c) complex in the Soret absorption region. [Polynucleotide] = 100 μM and [porphyrin] = 24 μM.
A large number of porphyrins have been known to form J-type aggregations either in the presence or absence of template21,22. Two types of aggregation namely Δ- and Λ- macromolecular structure can be formed depending on the direction of stacking, and causes a large bisignate induced CD in the Soret absorption region. Apparent large bisignate CD spectrum observed for trans-BMPyP complexed with poly[d(A-T)2] implies the aggregation of porphyrins on the polynucleotide template. The intensity of this CD spectrum for cis-BMPyP in the same condition was smaller by more ten times compared to that of the trans-BMPyP-poly[d(A-T)2] complex (Fig. 6). Therefore, stacking of cis-BMPyP is far less effective and, consequently, efficient B-Z transition is prevented.
In conclusion, poly[d(A-T)2] forms a left-handed Z-conformation when in the presence of trans-BMPyP. The B-Z transition is associated with the formation of an array of stacked porphyrin and is specific to polynucleotide with alternating AT sequence. Polynucleotides with other sequences, including alternating and non-alternating GC and non-alternating AT, do not form the Z-conformation.
Methods
Preparation and reagents
The porphyrins were purchased from Frontier Scientific, Inc.(Utah, USA) and used as received. Polynucleotides were purchased from Sigma-Aldrich. The synthetic polynucleotides investigated in this study, poly[d(G-C)2], poly[d(A-T)2], poly(dA)·poly(dT) and poly(dG)·poly(dC) were dissolved in 5 mM cacodylate buffer, pH 7.0, containing 100 mM NaCl and 1 mM EDTA by exhaustive shaking at 4 °C followed by several dialyses against 5 mM cacodylate buffer, pH 7.0. The latter buffer solution was used throughout this study. The concentrations of the porphyrins were measured spectrophotometrically using the following extinction coefficients: ε419 nm = 2.4 × 105 cm−1M−1, and ε419 nm = 1.4 × 105 cm−1M−1 for trans-BMPyP and cis-BMPyP, respectively. The extinction coefficients for the polynucleotides were ε262 nm = 6600 cm−1M−1, ε254 nm = 8400 cm−1M−1, ε253 nm = 7400 cm−1M−1 and ε260 nm = 6000 cm−1M−1 for poly[d(A-T)2], poly[d(G-C)2], poly(dG)·poly(dC) and poly(dA)·poly(dT), respectively.
Measurements
The absorption spectra were recorded on a Cary 100 Bio (Australia) spectrophotometer and CD on a Jasco J810 (Tokyo, Japan) spectropolarimeter. The polynucleotide concentration was fixed to 100 μM in the base or phosphate (or 50 μM in base pair), and aliquots of porphyrins were added to the polynucelotide solution to obtain the desired [porphyrin]/[DNA base] ratio. The change in volume was corrected. The pathlength for all CD measurement was 0.5 cm. All measurements were carried out at 25 °C. The 31P NMR (500 MHz) spectra were recorded on a Bruker AVANCE III 500 NMR spectrometer using 5 mm Broad Band Observe (BBFO: for 19F as well) probe and the chemical shifts were recorded in ppm units using 0.0485 M triphenylphosphate (TPP) in Acetone-d6 as the internal standard. The 31P NMR measurements were performed with 2 mM of the sonicated polynucleotides dissolved in 300 μL of 5 mM cacodylate buffer, pH 7.0 and 50 μL 99.9% D2O. All the 31P NMR spectra were obtained at 25 °C.
Additional Information
How to cite this article: Jang, Y. J. et al. Formation of Poly[d(A-T)2] Specific Z-DNA by a Cationic Porphyrin. Sci. Rep.5, 09943; doi: 10.1038/srep09943 (2015).
Supplementary Material
Acknowledgments
This study was supported by Korea Research Foundation (Grant no. NRF 2012-008875).
Footnotes
The authors declare no competing financial interests.
Author Contributions J.Y.J. performed the major part of the experiments; L.C.Y. performed the initial part of the experiments. K.S.K wrote the manuscript and supervised this study.
References
- Pohl F. M. & Jovin T. M. Salt-induced co-operative conformational change of a synthetic DNA: Equilibrium and kinetic studies with poly(dG-dC). J. Mol. Biol. 67, 375–396 (1972). [DOI] [PubMed] [Google Scholar]
- Wang A. H. et al. Molecular structure of a left-handed double helical DNA fragment at atomic resolution. Nature 282, 680–686 (1979). [DOI] [PubMed] [Google Scholar]
- Peck L. J., Nordheim A., Rich A. & Wang J. C. Flipping of cloned d(pCpG)n·d(pCpG)n DNA sequences from right- to left-handed helical structure by salt, Co(III), or negative supercoiling. Proc. Natl. Acad. Sci. USA 79, 4560–4564 (1982). [DOI] [PMC free article] [PubMed] [Google Scholar]
- Mamajanov I., Engelhart A. E., Bean H. D. & Hud N. V. DNA and RNA in anhydrous media: Duplex, triplex, and G-quadruplex secondary structures in a deep eutectic solvent. Angew. Chem. Int. Ed. 49, 6310–6314 (2010). [DOI] [PubMed] [Google Scholar]
- Rich A. & Zhang S. Z-DNA: the long road to biological function. Nat. Rev. Genet. 4, 566–572 (2003). [DOI] [PubMed] [Google Scholar]
- Schwartz T. et al. Structure of the DLM-1-Z-DNA complex reveals a conserved family of Z-DNA binding protein. Nat. Struct. Biol. 8, 761–765 (2001). [DOI] [PubMed] [Google Scholar]
- Ha S. C. et al. A poxvirus protein forms a complex with left-handed Z-DNA: crystal structure of a Yatapoxvirus Zalpha bound to DNA. Proc. Natl. Acad. Sci. USA 101, 14367–14372 (2004). [DOI] [PMC free article] [PubMed] [Google Scholar]
- Ha S. C. et al. The structures of non-GC-repeat Z-DNAs co-crystallized with the Z-DNA-binding domain, hZαADAR1 Nucleic Acids Res. 37, 629–637 (2009). [DOI] [PMC free article] [PubMed] [Google Scholar]
- Bae S. et al. Intrinsic Z-DNA is stabilized by the conformational selection mechanism of Z-DNA-binding proteins. J. Am. Chem. Soc. 133, 668–671 (2011). [DOI] [PubMed] [Google Scholar]
- Lee Y.-M. et al. NMR study on the B-Z junction formation of DNA duplexes induced by Z-DNA binding domain of human ADAR1. J. Am. Chem. Soc. 134, 5276–5283 (2012). [DOI] [PubMed] [Google Scholar]
- Wu Z. et al. Formation of sequence-independent Z-DNA induced by a ruthenium complex at low salt concentrations. Angew. Chem. Int. Ed. 50, 11962–11967 (2011). [DOI] [PubMed] [Google Scholar]
- Kypr J., Kejnovská I., Renčiuk D. & Vorlíčková M. Circular dichroism and conformational polymorphism of DNA. Nucleic Acids Res. 10.1093/nar/gkp026 1–13 (2009). [DOI] [PMC free article] [PubMed] [Google Scholar]
- Patel D. J., Kozlowski S. A., Nordheim A. & Rich A. Right-handed and left-handed DNA: Studies of B- and Z-DNA by using proton nuclear Overhauser effect and P nmr. Proc. Natl. Acad. Sci. USA 79, 1413–1417 (1982). [DOI] [PMC free article] [PubMed] [Google Scholar]
- Portugal J. & Sánchez-Baeza F. J. Mitomycin C binding to poly[d(G-m5C)]. Biochem. J. 305, 185–190 (1995). [DOI] [PMC free article] [PubMed] [Google Scholar]
- Pasternack R. F. & Giannetto A. Self-assembly of porphyrins on nucleic acids and polypeptides. J. Am. Chem. Soc. 113, 7799–7800 (1991). [Google Scholar]
- Pasternack R. F. Circular dichroism and the interactions of water soluable porphyrins with DNA-A minireview. Chirality 15, 329–332 (2003). [DOI] [PubMed] [Google Scholar]
- Jin B. et al. Effect of position and number of positive charges on the intercalation and stacking of porphyrin to poly[d(G-C)2], poly[d(A-T)2], and native DNA. J. Phys. Chem. B . 112, 15875–15882 (2008). [DOI] [PubMed] [Google Scholar]
- Jung J.-A. et al. Effect of number and position of positive charges on the stacking of porphyrin along poly[d(A-T)2] at high binding densities. J. Phys. Chem. B . 114, 7641–7648 (2010). [DOI] [PubMed] [Google Scholar]
- Lee Y.-A. et al. Binding of meso-tetrakis(N-methylpyridium-4-yl)porphyrin to triplex oligonucleotides: Evidence for the porphyrin stacking in the major groove. J. Am. Chem. Soc. 125, 8106–8107 (2003). [DOI] [PubMed] [Google Scholar]
- Jin B. et al. Simultaneous binding of meso-tetrakis(N-methylpyridium-4-yl)porphyrin and 4’,6-diamidino-2-phenylindole at the minor groove of poly(dA)·poly(dT) and poly[d(A-T)2]: Fluorescence resonance energy transfer between DNA bound drugs. J. Am. Chem. Soc. 127, 2417–2424 (2005). [DOI] [PubMed] [Google Scholar]
- D’Urso A., Randazzo R., Faro L. L. & Purrello R. Vortexes and nanoscale chirality. Angew. Chem. Int. Ed. 49, 108–112 (2010). [DOI] [PubMed] [Google Scholar]
- D’Urso A., Fragalà M. E. & Purrello R. From self-assembly to noncovalent synthesis of programmable porphyrins’ arrays in aqueous solution. Chem. Commun. 48, 8165–8176 (2012). [DOI] [PubMed] [Google Scholar]
Associated Data
This section collects any data citations, data availability statements, or supplementary materials included in this article.