Abstract
Drug-drug interactions (DDIs) are a major cause of adverse drug effects and a public health concern, as they increase hospital care expenses and reduce patients’ quality of life. DDI detection is, therefore, an important objective in patient safety, one whose pursuit affects drug development and pharmacovigilance. In this article, we describe a protocol applicable on a large scale to predict novel DDIs based on similarity of drug interaction candidates to drugs involved in established DDIs. the method integrates a reference standard database of known DDIs with drug similarity information extracted from different sources, such as 2D and 3D molecular structure, interaction profile, target and side-effect similarities. the method is interpretable in that it generates drug interaction candidates that are traceable to pharmacological or clinical effects. We describe a protocol with applications in patient safety and preclinical toxicity screening. the time frame to implement this protocol is 5–7 h, with additional time potentially necessary, depending on the complexity of the reference standard DDI database and the similarity measures implemented.
INTRODUCTION
DDIs cause up to 30% of adverse drug effects (ADEs)1,2, and adverse events are one of the primary reasons that drugs fail clinical trials3. Moreover, in a study published in 2007 assessing the effects of DDIs4, they were estimated to be responsible for 0.57–4.8% of all hospital admissions. As a result, DDIs are a drain on public health, costing billions of dollars and reducing patients’ quality of life. The detection and preclinical prediction of DDIs remains an open research challenge with a broad effect on both drug development and pharmacovigilance. The design of tools to help study possible DDIs is of great interest to pharmaceutical companies, regulatory authorities, such as the US Food and Drug Administration (FDA)3,5, as well as to many researchers working in a variety of fields including absorption, distribution, metabolism and excretion (ADME) properties, computational biology, translational medicine and pharmacovigilance.
DDIs can occur any time a patient is taking more than one drug concurrently and may occur at the pharmacokinetic level (i.e., ADME properties) or at the pharmacodynamic level (i.e., drugs targeting the same pharmacological receptor or targeting related pathways). As a result, DDIs may manifest as a reduction in efficacy or as an increased toxicity of the drugs. The final action can be synergistic, antagonistic or coalistic—whereby a new effect is produced that is not associated with either drug taken individually.
Although DDIs are evaluated during drug development, many of them go undetected owing to the limited number of participants in clinical trials and the high number of drugs and combinations that result from these trials. DDIs are also studied when drugs enter the marketplace. However, multiple drug combinations and the presence of different comorbidities and confounding factors make the task of detecting DDIs difficult. Depending on the severity of the DDI, regulatory authorities such as the FDA can adopt different measures to address it, from the introduction of a warning in the label of a drug involved in the DDI to the drug’s withdrawal from the market.
We describe herein a protocol for multitype DDI prediction that can facilitate and improve DDI detection. This approach can generate sets of potential DDI candidates for both pharmacokinetic and pharmacodynamic interactions. The set of new potential DDIs could be used to filter out candidates extracted from pharmacovigilance databases, such as Electronic Health Records, and to strengthen the signals obtained through data mining6,7.
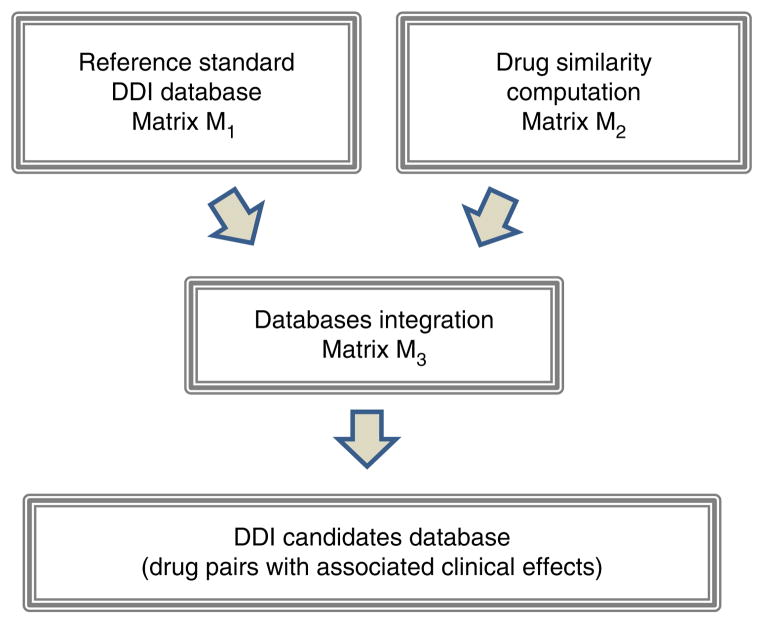
This protocol, whose workflow is outlined in Figure 1, provides a detailed description of the different steps involved in integrating drug information data. The protocol is generalizable and can be implemented using sources of data other than those described in the PROCEDURE, from other well-established DDI sources to drug similarity measures not used in this protocol. In fact, we have been working on the development of this type of DDI predictor using three different similarity measures: 2D and 3D molecular structure approaches, and interaction profile similarity8–10. In this article, we increased the number of similarity measures by introducing in the DDI predictor information related to target and adverse-effects similarities.
Figure 1.
Overview of the protocol to develop the DDI predictor.
Integrated workflow for the multitype DDI predictor
An overview of the general protocol is provided in Figure 1. The protocol involves the generation of the reference standard DDI database (matrix M1) and the drug similarity databases (matrix M2). These data are integrated through a straightforward process consisting of the extraction of the maximum value in each array of the matrix multiplication to generate the set of potential new DDIs (matrix M3). The last stage of the protocol is the further assessment of the performance of the final model.
Generation of the reference standard DDI database (matrix M1)
This stage is the first in the development of the protocol. In the approach delineated here, the DDI database is downloaded from DrugBank (http://www.drugbank.ca/) using the Interax Interaction Search module and transformed in a matrix, M1, with binary values (1, 0), representing the interaction between two drugs and their lack of interaction, respectively. As part of the analysis, the pharmacological or clinical effects associated with the DDIs are annotated.
Generation of the drug similarity databases (matrix M2)
In this second stage of the protocol, similarity data are calculated through the implementation of three substages: calculation of the similarity measure, computation of similarity between drugs pairs and final construction of the matrix M2.
Calculation of similarity measures
Different similarity measures can be calculated for all the drugs included in the study and integrated in the system, in particular measures such as 2D structural fingerprints, interaction profile fingerprints (IPFs), target profile fingerprints, ADE profile fingerprints and 3D pharmacophoric approaches.
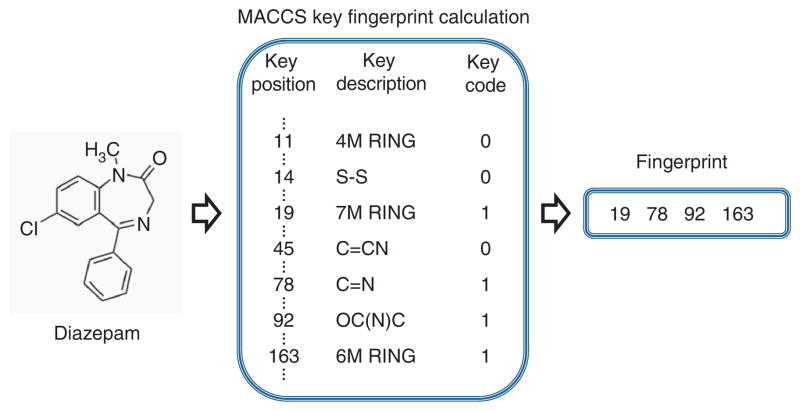
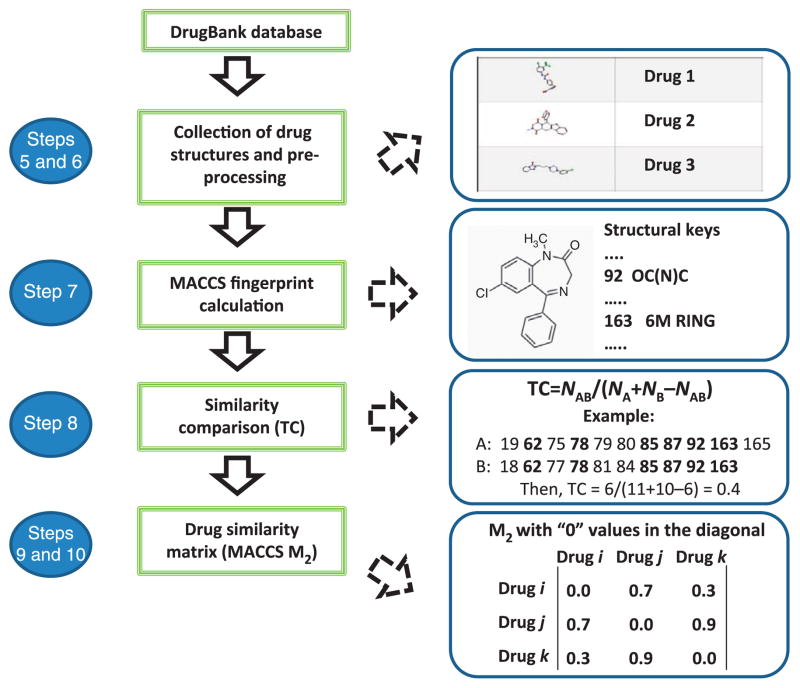
The basic 2D molecular structure fingerprint technique consists of representing a molecule as a bit vector that codifies the presence or absence of different substructural or pharmacophoric features in each bit position. In the development of this protocol, we used MACCS (for Molecular Access System) structural keys11, although other types of 2D or 3D molecular fingerprints could equally be used. MACCS codifies 166 structural keys in bit positions. As an example, some structural keys in the MACCS fingerprint for the drug diazepam (Fig. 2) are as follows: bit 19 (seven-member ring), bit 78 (C=N group), bit 92 (OC(N)C group) and bit 163 (six-member ring). In Figure 2, only a small representation of the structural keys included in MACCS for the drug diazepam is reported. As a way to represent a sparse binary vector, only the positions codifying the fragments present in the molecule are stored in the final fingerprint.
Figure 2.
Example of some structural keys in the MACCS fingerprint for the drug diazepam. ‘Key position’ assigns a specific number to a particular chemical structural feature; ‘Key description’ describes the said structural feature; and ‘Key code’ assigns a value of ‘1’ when the structural feature is present in the drug being examined, and a value of ‘0’ when the structural feature is not present.
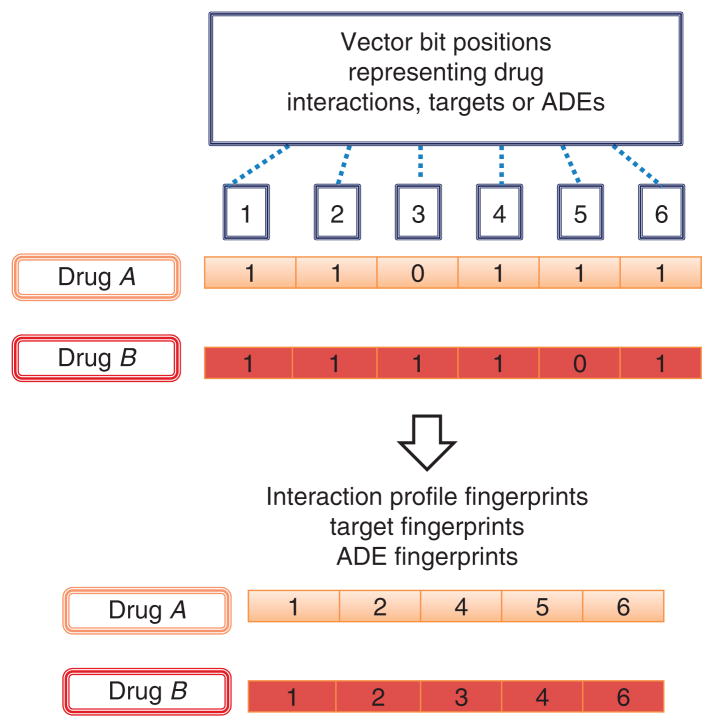
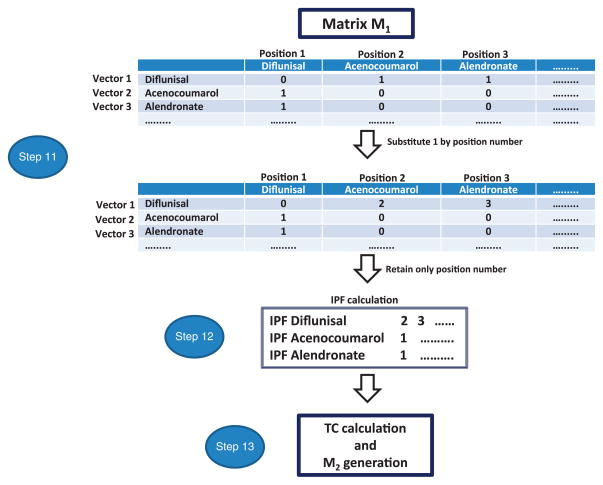
Another similarity measure that can be integrated in the development of the DDI predictor is an IPF9. The design of an IPF is similar to that of a molecular structure fingerprint, but instead of codifying substructural features in each bit position of the vector, an IPF codifies the different drug interactions described for a particular drug (Fig. 3). Through IPF, two drugs can be compared on the basis of the similarities between their individual drug interaction profiles. The same idea can be expanded to codify, for each drug, its known targets (target fingerprints) or the adverse effects already described (ADE fingerprints)12,13. In Figure 3, three different drug fingerprints that can be calculated to determine the level of similarity between drugs are represented.
Figure 3.
Different drug fingerprints codifying in bit positions drug interactions (IPFs), target information (target fingerprints) or adverse effects (ADE fingerprints).
The calculation of 3D molecular structure information follows a different, more complex scheme. The idea in this case is to use the 3D structure of each drug included in the study as a template and to identify other drugs with similar shape and electrostatic properties through pharmacophoric shape screening14. The alignment of the structures is based on the identification of atom triplets and the use of a pairwise atom distance distribution approach. However, different conformational analysis, alignment algorithms and software packages can be used and implemented in the protocol.
Computation of similarity between drugs
In this protocol the Tanimoto coefficient (TC) is used to quantify and compare drug similarity using the different measures, including MACCS, IPFs, target fingerprints and ADE fingerprints. The TC is also known by the term Jaccard index. The TC can adopt values in the range between 0 (maximum dissimilarity) and 1 (maximum similarity). The TC between fingerprints A and B is defined as follows:
In the formula, NA and NB is the number of features present in fingerprints A and B, respectively, and NAB is the number of features present in common to both fingerprints A and B. In the case of two ‘identical’ drugs, TC is 1 (NA = NB = NAB), whereas if there is no fingerprint overlap between drugs TC is 0.
In the case of the similarity measure based on the 3D pharmacophoric approach, once the alignment between the drug structures is made, i.e., the shape of query drug A and that of drug B being screened, it is possible to calculate a similarity scoring (Phase Sim property—Sim(A,B)) by calculating the overlapping volume between pharmacophoric features (Phase package, version 3.3; http://www.schrodinger.com). As for TC, the Phase Sim property ranges in value between 0 (minimum similarity) and 1 (maximum similarity) and is a function of the overlap between structure A and structure B (O(A,B)) and the maximum of the self-overlaps, aligning each drug against itself (O(A,A) and O(B,B)).
Construction of the matrix M2
The third stage in the generation of the M2 matrix consists in arranging the data into the said matrix M2, so that each cell represents the similarity between the corresponding pair of drugs. In the present protocol, five possible M2 matrices are calculated and weighed with each of the five described similarity measures.
Generation of the new set of potential DDIs (matrix M3)
In this stage of the protocol, the two databases M1 and M2 are integrated. The objective here is to obtain the matrix M3 that contains all the possible scored DDIs through the multiplication of M1 by M2 retaining only the highest value in the array multiplication in each cell (the complete process is explained in the PROCEDURE). In the final stage of the protocol, it is possible to associate clinical effects with the new DDIs.
Assessment of the model performance
A simple validation to assess the performance of the protocol consists in plotting the receiver operating characteristic (ROC) curve. In ROC curves, the true positive fraction (sensitivity) is plotted against the false positive fraction (1 – specificity). The area under the curve (AUROC) can have values between 1 (perfect classifier) and 0.5 (random classifier). In our case, to plot the ROC curve, we considered the initial well-established DrugBank interactions (reference standard) as true positives and the remaining protocol-generated DDI candidates that are actually not contemplated as existing DDIs by the DrugBank database itself as false positives. Statistical measures, such as sensitivity, specificity, precision and enrichment factor, could also be calculated to evaluate performance. However, a more complete assessment of the performance of the model can be carried out in external tests that are used to determine whether the data introduced in the model are representative enough to predict DDIs reported in data sources other than the DrugBank. It is convenient to test models using a cross-validation approach, i.e., transferring 25% of the DDIs reported in the data source to a test set (the ‘hold-out’ validation set) and constructing the model with the remaining 75% of the DDIs, and an approach that makes use of external test sets (i.e., provided by additional reference standard sources, such as Micromedex (http://www.micromedexsolutions.com)).
Characteristics, caveats and limitations
A prerequisite for the implementation of this protocol is to have a reference standard database with well-established DDIs. On the basis of these data, and through the integration of drug similarity information, the protocol relies and expands on a pattern of interactions that are already detectable in the initial reference standard DDI data, i.e., similar drugs have similar drug interactions. For this reason, a limitation of the present approach resides in the comprehensiveness of the initial standard DDI data used to construct it. The model performance is expected to be limited if we analyze DDIs with no representation in the initial database. The example procedure reported below makes use of the DDI DrugBank database, but additional data from large DDI sources could be used to increase the generality of the approach.
Prediction models developed using this protocol showed great robustness in hold-out validation sets. As described by our research group8,9, the DDI-predicting models were generated with 85%, 70% and 55% of the initial DDI reference standard, whereas the remaining 15%, 30% and 45% of the DDIs, respectively, were used as (hold-out) validation data sets. The performance of the models in the different sets was barely affected by the partition of the initial reference standard. As an example, in a protocol including 928 drugs involved in 9,454 interactions, and using MACCS fingerprints as a similarity measure8, sensitivity was 0.68 and specificity was 0.96 (100% of the DDI reference standard in the training). The models generated by implementing a protocol after 45% of the interactions were removed from the initial data set (to be used as the hold-out set) showed metrics very close to those of the initial system8: sensitivity and specificity in the training data set—the one including 55% of the data set interactions—was 0.54 and 0.96, respectively; when evaluating the hold-out validation set, sensitivity was 0.56 and specificity was 0.96. It is worth noting, however, that the method’s selection to define the different hold-out sets was random; if the method takes into account selectively all the drugs included in defined pharmacological categories, the performance of the final system will be negatively affected by the division of different sets of DDIs. This decrease in performance is due to the fact that not enough representative interaction data will be available in the reference standard to try and predict successfully the interactions for a particular drug class in the hold-out set.
The protocol described in this article is designed to be used on a large scale. The generation of a large list of drug pair candidates along with the associated biological or clinical effect is a useful resource to be combined with other methodologies of large-scale analysis, such as Electronic Health Records data mining, to improve signal detection steps. For this reason, the work-flow described herein is not suitable for the detection of small variations in the similarity measure that can strongly affect the biological effects of the drugs. As an example, different biological outcomes caused by small variations in the molecular structure could go undetected after implementation of the present protocol. However, some similarity measures could be more suitable than others to detect DDI risks in the same category of drugs.
The implementation of the present protocol generates new DDI candidates that belong to two different categories: (i) a new pair of DDI candidates is generated by comparing two drugs that belong to the same pharmacological category, i.e., an initial A–B interaction generates a predicted A–C interaction, when B and C are in the same pharmacological class; and (ii) the predictor generates new DDI candidates comparing two drugs belonging to different pharmacological classes. DDI candidates belonging to the first category are likely to be generated when the TC value is very high, i.e., the first DDI candidates highlighted by the model with the best score (TC values). The information provided by the predictor in this case is more obvious and rather predictable. However, the model is still useful to scientists with no pharmacological background. The generation of DDI candidates belonging to the second category is more frequent as the TC value decreases. Although the certainty of the DDI and the associated effect is lower in the second category (higher likelihood of false positive DDIs), the new DDI candidates are more unexpected and challenging than those belonging to the first category.
The above-mentioned ability of this protocol to enable researchers to detect similarities between drugs in the same or different pharmacological classes is also related to the similarity measure implemented in the predictor. In this protocol, M2 is constructed by introducing different types of similarity measures between drugs: 2D and 3D molecular structure similarity, interaction profile similarity, target profile similarity and adverse event profile similarity. A limitation in the predictor could be the ‘upstream’ bias introduced with the information provided in the construction of the similarity measurement. This biased information could, for example, consist of similarity measures, such as the interaction profile, target or side effects, calculated through knowledge databases such as DrugBank (http://www.drugbank.ca) or SIDER (http://sideeffects.embl.de/).
Information included in the data sources used to calculate the similarity measures could be highly influenced by pharmacological classification that is biased or dependent on possibly partial available information. For this reason, although they can detect interclass similarity, these measures could have a tendency to capture intraclass drug similarity with high scores. Moreover, as we point out in the ANTICIPATED RESULTS, DDI predictors based on knowledge measures performed well in our test detecting differences in drug-specific interaction risks for drugs belonging to the same pharmacological category. Notably, however, although 2D and 3D molecular structure methodologies offer the opportunity to capture molecular similarities between drugs in the same pharmacological class, they also potentially enable researchers to detect high similarity between pairs of drugs that belong to different pharmacological categories (interclass similarity). As mentioned above, this ability to detect interclass similarity has the potential of pointing out challenging and unexpected DDI candidates. Moreover, knowledge-dependent similarity measures cannot be applied to drugs for which no relevant information is available–that is, it cannot be applied to drugs that have been recently introduced in the market, for which limited target or adverse event profile information exists.
The integration in the analysis of other types of similarity measures or the implementation of a complex and common measure with information from all the similarity estimation approaches may improve the results and contribute to making this protocol more robust.
Other methods to discover DDIs
Different methodologies have been described to identify and analyze new DDI candidates, including pharmacokinetic and pharmacodynamic interactions. Metabolism-related interactions have a relevant clinical impact. In fact, cytochrome P450 (CYP) enzymes are responsible for the metabolism of many drugs. Different approaches have been developed to identify DDIs between CYP-metabolized drugs, which are approaches that integrate in vitro data to predict in vivo (animal and human) CYP-mediated interactions15. Computational modeling has also been used to predict CYP metabolism–based DDIs16. Other pharmacokinetic processes, such as absorption, distribution or excretion, could be of interest from the point of view of DDI prediction17. Some researchers have also studied pharmacodynamic interactions and their mechanisms using response surface analysis18.
Informatics has an important role in the discovery of new DDIs. Cheminformatic methods, such as 2D/3D quantitative structure-activity relationships (QSAR) and molecular docking, can be useful to predict DDIs19–21. In contrast, data mining of scientific literature, electronic medical records or adverse event databases is an emergent approach for DDI detection2,22–24. In a manner similar to the present protocol, a large-scale method was also published on the basis of the integration of similarity measures with knowledge DDI databases25. Our research group has also introduced large-scale DDI predictors based on similarity measures8–10. The novelty of the present protocol resides in the simplicity of the database integration and the pharmacological effects associated with the final candidates. An important feature of our approach is that it is a multi-type predictor that can isolate the pharmacological or clinical effect associated with the predicted interactions.
Experimental design
In the implementation of the protocol and calculation of similarity measures, i.e., 2D molecular fingerprints, molecular modeling packages, such as Molecular Operating Environment (MOE; http://www.chemcomp.com/), or free open-source initiatives, such as Open Babel (http://www.openbabel.org/) and Python (https://www.python.org/), can be used. Both procedural routes are good alternatives for the similarity measures calculation. MOE also provides a tool for performance analysis through ROC curves. However, the use of some free packages, such as R (http://www.r-project.org), could be a great multifunctional tool with interesting options for calculating multiple ROC curves and confidence intervals. The order in which the fingerprint calculations should be carried out is not definite, and the order laid out in the PROCEDURE is not mandatory. Similarity measure selection criteria could be dependent on the characteristics of the study, and only one similarity measure can be implemented in the development of the protocol.
MATERIALS
EQUIPMENT
Computational requirements
Computer: the DDI model can be developed using a computer with Windows, OS X or Linux/Unix operating systems, with no special memory requirements
Software: although different software packages can be used for this protocol, the PROCEDURE is implemented using the molecular modeling software MOE 2011.10 (http://www.chemcomp.com/) and the Schrödinger package (http://www.schrodinger.com/). Excel software is used in the generation of the different matrices, and STATISTICA26 (http://www.statsoft.com/) for the final integrative data analysis. Alternative procedures to those involving MOE and Schrödinger (Boxes 1–3) are also provided in this protocol, which make use of the open-source software Open Babel (http://www.openbabel.org/), Python (http://www.python.org/) and R (http://www.r-project.org/)
Box 1. Using Python to calculate molecular fingerprints and TC between all drug pairs with Open Babel ● TIMING <5 min.
Name of the script: calc_pairwise_Tc.py
Summary: given a .txt list of tab-delimited chemical IDs and SMILES codes, e.g.,
CHEMBL973   C\C(=C(/C#N)\C(=O)Nc1ccc(cc1)C(F)(F)F)\O
CHEMBL1382  CC(C)N(CC[C@H](c1ccccc1)c2cc(C)ccc2O)C(C)C
this script generates an output .csv file containing all pairwise TCs above a specified cutoff (T_CUTOFF, default 0.45). TCs are calculated using Open Babel and MACCS fingerprinting (http://openbabel.org/docs/dev/Features/Fingerprints.html). The fingerprint can be changed by specifying a different string for FINGERPRINT. Available fingerprints are FP2, FP3, FP4 and MACCS.
-
Import modules in Python:
import csv import subprocess import re import os -
Specify the TC cutoff. This option is useful if only the TCs of similar molecules above the established cutoff are needed. Otherwise, set T_CUTOFF=0 to provide all TC pair values:
T_CUTOFF = 0.45
-
Specify fingerprint (‘FP2’, ‘FP3’, ‘FP4’ or ‘MACCS’); as an example, to specify fingerprint MACCS, use the following command:
FINGERPRINT = ‘MACCS’
-
Assign a filename (e.g., SMILES.txt) and open the input file:
  FILENAME = ‘SMILES.txt’
  input = open(FILENAME,’r’)
-
Create a temporary formatted chemical list:
input_temp = open(‘temp_smi_file.txt’,’w’)
-
Create a dictionary of chemicals to be compared:
input_dict = dict()
-
Read the input and the files previously created (steps 4–6 in this box):
for line in input: newline = line.split() id = newline[0] smiles = newline[1] input_dict[id] = smiles input_temp.write(‘%s\t%s\n’ %(smiles, id) ) input.close() input_temp.close() -
Open the results file (.csv file):
  f = open(‘TC_results.csv’, ‘w’)
  writer = csv.writer(f)
  writer.writerow([‘chemical1’, ‘chemical2’, ‘TC’])
-
For each chemical in input list, calculate the TC between that chemical and all other chemicals in the input list using Open Babel:
for chemical1 in input_dict: babel_command = ‘obabel -ismi -:”%s” temp_smi_file.txt -ofpt -xf%s’ %(input_dict[chemical1], FINGERPRINT) output = subprocess.Popen(babel_command, shell=True, stdout=subprocess.PIPE, stderr=subprocess.PIPE) -
Read and parse output from Open Babel:
TC_list = [] while True: line = output.stdout.readline() #line example: “>CHEMBL1382 Tanimoto from CHEMBL973 = 0.2” if line != “: newline = re.split(‘>|=‘, line) #newline: [“, ‘CHEMBL1382 Tanimoto from CHEMBL973 ‘, ‘ 0.2\n’] #indices: [0] [1] [2] if len(newline) > 2: id_catcher = newline[1].split() chemical2 = id_catcher[0] TC = float(newline[2].strip()) TC_list.append((chemical2, TC)) else: break -
Write the TCs exceeding the cutoff to the output file (exclude chemical1 = chemical2—exclude chemicals with the same molecule name—where TC = 1):
  for chemical2,TC in TC_list:
   if TC > T_CUTOFF and chemical1 != chemical2:
   writer.writerow([chemical1, chemical2, TC])
  f.close()
  os.remove(‘temp_smi_file.txt’)
After the script is run in Python, the output file will produce a list of pairs of compounds and the relevant TC that quantifies the level of similarity between them. Transform the data thus obtained into a matrix M2 containing a TC in each cell and set values in the diagonal to 0, as detailed in Step 10 of the main PROCEDURE.
Box 3. Calculating AUROC via R software ● TIMING <5 min.
Install the ROCR package; create and save a .csv file containing the columns ‘predictions’ (containing the TC scoring from the predictor) and ‘labels’ (containing the values of 1 or 0 for true positives or false positives, respectively).
-
In the R console, load ROCR:
> library(ROCR) -
Read data:
> mydata = read.csv(“file_name.csv”) -
Calculate ROC and list AUC values:
    > pred <- prediction(mydata$predictions, mydata$labels)
    > perf <- performance(pred, “auc”)
    > perf@y.values
Databases
Reference standard DDI database: For the development of the predictor, it is necessary to use a knowledge database with well-established DDIs. We used the DDI database from DrugBank (http://www.drugbank.ca). However, the use of larger resources of interactions could be convenient for the development of the system. As an example, DDIs from Drugs.com database (http://www.drugs.com/) or Micromedex (http://www.micromedexsolutions.com/) can be used to implement this protocol ▲ CRITICAL For the development of this protocol, it is necessary to use a database of well-established DDIs (reference standard) with a molecular similarity database extracted from structural molecular simulations or the comparison of different biological molecular properties acquired from knowledge databases.
Molecular structure database: for the calculation of 2D structural fingerprints and 3D pharmacophoric approaches, we downloaded the database from DrugBank (and it is this approach that is detailed in the PROCEDURE). Other sources of data can be consulted, however, to obtain the molecular structure of the drugs, such as PubChem (http://pubchem.ncbi.nlm.nih.gov)
Interaction profile database: to calculate the IPFs, we used the DDIs described in DrugBank, although other sources could be used
Target database: we integrated the drug targets, enzymes, transporters and carriers from DrugBank in a unique DrugBank target database to calculate the drug target fingerprints. Alternative databases that could equally be used include PubChem (http://pubchem.ncbi.nlm.nih.gov) or ChEMBL (https://www.ebi.ac.uk/chembl)
Adverse effect database: as above, although different databases can be used to obtain information on ADEs, the PROCEDURE details the use of a particular one, the SIDER database (http://sideeffects.embl.de), which contains adverse effects introduced in the drug labels. Other databases of ADEs can also be used, such as the Offsides database27 (http://people.dbmi.columbia.edu/tatonetti/resources.html). Drug reactions mentioned in the cited databases are possible or likely, but in some cases further studies would be necessary to confirm the adverse reactions
PROCEDURE
Generation of the reference standard DDI database (matrix M1) ● TIMING <4 h
-
1|
Use the Interax Interaction Search module in the DrugBank database to check for interactions between different drugs at the same time. Save the DDIs found in DrugBank into a tab-separated file containing three columns: the first column, ‘Drug A’, will contain the generic names of all drugs involved in DDIs according to the database; the second column, ‘Drug B’, will contain the generic names of the same set of drugs reported in the relevant order according to the known interactions; and the third column will contain the description of the effect produced by the interaction; see Table 1 for an example of how this file should look like.
▲ CRITICAL STEP It is worth noting that all the interactions should appear twice in the file, as the drugA-drugB interaction is the same as that for drugB-drugA. The presence of these repetitions is important to generate a symmetric M1 matrix.
-
2|
List the drugs in column A and in row 1 of an Excel worksheet.
-
3|
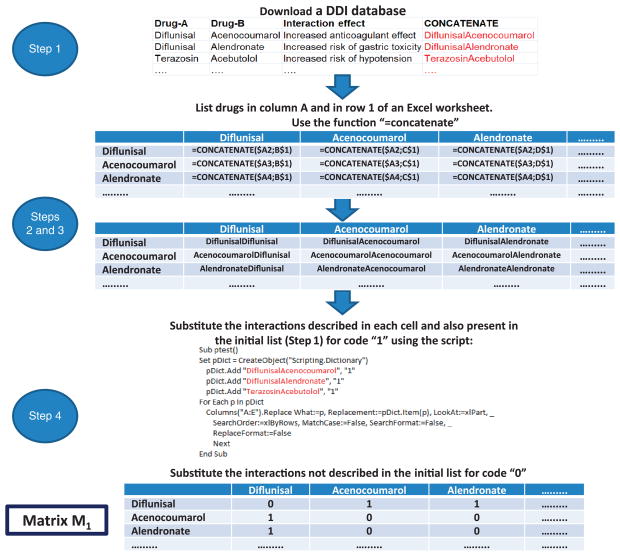
Use the function ‘=concatenate’ as described in Figure 4 to bind the drug names.
-
4|
Substitute the interactions described in each cell and also present in the initial list with ‘1’, so as to indicate that a particular cell contains a DDI described in the initial DrugBank database. Place a ‘0’ in all cells representing ‘interactions’ not actually existing according to the DrugBank list. Through this process, the researcher will generate the matrix M1, with binary values, 1 and 0, representing the interaction between two drugs and their noninteraction, respectively.
▲ CRITICAL STEP Make sure that matrix M1 thus obtained is symmetrical and contains the same interactions A–B and B–A in the relevant cells.
TABLE 1.
Examples of DDIs described in the DrugBank database.
| Drug A | Drug B | Interaction effect |
|---|---|---|
| Ketoprofen | Acenocoumarol | The nonsteroidal anti-inflammatory drug (NSAID) ketoprofen, may increase the anticoagulant effect of Acenocoumarol |
| Troleandomycin | Aprepitant | The CYP3A4 inhibitor increases the effect and toxicity of aprepitant |
| Zuclopenthixol | Delaviridine | Delaviridine, a strong CYP2D6 inhibitor, may increase the serum concentration of zuclopenthixol by decreasing its metabolism |
| Spironolactone | Candesartan | Increased risk of hyperkalemia |
| Tobramycin | Captopril | Increased risk of nephrotoxicity |
| Zuclopenthixol | Dasatinib | Additive QTc prolongation may occur |
| Indinavir | Risperidone | Increased risk of extrapyramidal symptoms |
| Sotalol | Ranolazine | Possible additive effect on QT prolongation |
| Mesoridazine | Quinine | Increased risk of cardiotoxicity and arrhythmias |
| Mazindol | Trifluoperazine | Decreased anorexic effect, may increase psychotic symptoms |
| Timolol | Verapamil | Additive effects of decreased heart rate and contractility may occur. Increased risk of heart block |
| Prendisone | Midodrine | Increased arterial pressure |
Figure 4.
Workflow of the different steps implicated in the generation of the matrix M1, containing the reference standard DDI database.
Calculation of similarity measures and TCs between drugs (matrix M2): 2D MACCS fingerprints ● TIMING <1 h
▲ CRITICAL Please note that the instructions provided in the main PROCEDURE are given with the assumption that the researcher will use the MOE software. However, open-source software can also be used for the purpose of fingerprint and TC calculation. In Box 1, we provide directions to be implemented in Python to calculate MACCS fingerprints using Open Babel. In Box 2, we provide directions to calculate TCs between every type of fingerprint that has been calculated by implementing the relevant directions in this subsection of the PROCEDURE, as well as the next. This option is useful for calculating the TC between the interaction profile, target fingerprints and ADE fingerprints.
Box 2. Using Python to calculate TCs between fingerprints ● TIMING <5 min.
Name of the script: tanimoto.py
    Usage: python tanimoto.py < fingprint_file.fpt > similarity_file.txt
    Summary: this script computes the TCs between a set of fingerprints from the standard input and print them to the standard output.
    fingerprint_file.fpt example
    ----------------------------
    id1,1 2 4 10
    id2,1 3 4 5 6
    id3,2 4 6 10
-
Import modules into Python:
  import os
  import sys
  from collections import defaultdict
-
Define the similarity function:
def tanimoto(a, b): return len(a&b)/float(len(a|b)) -
Load the fingerprint data calculated as in Steps 7 and 11–13 of the main PROCEDURE:
fingerprints = defaultdict(set) for line in sys.stdin: identifier, fpt = line.split(‘,’) fingerprints[identifier] = set(fpt.split(‘ ‘)) -
Print the similarities.
  for id1 in sorted(fingerprints.keys()):
  for id2 in sorted(fingerprints.keys()):
  if id1 > id2:
   continue
  similarity = tanimoto(fingerprints[id1], fingerprints[id2])
  print ≫ sys.stdout, “%s\t%s\t%f” % (id1, id2,similarity)
Through this script, the researcher will obtain a list of drug pairs and the relevant TC values. Transform the data obtained into a matrix M2 containing TC in each cell and set values in the diagonal to 0, as detailed in Step 10 of the main PROCEDURE.
▲ CRITICAL Figure 5 illustrates the general workflow for the generation of M2.
Figure 5.
Workflow of the different steps implicated in the generation of the matrix M2 containing the 2D structural MACCS similarity information.
-
5|
Download the drug structures included in the study from DrugBank in .sdf format. Upload this .sdf file with the molecular modeling software MOE. As mentioned in the INTRODUCTION, although the use of DrugBank for the generation of M1 and M2 is detailed here, this protocol can be also implemented using other sources of drug structures. The model also enables the calculation of additional drugs as a test set.
-
6|
By using the ‘Wash’ module in the MOE software, disconnect group I metals in simple salts and keep only the largest molecular fragment. Add hydrogen atoms to the structures and homogenize the protonation state—i.e., consider all the molecules to be in a neutral state. Save the data in a new field in the file.
▲ CRITICAL STEP It is important to preprocess the structural data using the Wash module to avoid possible problems with the structure of the molecules. By implementing this step, researchers make sure that the molecular structures are suitable for fingerprint calculation.
-
7|
To calculate MACCS fingerprints, open Compute→Fingerprint in the data file window and select FP:MACCS and the field in which to apply the calculation—i.e., in the present case, the name of the field with the molecules that have already been preprocessed in Step 6.
▲ CRITICAL STEP Although in Steps 5–7 researchers are directed to calculate 2D MACCS fingerprints because they showed good results in previous studies6–8, other types of molecular fingerprints could also be calculated. As an example, researchers can calculate pharmacophoric fingerprints or typed atom distance fingerprints weighed with information related to atom types and distances (atom types: acid, basic, hydrogen bond donor or acceptor, hydrophobic). This type of fingerprinting procedure could capture better the similarity between two drugs when a particular charged group could be important for the interaction with the receptor (i.e., the bioisosteric replacement of carboxylate moiety by tetrazole motif, both with anionic characteristics). In this case, the protonated or deprotonated state of a drug, rather than its neutral state, would be considered to define the ionization state.
-
8|
Use the ‘Fingerprint Cluster’ module in MOE to calculate the TC, and thus measure the similarity between the different fingerprints. Save the resulting matrix file containing the similarity between molecules. Each cell in this file represents the similarity between the relevant pair of drugs.
-
9|
Use the ‘sim_matrix2txt.svl’ script in MOE to convert the similarity matrix constructed in Step 8 from binary to ASCII format. For this purpose, after opening the .svl file with MOE upload the database with the molecular structures (Step 5); next, upload the matrix file that you want to convert, and save the similarity matrix output as a .txt file. Please note that the final similarity matrix contains the TC between the drugs in an inverted scale (0 means maximum similarity).
We recommend inverting the matrix at this point so that the TC spans values between 0 (maximum dissimilarity) and 1 (maximum similarity).
-
10|
Introduce 0 values in the matrix diagonal. Name this matrix M2.
▲ CRITICAL STEP As the method is based on matrix multiplication and maximization, the values in the diagonal of the matrix need to be set to 0 to avoid the growth of data noise caused by the ‘similarity’ of drugs with themselves.
Calculation of similarity measures and TCs between drugs (matrix M2): IPFs ● TIMING <1 h
▲ CRITICAL Figure 6 shows a general workflow for the generation of IPFs.
Figure 6.
Workflow of the different steps implicated in the generation of the matrix M2 containing IPF similarity information.
-
11|
Include a position number for all the drugs listed in the columns of the matrix M1 generated in Step 4 of the PROCEDURE. Substitute values 1 in each cell in matrix M1 with the vector position number. Each vector position number will codify a drug interaction.
-
12|
Construct the final IPFs retaining only the vector position numbers for each drug. This is an efficient way to represent a sparse binary vector. Through this process, the researcher will calculate the IPFs for all the drugs included in the study. Save the file as .txt.
-
13|
Read the .txt file containing IPFs using MOE, and repeat the process described in Steps 8–10 to calculate the TC between all the pairs of drugs and generate M2, but in this case use IPF similarity information to calculate the TC. Alternatively, TC between IPF fingerprints can be calculated using the open-source Python according to the instructions in Box 2.
? TROUBLESHOOTING
Calculation of similarity measures and TC between drugs (matrix M2): target fingerprints ● TIMING <1 h
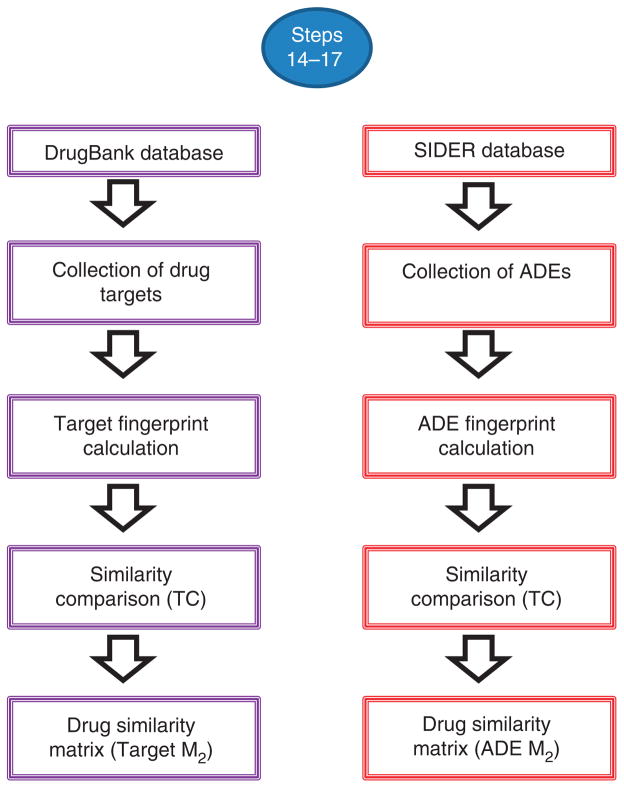
▲ CRITICAL The workflow for the calculation of target fingerprints is detailed in Figure 7.
Figure 7.
Workflow of the different steps implicated in the generation of the matrix M2 containing target and ADE similarity information.
-
14|
Download the DrugBank database containing target information. As we have done, we recommend putting together information on the target, enzyme, transporters and carriers in a unique target database. In the construction of the target database, eliminate repeated targets present in the different databases. Eliminate other redundant information from the different databases. Specifically, we suggest that the same target belonging to different species or organisms be considered as a unique case (single target).
-
15|
Similarly to Steps 11 and 12, list the targets for each drug in the study as a vector, and calculate the target fingerprints for all the drugs. The approach is the same, but instead of considering drug interactions in each bit position you now use targets for each bit vector position. Calculate the TC and M2 as in Steps 8–10. Alternatively, use the script described in Box 2 to calculate the TC between fingerprints.
Calculation of similarity measures and TC between drugs (matrix M2): ADE fingerprints ● TIMING <1 h
▲ CRITICAL The workflow for the calculation of ADE fingerprints is detailed in Figure 7.
-
16|
Download the SIDER database (see MATERIALS), which contains information about marketed medicines and adverse drug reactions.
-
17|
Similarly to Steps 11 and 12, list the adverse reactions for each drug in the study as a vector that codifies the presence (1) or absence (0) of the adverse reactions in different bit positions. Calculate the ADE fingerprints for all the drugs included in the initial M1 according to the procedure described previously for IPFs (Steps 11–13). Calculate TC and M2 as in Steps 8–10 (or according to the directions in Box 2).
? TROUBLESHOOTING
Calculation of matrix M2 using 3D pharmacophoric shape screening ● TIMING <5 d
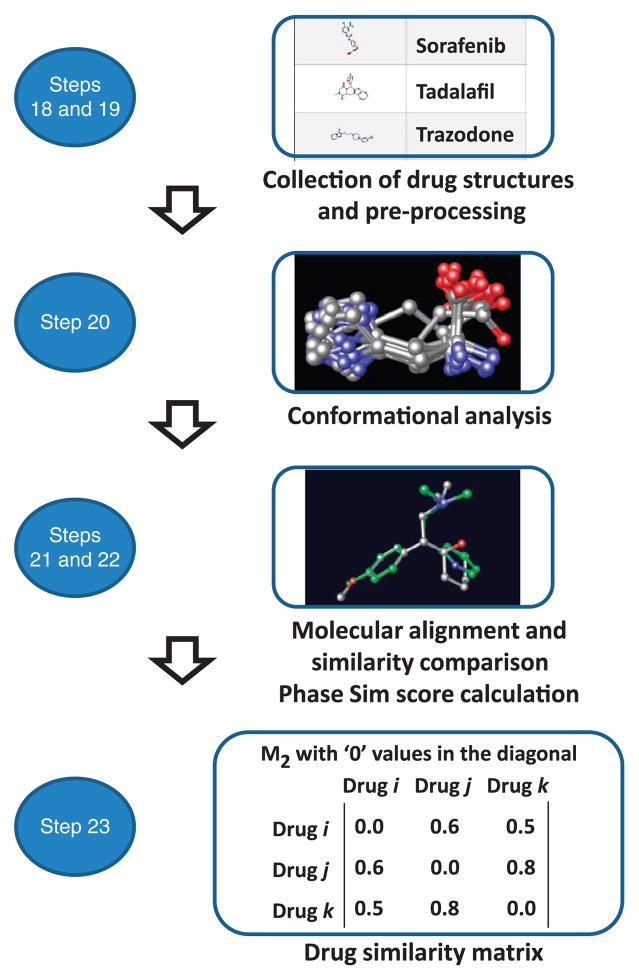
▲ CRITICAL The workflow for 3D pharmacophoric shape screening is detailed in Figure 8.
Figure 8.
Workflow of the different steps implicated in the generation of the matrix M2 containing the 3D pharmacophoric similarity information.
-
18|
Read the .sdf file previously downloaded (Step 5) with drug structure information from DrugBank using the Schrödinger package (http://www.schrodinger.com).
-
19|
Preprocess the data using the LigPrep module in Schrödinger. Select in the module the option to optimize the molecular structures with OPLS_2005 force field implemented in Schrödinger. In the LigPrep module, select the option to generate the protonation state at pH = 7.0 using ‘Ionizer’ in Schrödinger. Retain the molecule with the largest number of atoms. Retain only the specified chiralities obtained from DrugBank, generating a maximum of three enantiomers in the case of chiral centers for which absolute chirality is unknown. Save the output file as a .mae file.
▲ CRITICAL STEP Although chirality information about the bioactive conformations of drugs is provided by DrugBank, some drugs have multiple unspecified chiral centers. As the generation of all possible enantiomers could substantially increase the computational cost of subsequent steps, we recommend retaining only a maximum of three enantiomers.
? TROUBLESHOOTING
-
20|
Perform a conformational analysis for all the drugs. Select the force field and the inclusion of nonsolvent (vacuum)/ solvent (i.e., water) in the calculation. Select the nonbonded cutoff distances for hydrogen bond, van der Waals and electrostatic contributions. Choose a minimization method, convergence and number of iterations. Select the conformational search method and related parameters. As an example, Box 4 shows some parameters that can be used to run conformational analysis with the ‘Macromodel’ module from the Schrödinger package. Please note that we recommend running the conformational analysis using water as a solvent to diminish intramolecular interactions and to obtain drug conformations that are more representative of the biologically active ones than those obtained in vacuum.
? TROUBLESHOOTING
-
21|
In the output file containing the results from the conformational analysis, retain only the global minimum energy structure for each molecule as a template for the next modeling step and save the file as .mae. Please note that, although for simplicity only one conformation for molecule is taken into account as a template for the next steps of the PROCEDURE, a more complex system could be generated by considering different stable conformations for each molecule.
-
22|
Use the minimum energy structure for each molecule as a template for shape screening calculations using the Schrödinger package (Phase, version 3.3; http://www.schrodinger.com/). To run the calculation, upload to the Shape screening module the .mae database generated in Step 21 containing the calculated 3D structures of each drug (database 1). Upload the .mae file generated in Step 19 to the ‘Shape’ screening module with the molecules you want to screen (database 2). Select the pharmacophoric approach for volume scoring. Select the option to generate a maximum number of 500 conformers for each drug in the database 2 and run the calculation. The calculation will align the drug conformations in database 2 to each 3D molecular structure (templates) in the database 1 providing a similarity scoring (Phase Sim property). Save the output as a .mae file.
-
23|
Export the output from the previous step as .txt and import it in Excel. For cases in which the template structure of a drug (database 1) is compared with different enantiomers of other drugs (a maximum of three enantiomers had been generated in Step 19 for drugs with multiple undefined chiral centers) or with different protonation states, select the pair with highest 3D similarity scoring (Phase Sim property). Transform the list of drugs with the name of drug A, name of drug B and the 3D similarity scoring (Phase Sim property) into a similarity matrix M2. As an example, it is possible to list the name of the drugs in a column and in a row of an Excel worksheet, to concatenate the names in each corresponding cell of the matrix extension and to substitute the cyoncatenated names by other code (i.e., the 3D scoring in this case) using a similar script (see Excel Forum, MS Office Application Help; http://www.excelforum.com), as described in Figure 4.
Box 4. Conformational search options.
Herein are some parameters that can be used in Macromodel to carry out a conformational analysis. The use of constraints or substructures is not included. Please note that the timing of this analysis is highly dependent on the number and complexity of the molecules.
Potential
Force field: OPLS_2005
Solvent: water
No-bond cutoff distances (Å): hydrogen bond = 4.0
van der Waals = 8.0
electrostatic = 20.0
Minimization
Minimization method: PRCG (Polak-Ribiere conjugate gradient)
Maximum iterations: 500
Convergence: Gradient
Convergence threshold: 0.05
Conformational search
Conformational search method: MCMM (Monte Carlo multiple minimum)
Maximum number of steps: 1,000
Number of steps per rotatable bond: 50
Redundant conformers elimination: r.m.s.d. cutoff = 0.5 Å
Generation of the new set of potential DDIs: matrix M3 and association of the DDI effects to the list of DDI candidates ● TIMING <10 h for 5 M3 matrices
-
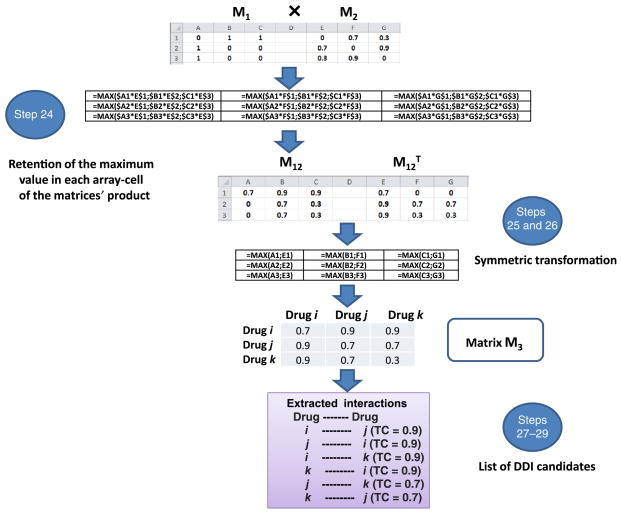
24|Multiply M1 by M2, retaining only the highest value in the array multiplication in each cell. Although in each cell in the matrix different values could be obtained from all the possible pairs for one drug, retain only the maximum value in the array cell representing the interaction with the highest TC value and the maximum similarity to a DDI in the reference standard (see Fig. 9 for more details of the process in an Excel worksheet):
-
25|
Generate the transpose matrix M12T (this matrix can be generated in Excel, transposing the M12 calculated in Step 24).
-
26|Calculate the matrix M3, retaining the maximum value in each cell of the matrix M12 and the corresponding cell in the transpose M12T matrix. M3 contains in each cell the interaction score (TC score) of the relevant drug pair (a pair constituted by the drugs reported as column and row heads of the cell reporting the mentioned score).
▲ CRITICAL STEP As M12 is not symmetric (Step 24), this step should be carried out to make sure that the interactions drugi–drugj and drugj–drugi are weighed by the same TC interaction score.
-
27|
Use the function ‘=concatenate’ in Excel to bind drugi, drugj and the TC score.
-
28|
List all the DDIs generated by the model, divide them into three columns (name of the first drug, name of the second drug and TC interaction score) and sort them in terms of decreasing TC score.
-
29|
Eliminate the candidates extracted from the matrix diagonal that represent interactions of drugs with themselves. Please note that in our example (see ANTICIPATED RESULTS), we used 928 drugs and 9,454 interactions (18,908 if including interactions i–j as well as j–i). The total number of possible DDIs generated in a matrix of 928 × 928 drugs is 860,256 ‘doubled’ DDIs (after removing 928 DDIs representing drugs’ interactions with themselves). If only unique interactions are taken into account, the total number is 430,128 DDIs.
-
30|
Associate the DDI effects from the DDI reference standard with the new potential DDIs. To perform this task, link the DDIs extracted from M3 to the initial source in M1 in terms of DrugBank drug pairs associated with the pharmacological effects caused by the interaction (Fig. 10). Through this operation, a researcher will ideally obtain a DDI multitype model that provides information not only on whether two drugs may interact but also on the possible biological effect produced by the interaction.
▲ CRITICAL STEP This step is very useful in decision-making, as all the information provided by the initial DDI source can be linked to the DDI candidate. In fact, the protocol as designed is able to point out the clinical importance of the DDI candidate based on the clinical significance of the DDI source in the DrugBank reference standard. However, an alternative option would be to introduce a weight parameter in M1 that quantifies severity, frequency or clinical importance of the DDI outcome. Implementing this option could lead to a system that prioritizes interactions with clinically important associated adverse effects over interactions with outcomes rated as not severe. For instance, some severe adverse events produced by the interactions, such as heart failure or rhabdomyolysis, could obtain a higher score by the model than effects such as muscle pain.
Figure 9.
Generation of the new set of potential DDIs (matrix M3).
Figure 10.
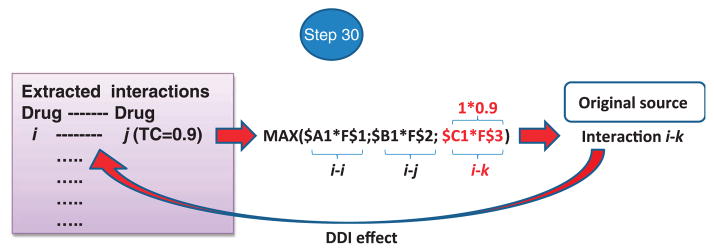
DDI effect linkage: list of DDIs extracted from M3 are associated with the initial source in M1 and with the clinical or pharmacological effects caused by the interaction.
Combining the results in a complex model ● TIMING <5 min
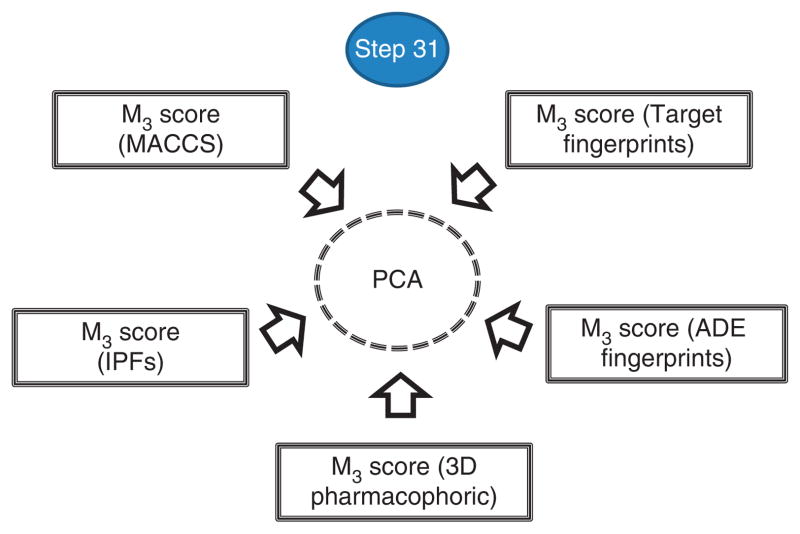
▲ CRITICAL The five DDI scores obtained through the use of five different similarity measures can be combined in a unique DDI score (Fig. 11). In this subsection of the PROCEDURE, the results of combining the five DDI scores are shown with principal component analysis (PCA) using the STATISTICA software, although other data mining, statistical techniques or software can be used to integrate the complex model.
Figure 11.
Integration of the five DDI scores into one unique score using PCA.
-
31|
Collect the information related to the five DDI scores (provided by the five M3 matrices) and save the resulting file in Excel format (.xlsx). Read the .xlsx file with STATISTICA. In the ‘factor analysis’ module, select the five variables using ‘principal components’ as the extract method, and set the number of factors that will be extracted and the minimum eigenvalue (in our example, number of factors = 1, minimum eigenvalue = 1). The calculation will generate a new and unique factor score or DDI score.
▲ CRITICAL STEP In this protocol, we direct readers to implement an unsupervised method with no labeled training data (i.e., without labeling the DDIs as positives or negatives), and to train or select the best variables that explain the data. We take this approach to try to avoid an excessive contribution to the final model by a DDI score that better performs in a training run of the PROCEDURE but that would contribute to a lesser extent to the generation of an innovative final model. The number of factors or principal components extracted from the initial variables (i.e., in our case the five DDI scores provided by the five M3 matrices (Step 31)) will depend on the data and the percentage of the variance of the initial variables (the five DDI scores) explained by each additional factor. The intention is to account for as much of the variance of the initial variables as possible using fewer components or factors. As an additional criterion, in this protocol only factors with eigenvalues >1 are retained26. In the example application covered in the present PROCEDURE, only one factor was extracted, as a second factor showed an eigenvalue lower than the preestablished cutoff (>1). A summary of the results of the actual output in the example implementation is shown below:
Factor loadings
    IPF_scoring = −0.807
    Target_scoring = −0.781
    MACCS_scoring = −0.738
    3D_scoring = −0.669
    ADE_scoring = −0.594
Eigenvalue = 2.607
% Total variance = 52.15
Assessment of the model performance: plotting the ROC curve ● TIMING <5 min
-
32|
Label the list of DDI candidates extracted from M3 (Steps 24–30). As an example, label as ‘1’ the DDIs already described in the initial reference standard DrugBank interaction database (true positives) and as ‘0’ the rest of the DDI candidates (false positives).
-
33|
Save the file produced in Step 32 as .txt, which contains the DDIs extracted from M3 (Steps 24–30), the TC (scoring associated to each interaction) and the true and false positive labels previously described.
-
34|
Import the .txt file just generated in MOE and save it in .mdb format.
-
35|
Load the roc_plot.svl script with MOE and read it at the Scientific Vector Language (SVL) command line:
svl> ROC_Plot[]
-
36|
Select the true or false positive labels as an activity field and the TC scoring variable as a prediction field.
-
37|
Plot and report the ROC results (i.e., the AUROC). Please note that the AUROC can alternatively be calculated using the open-source software R according to the directions in Box 3. The interpretation of the results from this step is provided and discussed in the ANTICIPATED RESULTS.
▲ CRITICAL STEP It is convenient to sort the candidates according to TC scoring before plotting the ROC.
? TROUBLESHOOTING
Troubleshooting advice can be found in Table 2.
TABLE 2.
Troubleshooting table.
| step | problem | possible reason | solution |
|---|---|---|---|
| 13 | Software does not calculate TCs between IPFs | IPFs are not implemented in the software | Name the field containing IPFs as an existing implemented fingerprint and calculate the TC as in Steps 8–10. The same problem can occur for target and adverse effects fingerprints An alternative script in Python, the implementation of which could solve the present problem, is provided in Box 2 |
| 17 | Different terms are used in the database to refer to the same adverse reaction No adverse effect information for some drugs included in the study |
Depending on the database used, adverse drug reactions could be repeated under different terms Data limitations |
In the SIDER database, the adverse reactions have been mapped to MEDDRA (Medical Dictionary for Regulatory Activities) terms. If data from a different database to SIDER is used, it is convenient to use MEDDRA mapping Use other adverse effects sources or assume no ADE similarity with other drugs |
| 19 | Some molecules are not preprocessed | The molecules are too large or their structures are problematic from the standpoint of force fields implemented or protonation states modules (i.e., failure to process structure as a result of unreasonable bond lengths and angles) | Increase the size of the molecule that can be analyzed using the LigPrep–ma option. Check the files ‘Jobname_*_bad.mae’, ‘Jobname-failed.ext’ or the log file to know the failure reason. If the problem persists, it is possible to use complementary software for molecule preparation |
| 20 | Time-consuming calculations or no output for some molecules | Large molecules with large numbers of atoms and torsional and/or dihedral angles Problems with the force field |
Establish a limitation in molecular size or dihedral angles Use alternative force fields |
● TIMING
Steps 1–4, generation of the reference standard DDI database (matrix M1): <4 h (timing in this part will also depend on the DDI database used as a reference standard, manageability and size extension)
Steps 5–10, generation of M2 using MACCS fingerprints: <1 h
Steps 11–13, generation of M2 using IPFs: <1 h
Steps 14 and 15, generation of M2 using target fingerprints: <1 h
Steps 16 and 17, generation of M2 using ADE fingerprints: <1 h
Steps 18–23, generation of M2 using 3D pharmacophoric approach: <5 d (depending on the number of molecules to be calculated and the potency and capacity of the computer)
Steps 24–30, generation of five DDI predictors (five M3 matrices): <10 h
Step 31, complex model generation: <5 min
Steps 32–37, ROC curves: <5 min
Box 1, using Python to calculate molecular fingerprints and TC between all drug pairs with Open Babel: <5 min
Box 2, using Python to calculate TCs between fingerprints: <5 min
Box 3, calculating AUROC via R software: <5 min
ANTICIPATED RESULTS
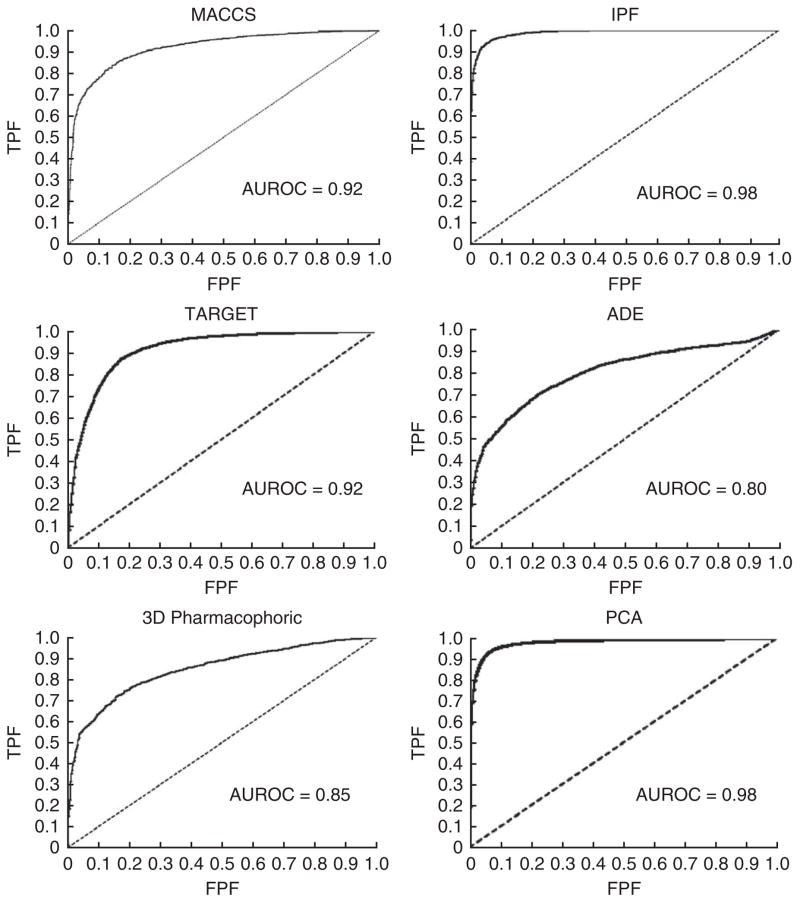
The example protocol implementation described in the PROCEDURE involves the development of a DDI predictor that uses 928 drugs and 9,454 well-established DDIs from the DrugBank database. The output of the predictor is 430,128 possible unique DDIs (= (928 × 928–928) / 2) and an associated DDI score for each of these DDIs. Among these DDI candidates are the initial 9,454 well-established DDIs retrieved by the model. The system is tested by plotting the ROC curve, considering 9,454 true positives (DrugBank interactions) and 420,674 false positives (the rest of the DDI candidates). AUROCs have values that range from 0.80 to 0.98, depending on the similarity measure used to develop the DDI predictor (see Fig. 12 for ROC curve information for the six predictors).
Figure 12.
ROC curves showing the performance of the different DDI predictors in the DrugBank database (example provided in ANTICIPATED RESULTS with 9,454 true positives and 420,674 false positives). TPF, true positive fraction; FPF, false positive fraction.
As it was shown by our research group8–10, predictors obtained by following this protocol have great stability and robustness in cross-validation sets. However, to test the predictor, it is important to evaluate the performance of the system in external and independent test sets that include DDIs not contemplated in the initial reference standard database (the DrugBank database in the present PROCEDURE). In Table 3, AUROC results for two different test data sets are reported: data from the US Department of Veterans Affairs (VA)28 and the interactions described in Drugs.com (http://www.drugs.com/) for the top 25 drugs sold in 2012.
TABLE 3.
AUROC values in test sets from the VA and Drugs.com (top 25 drugs sold in 2012).
| Predictor | VA data | Top 25 Drugs.com |
|---|---|---|
| MACCS | 0.85 | 0.68 |
| IPF | 0.87 | 0.66 |
| Target | 0.85 | 0.68 |
| ADE | 0.72 | 0.72 |
| 3D pharmacophoric | 0.72 | 0.60 |
| PCA model | 0.90 | 0.73 |
We also tested the potential of our protocol to detect differences in drug-specific interaction risks for drugs belonging to the same pharmacological category. We collected the DDIs described in the VA data for the top 25 drugs sold in 2012 (interactions not described in the initial reference standard). For each interaction, i.e., drugs i (top25)-j, we localized other drugs in the initial set in M2 with the same anatomical therapeutic chemical (ATC) code as drug j. That way we collected an enriched set of possible DDIs that are specific to the pharmacological category chosen. We calculated AUROCs for the sets considering true positives (interactions described in VA data) and false positives (interactions not described in VA data). Table 4 shows the AUROCs for the different models with different similarity measures. The protocol showed some potential to differentiate drug-specific DDI risks even in the same category of drugs. In this test, knowledge measures, such as IPFs, target fingerprints and ADE fingerprints, outperformed 2D and 3D molecular similarity measures. However, development of more complex systems with well-established DDIs and non-DDIs in the reference standard, and the use of machine learning methods, could be an alternative to implement DDI detectors covering all the pharmacological space and assessing different risk levels for drugs classified in the same pharmacological category.
Table 4.
AUROC results in the ATC code–enriched test set.
| Predictor | AUROC VA data (ATC-enriched set) |
|---|---|
| MACCS | 0.53 |
| IPF | 0.77 |
| Target | 0.64 |
| ADE | 0.71 |
| 3D pharmacophoric | 0.51 |
| PCA model | 0.67 |
Models developed through this protocol enable the researcher to extend the clinical or pharmacological effect from the DDIs in the reference standard to the new DDI candidates (Fig. 10). As an example described in a publication from our research group8, the effect associated with the DDIs retrieved in the reference standard by the MACCS model with a TC >0.75 is correct in >90% of the analyzed cases. In a study in which we used the IPF model9, we selected 100 random DDI candidates with a TC ≥ 0.7. Forty-three candidates were confirmed in Drugs.com and/or the Microemedex-Drugdex databases. The predicted effect was correct in 36 out of 43 DDIs (84%). The precision in the predicted effect will depend on the similarity measure, although similar values with other measurements are expected. The effect predicted by the system is more reliable for the top-scoring candidates, and a substantial reduction in the precision is expected as the score decreases. Results obtained by following the present protocol are dependent on the quality and comprehensiveness of the initial DDI reference standard.
Acknowledgments
This study was supported by ‘Plan Galego de Investigación, Innovación e Crecemento 2011–2015 (I2C)’, by the European Social Fund (ESF), by the Angeles Alvariño program from Xunta de Galicia (Spain) (S.V.), by a training grant from the National Heart, Lung, and Blood Institute (NHLBI) T32HL120826 (T.L.), and by a Pharmaceutical Research and Manufacturers of America (PhRMA) Foundation Research Starter Award (N.P.T.), as well as by grants R01 LM010016, R01 LM010016-0S1, R01 LM010016-0S2 and R01 LM008635 (C.F.).
Footnotes
AUTHOR CONTRIBUTIONS: S.V., C.F. and N.P.T. conceived and designed the experiments; S.V. performed the experiments; S.V. and N.P.T. analyzed the data; S.V., E.U., L.S., T.L., G.H., C.F. and N.P.T. contributed reagents/materials/analysis tools; and S.V., E.U. and N.P.T. wrote the paper.
COMPETING FINANCIAL INTERESTS: The authors declare no competing financial interests.
References
- 1.Pirmohamed M, Orme ML. Drug Interactions of Clinical Importance. Chapman & Hall; 1998. [Google Scholar]
- 2.Tatonetti NP, Fernald GH, Altman RB. A novel signal detection algorithm for identifying hidden drug-drug interactions in adverse event reports. J Am Med Inform Assoc. 2012;19:79–85. doi: 10.1136/amiajnl-2011-000214. [DOI] [PMC free article] [PubMed] [Google Scholar]
- 3.US Food and Drug Administration (FDA) [accessed April 2013]; http://www.fda.gov/
- 4.Becker ML, et al. Hospitalisations and emergency department visits due to drug-drug interactions: a literature review. Pharmacoepidemiol Drug Saf. 2007;16:641–651. doi: 10.1002/pds.1351. [DOI] [PubMed] [Google Scholar]
- 5.Bjornsson TD, et al. The conduct of in vitro and in vivo drug-drug interaction studies: a Pharmaceutical Research and Manufacturers of America (PhRMA) perspective. Drug Metab Dispos. 2003;31:815–832. doi: 10.1124/dmd.31.7.815. [DOI] [PubMed] [Google Scholar]
- 6.Vilar S, et al. Facilitating adverse drug event detection in pharmacovigilance databases using molecular structure similarity: application to rhabdomyolysis. J Am Med Inform Assoc. 2011;18:I73–I80. doi: 10.1136/amiajnl-2011-000417. [DOI] [PMC free article] [PubMed] [Google Scholar]
- 7.Vilar S, Harpaz R, Santana L, Uriarte E, Friedman C. Enhancing adverse drug event detection in electronic health records using molecular structure similarity: application to pancreatitis. PLoS ONE. 2012;7:e41471. doi: 10.1371/journal.pone.0041471. [DOI] [PMC free article] [PubMed] [Google Scholar]
- 8.Vilar S, et al. Drug-drug interaction through molecular structure similarity analysis. J Am Med Inform Assoc. 2012;19:1066–1074. doi: 10.1136/amiajnl-2012-000935. [DOI] [PMC free article] [PubMed] [Google Scholar]
- 9.Vilar S, Uriarte E, Santana L, Tatonetti NP, Friedman C. Detection of drug-drug interactions by modeling interaction profile fingerprints. PLoS ONE. 2013;8:e58321. doi: 10.1371/journal.pone.0058321. [DOI] [PMC free article] [PubMed] [Google Scholar]
- 10.Vilar S, Uriarte E, Santana L, Friedman C, Tatonetti NP. State of the art and development of a new drug-drug interaction large-scale predictor based on 3D pharmacophoric similarity. Curr Drug Metabolism. 2014;15 doi: 10.2174/138920021505141126102223. in press. [DOI] [PubMed] [Google Scholar]
- 11.Durant JL, Leland BA, Henry DR, Nourse JG. Reoptimization of MDL keys for use in drug discovery. J Chem Inf Comput Sci. 2002;42:1273–1280. doi: 10.1021/ci010132r. [DOI] [PubMed] [Google Scholar]
- 12.Liu M, et al. Large-scale prediction of adverse drug reactions using chemical, biological, and phenotypic properties of drugs. J Am Med Inform Assoc. 2012;19(e1):e28–e35. doi: 10.1136/amiajnl-2011-000699. [DOI] [PMC free article] [PubMed] [Google Scholar]
- 13.Campillos M, Kuhn M, Gavin AC, Jensen LJ, Bork P. Drug target identification using side-effect similarity. Science. 2008;321:263–266. doi: 10.1126/science.1158140. [DOI] [PubMed] [Google Scholar]
- 14.Dixon SL, et al. PHASE: a new engine for pharmacophore perception, 3D QSAR model development, and 3D database screening: 1. Methodology and preliminary results. J Comput Aided Mol Des. 2006;20:647–671. doi: 10.1007/s10822-006-9087-6. [DOI] [PubMed] [Google Scholar]
- 15.Fowler S, Zhang H. In vitro evaluation of reversible and irreversible cytochrome P450 inhibition: current status on methodologies and their utility for predicting drug-drug interactions. AAPS J. 2008;10:410–424. doi: 10.1208/s12248-008-9042-7. [DOI] [PMC free article] [PubMed] [Google Scholar]
- 16.Hudelson MG, et al. High confidence predictions of drug-drug interactions: predicting affinities for cytochrome P450 2C9 with multiple computational methods. J Med Chem. 2008;51:648–654. doi: 10.1021/jm701130z. [DOI] [PubMed] [Google Scholar]
- 17.Pang KS, Rodrigues AD, Peter RM, editors. Enzyme- and Transporter-Based Drug-Drug Interactions: Progress and Future Challenges. Springer; 2010. [Google Scholar]
- 18.Jonker DM, Visser SAG, van der Graaf PH, Voskuyl RA, Danhof M. Towards a mechanism-based analysis of pharmacodynamic drug-drug interactions in vivo. Pharmacol Ther. 2005;106:1–18. doi: 10.1016/j.pharmthera.2004.10.014. [DOI] [PubMed] [Google Scholar]
- 19.Rahnasto M, Raunio H, Poso A, Wittekindt C, Juvonen RO. Quantitative structure-activity relationship analysis of inhibitors of the nicotine metabolizing CYP2A6 enzyme. J Med Chem. 2005;48:440–449. doi: 10.1021/jm049536b. [DOI] [PubMed] [Google Scholar]
- 20.Afzelius L, et al. Competitive CYP2C9 inhibitors: enzyme inhibition studies, protein homology modeling, and three-dimensional quantitative structure-activity relationship analysis. Mol Pharmacol. 2001;59:909–919. doi: 10.1124/mol.59.4.909. [DOI] [PubMed] [Google Scholar]
- 21.De Rienzo F, Fanelli F, Menziani MC, De Benedetti PG. Theoretical investigation of substrate specificity for cytochromes p450 IA2, p450 IID6 and p450 IIIA4. J Comput Aided Mol Des. 2000;14:93–116. doi: 10.1023/a:1008187802746. [DOI] [PubMed] [Google Scholar]
- 22.Percha B, Garten Y, Altman RB. Discovery and explanation of drug-drug interactions via text mining. Pac Symp Biocomput. 2012;2012:410–421. [PMC free article] [PubMed] [Google Scholar]
- 23.Tari L, Anwar S, Liang S, Cai J, Baral C. Discovering drug-drug interactions: a text-mining and reasoning approach based on properties of drug metabolism. Bioinformatics. 2010;26:i547–i553. doi: 10.1093/bioinformatics/btq382. [DOI] [PMC free article] [PubMed] [Google Scholar]
- 24.Percha B, Altman RB. Informatics confronts drug-drug interactions. Trends Pharmacol Sci. 2013;34:178–184. doi: 10.1016/j.tips.2013.01.006. [DOI] [PMC free article] [PubMed] [Google Scholar]
- 25.Gottlieb A, Stein GY, Oron Y, Ruppin E, Sharan R. INDI: a computational framework for inferring drug interactions and their associated recommendations. Mol Syst Biol. 2012;8:592. doi: 10.1038/msb.2012.26. [DOI] [PMC free article] [PubMed] [Google Scholar]
- 26.Hill T, Lewicki P. Statistics Methods and Applications. A Comprehensive Reference for Science, Industry and Data Mining. StatSoft; 2006. [Google Scholar]
- 27.Tatonetti NP, Ye PP, Daneshjou R, Altman RB. Data-driven prediction of drug effects and interactions. Sci Transl Med. 2012;4:125ra31. doi: 10.1126/scitranslmed.3003377. [DOI] [PMC free article] [PubMed] [Google Scholar]
- 28.Olvey EL, Clauschee S, Malone DC. Comparison of critical drug-drug interaction listings: the Department of Veterans Affairs medical system and standard reference compendia. Clin Pharmacol Ther. 2010;87:48–51. doi: 10.1038/clpt.2009.198. [DOI] [PubMed] [Google Scholar]


