

Abstract
Background
Coronary artery calcification (CAC) presents unique challenges for percutaneous coronary intervention. Calcium appears as a signal-poor region with well-defined borders by FD-OCT, which might enable full quantification of CAC. The objective of this study was to demonstrate the accuracy of intravascular frequency-domain optical coherence tomography (FD-OCT) to determine distribution of CAC.
Methods and Results
Cadaveric coronary arteries were imaged using FD-OCT at 100Dm frame interval. Arteries were subsequently frozen, sectioned and imaged in their entire length at 20Dm intervals using the Case Cryo-Imaging automated system™. Full volumetric co-registration between FD-OCT and cryo-images was performed. Calcium area, distance from lumen and angle were traced on every cross-section and volumetric quantification was performed offline using a dedicated algorithm.
Thirty left anterior descending (LAD) arteries were imaged by both FD-OCT and cryo-imaging. Of these, 13 vessels had a total of 55 plaques with calcification by cryo-imaging and FD-OCT identified 47 (85%) of these plaques. Quantitative analyses of 1285 cryo-images were compared with corresponding co-registered 257 FD-OCT images. Calcium distribution, represented by the calcium-lumen distance (depth) and the mean calcium angle, was similar with excellent correlation between FD-OCT and cryo-imaging respectively (calcium-lumen distance: 0.25±0.09mm vs. 0.26±0.12mm, p=0.742; R=0.90), (mean calcium angle: 35.33±21.86° vs. 39.68±26.61°, p=0.207; R=0.88). Volumetric quantification of CAC was possible by OCT; calcium volume was underestimated in large calcifications in which the abluminal plaque border could not be well visualized (3.11±2.14mm3 vs. 4.58±3.39mm3, p=0.001) in OCT vs. cryo respectively.
Conclusion
Intravascular FD-OCT can accurately characterize CAC distribution. OCT can quantify absolute calcium volume, but may underestimate calcium burden in large plaques with poorly defined abluminal borders.
Keywords: Optical coherence tomography, Coronary artery calcification, Cryo-imaging, Percutaneous coronary intervention
INTRODUCTION
Coronary artery calcification (CAC) is an important marker of coronary disease, it is associated with cardiovascular outcomes (1–3) and remains a dreadful challenge during percutaneous coronary interventions (PCI). Calcified plaques undergoing PCI are associated with higher procedural complications and lower success compared to non-calcified lesions (4,5). Accurate identification, quantification and mapping of CAC distribution within the artery wall would be invaluable to clinicians when treating patients with advanced coronary atherosclerosis. Calcium produces a high intensity reflection with strong acoustic shadow, which limits proper assessment of CAC distribution by intravascular ultrasound (IVUS). Furthermore, the limited axial resolution (150–200 Dm) of IVUS clinical systems precludes proper determination of the depth of calcification as it relates to the arterial lumen (6). Intravascular OCT is a near infrared light-based imaging modality that provides high-resolution (axial resolution ~10–15Dm) images of the vascular wall, and has shown high accuracy and reproducibility in identifying different components of atherosclerotic plaques (7,8). Previous histology correlation studies demonstrated calcium to be associated with a sharply-delineated, signal-poor regions on time-domain (TD) OCT images, a consequence of low attenuation and low backscattering of light (7,9). The current commercially available frequency-domain OCT (FD-OCT) system (St Jude Medical, St. Paul, MN) has improved lateral resolution, and allows image acquisition with much faster pullback speed (up to 25mm/sec) compared with prior generation TD-OCT systems, which enables in vivo three-dimensional (3-D) image reconstruction and volumetric quantification in humans. Characterization of CAC using FD-OCT has yet to be validated, but calcium poses considerable challenges to histological sample preparation, which is traditionally performed using paraffin. Histological samples are often associated with artifacts, tissue shrinkage, and morphology distortions (10). In addition, the typical sampling at 1–3mm with variable slice thickness precludes proper volumetric tissue characterization and co-registration of images between two different methods. In order to overcome these methodological limitations, our group has developed a cryo-imaging system that enables fresh frozen specimen to be automatically sectioned at 20 Dm and imaged using a stereo microscope with green fluorescent protein filters (11,12). Taking advantage of cryo-imaging unique features, the present study was designed to investigate the accuracy of determination of volumetric CAC distribution by intravascular FD-OCT imaging.
METHODS
Study Design and Sample Collection
Human coronary vessels were obtained from the Cuyahoga County Examiner’s office from human cadavers within 24 hours of death. Vessels were selected according to age, gender and the presence of risk factors for atherosclerosis. Specimens were stored at 4°C prior to FD-OCT imaging. This procedure was deemed in accordance with federal, state, and local laws by the Case Institutional Review board.
FD-OCT image Acquisition
FD-OCT imaging was performed within 48 hours of death. Each vessel was mounted on a specially designed imaging rig and a plastic luer was inserted and fixed at the ostium of the coronary artery. Residual luminal blood was flushed using normal saline solution (0.9%NaCl). All major side branches were sutured using 3-O silk suturing needles. Vessels were then pressurized using optimal cutting temperature compound (Tissue Tek, Ted Pella, Inc., Redding, CA). A standard floppy 0.014″ angioplasty guidewire was inserted through the ostium and positioned in the distal part of the vessel. The FD-OCT catheter (Dragonfly™, St Jude, Minnesota) was advanced over the guidewire to the most distal part of the vessel. The FD-OCT Imaging System (C7-XR, St Jude Medical, MN) was used, and multiple image acquisitions were performed in order to image the entire artery. A pullback speed of 10.0 mm/second was used, yielding a frame interval of 100 Dm. Immediately after OCT imaging, the entire rig was filled with optimal cutting temperature gel, covered with aluminum foil, and snap frozen by placing it in a container filled with liquid nitrogen. The frozen specimen block was then stored at −80° C in preparation for cryo-imaging.
Cryo-imaging
Frozen specimens were cut to 3–5 cm blocks, and placed in the cryo-imaging system to allow equilibration to the −20° C cutting temperature. The Case cryo-imaging system has been previously described (11,12). Briefly, it consists of a modified large section cryo-microtome (8250 Large Section Cryostat, Vibratome, St. Louis, MO, U.S.A), XYZ robotic positioner carrying an imaging system which consists of a stereo microscope (SZX12, Olympus, Japan), GFP fluorescent filters (Exciter: HQ470/40x, Dichroic: Q495LP, Emitter: HQ500LP, Chroma, Rockingham, VT), low light digital camera (Retiga Exi, QImaging, Canada), and bright field light source (XCite 120PC, EXFO, Canada). The cryo-imaging system is controlled by a control computer running Labview (National Instruments, Austin, TX). The stereo microscope used an objective of 0.11 NA and a zoom setting of 12x. Once equilibrated to cutting temperature, blocks were fixed to the stage of the cryo-microtome using optimal cutting temperature compound. The specimen was then automatically sectioned at 20 Dm frame interval in its entire length, and a bright-field followed by a fluorescence image of the block face was acquired after every section, until the whole specimen was imaged.
Calcified plaque identification
FD-OCT and cryo-images were visualized and reviewed using Amira software (Mercury Computer Systems Inc., Chelmsford, MA). Proper co-registration between the two imaging modalities was performed using fiduciary marks, side branches location and plaque shapes. Calcified plaques were identified using previously well-established plaque identification criteria (Figure 1) (7,13). Vessels lacking calcification were excluded from the study analysis.
Figure 1.
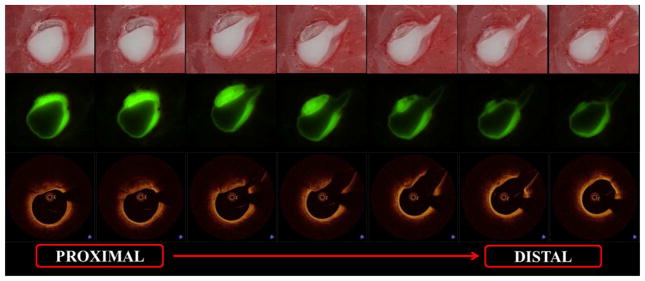
Coronary artery calcification by FD-OCT and cryo-Imaging - Consecutive bright field (1st row) and fluorescent (2nd row) cryo-images visualized with the corresponding FD-OCT images (3rd row) prior to quantification
Cryo-Image Analysis
Vessel lumen, calcium area, angle and depth were manually segmented. The segmented datasets were exported and analyzed by a Matlab-based software developed in our institution that automatically detects lumen center and measures plaque angle based on the widest pixel marked as containing calcium plaque. Plaque area was then determined for each slice, and plaque volume was calculated using Simpson’s rule.
FD-OCT analysis
FD-OCT images were analyzed at the University Hospitals Cardiovascular Imaging Core Laboratory, by an independent analyst blinded to the cryo images, using commercially available offline analysis software (Version C.0.4, St Jude Medical, St. Paul, MN). All tracings were reviewed by a second blinded analyst and a third analyst was consulted in case of disagreement. Calcium area was determined by manual segmentation following the sharply-defined edges of the signal-poor calcified region. Whenever the abluminal calcium border could not be identified, “anchor” points were positioned at the deepest identifiable side edges, and automatic software interpolation was used for determination of the calcium abluminal border. Based on this methodology, calcified plaques seen by FD-OCT were separated into two groups according to the ability to identify the abluminal calcium border (group A) or requirement to interpolate tracings in case the abluminal border is not visualized due to light attenuation in large calcifications (group B). Calcium angle was traced from the center of the lumen. Depth of calcium was defined as the distance between the luminal border of the calcific plaque to the lumen contour and was determined at 1 degree circumferential intervals (Figure 2). Calcium volume was calculated using Simpson’s Rule, using measurements from every single frame of the entire plaque.
Figure 2.

Frame level measurement of plaque calcification - Corresponding bright field (A), fluorescent (B) and FD-OCT (C) images of coronary artery calcification with corresponding cryo (D) and FD-OCT (E) measurement tracings of calcium area, angle and depth at 1 degree circumferential intervals
Statistical Analysis
Analysis was conducted using SAS 9.2 (SAS Institute Inc, Cary, NC, USA). Continuous variables are presented as mean ± SD. The difference between FD-OCT and Cryo-imaging measurements was evaluated by linear mixed-effects model with random intercept (to account for within-subject correlation) and with methodology (Cryo and FD-OCT) as fixed effects. Mixed effects model was used to estimate the correlation coefficient between measurements from two methodologies. Bland-Altman plots were used to further evaluate two measurements from Cryo and FD-OCT modalities.
RESULTS
Thirty left anterior descending (LAD) arteries were included in the study and imaged by both FD-OCT and cryo-imaging. Of these, 13 vessels had a total of 55 calcified plaques in 28 different segments identified by cryo-imaging. A total of 24,390 FD-OCT cross-sectional images were screened for the presence of CAC. FD-OCT identified 47 calcified plaques (85.4% sensitivity) in 13 vessels with co-registered vessel segments. All 47 calcified plaques seen by FD-OCT had CAC by cryo-imaging (100% specificity). A total of 8 calcified plaques were not identified by FD-OCT: 6 out of 8 plaques had superficial lipid which attenuated the light signal and prevented visualization of deeper calcium (Figure 3). Two out of 8 plaques had very small CAC which was likely missed due to 100 Dm sampling interval. Three calcified plaques identified by FD-OCT were excluded because they were partially obscured by the guidewire shadow precluding quantification. Nineteen complete calcified plaques encompassing 1285 cryo-images and 257 matched FD-OCT cross-sections were accurately co-registered and included in the study final analysis.
Figure 3.

Lipid masking human coronary artery calcification on FD-OCT - Bright field and fluorescent cryo images with corresponding OCT images showing 2 spotty calcifications (arrows in A, D and G) in the proximal coronary segment. Light attenuation caused by lipid is observed in FD-OCT images (arrowheads in H), which prevents visualization of corresponding calcification (arrowhead in B and E). Distal calcium in the same vessel is clearly visualized in both cryo and FD-OCT (arrows in C, F and I) images.
Calcium distribution
The mean depth of CAC was 0.25±0.09mm vs. 0.26±0.12mm, in OCT and cryo respectively, (p=0.742), and the mean CAC angle was 35.33±21.86° vs. 39.68±26.61°, (p=0.207) respectively (Table 1). There was also good correlation and agreement between the 2 modalities (Figure 4).
Table 1.
Comparison of calcium lumen distance, mean and maximum calcium angle and calcium volume from FD-OCT and cryo images in calcified plaques
| OCT vs. Cryo | ||||
|---|---|---|---|---|
| OCT | Cryo | Diff (OCT - Cryo) | P | |
| Mean Calcium Lumen Distance, mm | ||||
| Total (n=19) | 0.25 ± 0.09 | 0.26 ± 0.12 | −0.00 ± 0.06 | 0.742 |
| Mean Calcium Angle, degrees | ||||
| Total (n=19) | 35.33 ± 21.86 | 39.68 ± 26.61 | −4.35 ± 11.88 | 0.207 |
| Calcium Volume, mm3 | ||||
| Total (n=19) | 1.42 ± 1.86 | 1.99 ± 2.87 | −0.57 ± 1.70 | 0.150 |
| Group A(1) (n=12) | 0.43 ± 0.53 | 0.47 ± 0.64 | −0.04 ± 0.15 | 0.450 |
| Group B(2) (n=7) | 3.11 ± 2.14 | 4.58 ± 3.39 | −1.47 ± 2.68 | 0.001 |
Group A = Plaques with all calcium borders visualized on FD-OCT
Group B = Plaques with poor visualization of abluminal calcium borders by FD-OCT requiring interpolation in tracings
Figure 4.

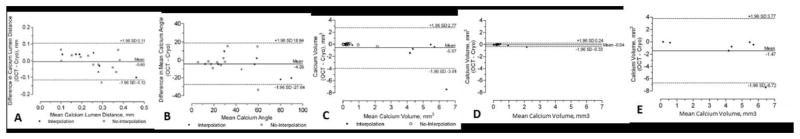
Correlations graphs (4A) and Bland-Altman plots (4B) between FD-OCT and cryo-imaging measurements of calcium-lumen distance, mean calcium angle and calcium volume – Correlation graphs and Bland-Altman plots for calcium-lumen distance (A), mean calcium angle (B), calcium volume for: the entire population (C), group A with fully visualized calcium borders (D) and group B with poor visualization of abluminal calcium border (E).
Calcium Volume determination
The abluminal calcium border was clearly identified in 12/19 plaques (63%), whereas interpolation was required to trace the entire CAC outer border in 7/19 plaques (37%). Calcium volumes were similar as measured by FD-OCT and cryo-imaging in the group with visible abluminal border (0.43 ± 0.53 mm3 vs. 0.47 ± 0.64 mm3, respectively, p=0.450). There was excellent correlation for volume determination between the 2 imaging modalities in this subgroup (R=0.989, p<0.001). FD-OCT yielded smaller calcium volumes compared to cryo-imaging when the distal border of the calcium was not visualized and interpolation in the tracings was required (3.11 ± 2.14 mm3 vs. 4.58 ± 3.39 mm3, respectively, p<0.001). There was poor correlation for calcium volume calculations between FD-OCT and cryo-imaging (R=0.593, p=0.180) when interpolation was required.
DISCUSSION
The present report provides the first validation of FD-OCT to characterize distribution of CAC in humans. The results expand on previous observations and confirm the cross-sectional and volumetric appearance of CAC as sharply-delineated, signal-poor images on FD-OCT. Our study also introduces a new methodology, namely cryo-imaging, to enable co-registration between imaging modalities and assessment of entire volumes of coronary segments (Figure 5). Using a commercially available platform to analyze FD-OCT images, we were able to perform a comprehensive geometric characterization of CAC that includes distribution (depth and angulation) as well as volumetric quantification of calcium burden. Overall, there was good agreement between FD-OCT and cryo-imaging, particularly when all borders of the calcified plaque could be delineated.
Figure 5.
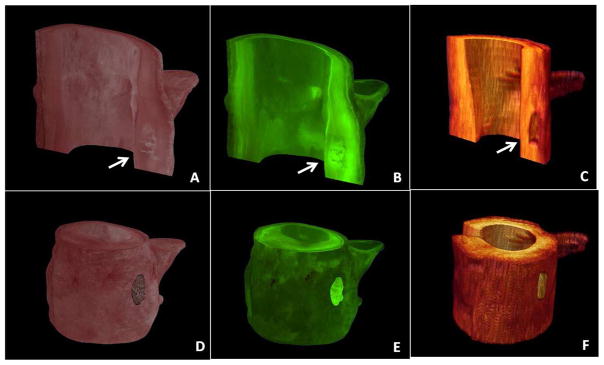
Three-dimensional reconstruction of coronary artery calcification - Bright field (A,D) and fluorescent (B,E) cryo-images visualized with the corresponding FD-OCT images (C,F). Coronary artery calcifications are seen within the arterial wall (arrows).
The ability of FD-OCT to characterize atherosclerotic plaques lies beyond a binary determination of the presence or absence of CAC. Other imaging modalities have been limited by poor spatial resolution, and high reflection (blooming) and shadowing generated by CAC (14). High spatial resolution coupled with the ability of near infrared light to penetrate calcium enabled accurate determination of the distance between the lumen surface and intramural calcification, i.e. depth of calcium, irrespective of the extent of calcification. Further, high speed imaging minimizes motion artifact and enables 3-D image reconstruction.
The presence of a calcified plaque in direct contact with the arterial lumen poses significant challenges to interventional cardiologists (4,5,15,16). Debulking technologies, such as rotational atherectomy, have been specifically developed to ablate calcium and facilitate delivery of coronary devices. In this context, the characterization of the depth of calcium within the vessel wall may have profound clinical implications. Our group and others have described the use of FD-OCT for assessment of calcium modification by debulking techniques (17–19). The present report provides fundamental scientific validation supporting a potential future role of FD-OCT to characterize calcium during coronary interventions in humans. On the other hand, our study also showed that the presence of superficial lipid within a plaque, and the subsequent light attenuation, prevented both qualitative and quantitative assessment of plaque component deeper into the vessel wall in six plaques. The clinical implication of potential underestimation of CAC in these cases is not well understood.
There was an overall good agreement between FD-OCT and cryo-imaging quantification of CAC volume and circumferential distribution. However deep, large calcified plaques required interpolation of contours based on the edges of the deepest visualized calcification. As a result, underestimation of CAC volume was observed in such plaques, which represented 37% of our study sample. Kume et al. had previously observed good correlations between prior generation TD-OCT compared to standard histology, although calcium area was underestimated by TD-OCT (20). Quantification of CAC distribution as well as volume in plaques with well-defined borders, representing 63% of the plaques analyzed, showed very high accuracy. While the present results are promising, future clinical studies are warranted to determine if better visualization and quantification of CAC by FD-OCT will ultimately improve procedural and long-term outcomes in clinical practice.
LIMITATIONS
The major limitation of the present study is the relatively small sample size. However the high number of images/frames analyzed for every plaque allowed the collection of multiple data points for parameters of interest.
CONCLUSION
Intravascular FD-OCT can accurately characterize CAC distribution, conversely absolute calcium volume in large plaques with poorly defined abluminal borders may be underestimated.
Footnotes
Disclosures: Marco A. Costa receives honoraria and research grants from St Jude Medical Inc. Hiram G. Bezerra receives honoraria and research grants from St Jude Medical Inc. Guilherme F. Attizzani receives consultant fees from St. Jude Medical Inc., David Wilson has a financial interest in BioInVision Inc., which intends to commercialize cryo-imaging. Emile Mehanna, Eric Brandt, David Prabhu, Daniel Chamié, Hirosada Yamamoto, Satoko Tahara, Nienke Van Ditzhuijzen, Yusuke Fujino, Tomoaki Kanaya, Gregory Stefano, Wei Wang, Madhushudana Gargesha do not have any conflicts of interest to declare.
References
- 1.Budoff MJ, Hokanson JE, Nasir K, et al. Progression of coronary artery calcium predicts all-cause mortality. JACC Cardiovasc Imaging. 2010;3:1229–36. doi: 10.1016/j.jcmg.2010.08.018. [DOI] [PubMed] [Google Scholar]
- 2.Graham G, Blaha MJ, Budoff MJ, et al. Impact of coronary artery calcification on all-cause mortality in individuals with and without hypertension. Atherosclerosis. 2012 doi: 10.1016/j.atherosclerosis.2012.08.014. [DOI] [PubMed] [Google Scholar]
- 3.Kondos GT, Hoff JA, Sevrukov A, et al. Electron-beam tomography coronary artery calcium and cardiac events: a 37-month follow-up of 5635 initially asymptomatic low- to intermediate-risk adults. Circulation. 2003;107:2571–6. doi: 10.1161/01.CIR.0000068341.61180.55. [DOI] [PubMed] [Google Scholar]
- 4.Fitzgerald PJ, Ports TA, Yock PG. Contribution of localized calcium deposits to dissection after angioplasty. An observational study using intravascular ultrasound. Circulation. 1992;86:64–70. doi: 10.1161/01.cir.86.1.64. [DOI] [PubMed] [Google Scholar]
- 5.Shimony A, Zahger D, Van Straten M, et al. Incidence, risk factors, management and outcomes of coronary artery perforation during percutaneous coronary intervention. Am J Cardiol. 2009;104:1674–7. doi: 10.1016/j.amjcard.2009.07.048. [DOI] [PubMed] [Google Scholar]
- 6.Garcia-Garcia HM, Costa MA, Serruys PW. Imaging of coronary atherosclerosis: intravascular ultrasound. Eur Heart J. 2010;31:2456–69. doi: 10.1093/eurheartj/ehq280. [DOI] [PubMed] [Google Scholar]
- 7.Yabushita H, Bouma BE, Houser SL, et al. Characterization of human atherosclerosis by optical coherence tomography. Circulation. 2002;106:1640–5. doi: 10.1161/01.cir.0000029927.92825.f6. [DOI] [PubMed] [Google Scholar]
- 8.Kubo T, Xu C, Wang Z, van Ditzhuijzen NS, Bezerra HG. Plaque and thrombus evaluation by optical coherence tomography. Int J Cardiovasc Imaging. 2011;27:289–98. doi: 10.1007/s10554-010-9790-1. [DOI] [PubMed] [Google Scholar]
- 9.Bezerra HG, Costa MA, Guagliumi G, Rollins AM, Simon DI. Intracoronary optical coherence tomography: a comprehensive review clinical and research applications. JACC Cardiovasc Interv. 2009;2:1035–46. doi: 10.1016/j.jcin.2009.06.019. [DOI] [PMC free article] [PubMed] [Google Scholar]
- 10.Siegel RJ, Swan K, Edwalds G, Fishbein MC. Limitations of postmortem assessment of human coronary artery size and luminal narrowing: differential effects of tissue fixation and processing on vessels with different degrees of atherosclerosis. J Am Coll Cardiol. 1985;5:342–6. doi: 10.1016/s0735-1097(85)80056-5. [DOI] [PubMed] [Google Scholar]
- 11.Roy D, Breen M, Salvado O, Heinzel M, McKinley E, Wilson D. Imaging System for Creating 3D Block-Face Cryo-Images Of Whole Mice. Proc Soc Photo Opt Instrum Eng. 2006:6143. doi: 10.1117/12.655617. nihpa112282. [DOI] [PMC free article] [PubMed] [Google Scholar]
- 12.Roy D, Steyer GJ, Gargesha M, Stone ME, Wilson DL. 3D cryo-imaging: a very high-resolution view of the whole mouse. Anat Rec (Hoboken) 2009;292:342–51. doi: 10.1002/ar.20849. [DOI] [PMC free article] [PubMed] [Google Scholar]
- 13.Nguyen MS, Salvado O, Roy D, et al. Ex vivo characterization of human atherosclerotic iliac plaque components using cryo-imaging. J Microsc. 2008;232:432–41. doi: 10.1111/j.1365-2818.2008.02138.x. [DOI] [PMC free article] [PubMed] [Google Scholar]
- 14.Kume T, Okura H, Kawamoto T, et al. Assessment of the histological characteristics of coronary arterial plaque with severe calcification. Circ J. 2007;71:643–7. doi: 10.1253/circj.71.643. [DOI] [PubMed] [Google Scholar]
- 15.Takebayashi H, Kobayashi Y, Mintz GS, et al. Intravascular ultrasound assessment of lesions with target vessel failure after sirolimus-eluting stent implantation. Am J Cardiol. 2005;95:498–502. doi: 10.1016/j.amjcard.2004.10.020. [DOI] [PubMed] [Google Scholar]
- 16.Reimers B, von Birgelen C, van der Giessen WJ, Serruys PW. A word of caution on optimizing stent deployment in calcified lesions: acute coronary rupture with cardiac tamponade. Am Heart J. 1996;131:192–4. doi: 10.1016/s0002-8703(96)90069-1. [DOI] [PubMed] [Google Scholar]
- 17.Jimenez-Valero S, Galeote G, Sanchez-Recalde A, Moreno R. Optical coherence tomography after rotational atherectomy. Rev Esp Cardiol. 2009;62:585–6. doi: 10.1016/s1885-5857(09)71847-x. [DOI] [PubMed] [Google Scholar]
- 18.Attizzani GF, Patricio L, Bezerra HG. Optical coherence tomography assessment of calcified plaque modification after rotational atherectomy. Catheter Cardiovasc Interv. 2011 doi: 10.1002/ccd.23385. [DOI] [PubMed] [Google Scholar]
- 19.Martin-Reyes R, Jimenez-Valero S, Moreno R. Effectiveness of cutting balloon angioplasty for a calcified coronary lesion. evaluation by optical coherence tomography and intravascular ultrasound. Rev Port Cardiol. 2010;29:1889–90. [PubMed] [Google Scholar]
- 20.Kume T, Okura H, Kawamoto T, et al. Assessment of the coronary calcification by optical coherence tomography. EuroIntervention. 2011;6:768–72. doi: 10.4244/EIJV6I6A130. [DOI] [PubMed] [Google Scholar]