

Abstract
Background
We previously published systematic reviews of retention in care after antiretroviral therapy initiation among general adult populations in sub-Saharan Africa. We estimated 36-month retention at 73% for publications from 2007–2010. This report extends the review to cover 2008–2013 and expands it to all low- and middle-income countries.
Methods
We searched PubMed, Embase, Cochrane Register, and ISI Web of Science from January 1, 2008 to December 31, 2013 and abstracts from AIDS and IAS from 2008–2013. We estimated retention across cohorts using simple averages and interpolated missing times through the last time reported. We estimated all-cause attrition (death, loss to follow-up) for patients receiving first-line ART in routine settings in low- and middle-income countries.
Results
We found 123 papers and abstracts reporting retention for 154 patient cohorts and 1,554,773 patients in 42 countries. Overall, 43% of all patients not retained were known to have died. Unweighted averages of reported retention was 78%, 71% and 69% at 12, 24, and 36 months after treatment initiation, respectively. We estimated 36-month retention at 65% in Africa, 80% in Asia, and 64% in Latin America and the Caribbean. From lifetable analysis, we estimated retention at 12, 24, 36, 48 and 60 months at 83%, 74%, 68%, 64% and 60%, respectively.
Conclusions
Retention at 36 months on treatment averages 65–70%. There are several important gaps in the evidence-base, which could be filled by further research, especially in terms of geographic coverage and duration of follow-up.
Keywords: retention, attrition, loss to follow-up, HIV, antiretroviral therapy, meta-analysis, systematic review, low and middle income countries
INTRODUCTION
The success of national antiretroviral therapy (ART) programs in expanding access to treatment for HIV/AIDS in low- and middle-income countries is undisputed. As of the end of 2013, some 11.7 million adults and children were estimated to be on ART1, representing almost two thirds of those eligible for ART under current guidelines2. Recent studies have observed large reductions in mortality and corresponding increases in life expectancy in some of the hardest hit countries and populations3,4.
A large and growing body of research, conducted largely since 2008, has identified poor retention in HIV care, both before and after ART initiation, as one of the most important factors in determining the overall impact of treatment. Systematic reviews of retention after ART initiation in sub-Saharan Africa, conducted by the authors in 20075 and 20106, estimated 24 month retention to average 62% in the years leading up to 2007 and 76% between 2007 and 2009. The remaining one quarter to one third of all patients initiated on treatment were either known to have died or were lost to follow-up with unknown outcomes. Of these, some unknown proportion likely “self-transferred” to another facility and remain alive and in care, a proportion estimated in a recent pooled analysis to average 18.6% of those lost to follow-up7. Still, the loss of up to a third of patients over two years—and of more in each year after that—is regarded as a threat to the sustainability of HIV treatment programs and an important target for intervention2.
Although average retention in sub-Saharan Africa appeared to improve between the two earlier reviews, there were also substantial differences in the volume and methods of the papers included. It is thus difficult to determine whether the observed difference reflect a real improvement or is merely an artifact of research. These previous reviews were limited, moreover, to general adult populations in sub-Saharan Africa through mid-2009. Current retention rates reported by the World Health Organization (WHO) vary widely between countries and regions [1], and there have been important changes in both WHO guidelines and national ART programs since 2008. In order to assist policy makers, program managers, and funding agencies in understanding and targeting their efforts, we updated and expanded the current review to estimate retention on ART among general adult populations from all low- and middle-income regions from 2008 through 2013.
METHODS
Our goal was to estimate all-cause attrition from and retention in care for adult patients receiving first-line ART in routine service delivery settings in World Bank-defined low- and middle-income countries. All-cause attrition was defined as death or loss to follow-up. When such data were reported, we excluded patients who transferred to other sites, as their outcomes are unknown. Patients who were reported as stopping treatment but remaining in care were counted as retained.
We included observational studies describing retention in HIV treatment programs published or presented in 2008 or later. We included cohorts receiving standard first-line ART at any type or level of facility that followed prevailing national treatment guidelines. We excluded clinical trials, intervention evaluations (including home-based care), and studies providing care that patients wouldn’t receive under usual practice, as indicated by each study’s authors. We included standard of care arms from studies evaluating interventions in non-randomized trials. Cohorts where ≥50% of patients were reported to be from high-risk or “key” populations—men who have sex with men, injection drug users, prisoners, female sex workers—and cohorts that limited enrollment to pregnant women, and subsets of the general population with low CD4 counts or tuberculosis were excluded; key populations will be reported on in a separate publication. Cohorts combining adults and pediatric or adolescent patients that did not stratify results by age groups were included only if over 50% were ≥18. We have reported on pediatric patients separately8.
Where multiple reports described a single cohort, we chose the one with the most complete data and/or longest follow-up. If a report described multiple cohorts, we included it only if the data could be stratified by country and there was no other report of any of the cohorts individually. If the data were disaggregated by cohort, only cohorts that were also reported in other sources were excluded. We required that studies follow patients from ART initiation to a mean or median of at least six months of follow-up. Studies had to report or provide enough information to estimate all-cause attrition (death and loss) for at least one of the following time points: 6, 12, or 18 months, or a later twelve-month interval after treatment initiation. We placed no restrictions on how cohorts assessed mortality among patients lost, but excluded studies that reported mortality but not loss to follow-up.
To identify studies, we searched PubMed, Embase, the Cochrane Register, and ISI Web of Science from January 1, 2008 to July 28, 2013 for English language publications. Within each index, we combined “antiretroviral” and any of “Africa”/“Asia”/“Central America”/“Mexico”/“South America”/“Middle East”/"Eastern Europe"/“Caribbean Region” with any of the following: “retention”/“attrition”/“adherence”/ “mortality”/“loss to follow-up”/“efficacy”/ or “evaluation.” We searched conference abstracts from AIDS and IAS conferences from 2008 to 2013 using “attrition,” “retention,” or “loss to follow-up.” (We did not search CROI as its website archives were unavailable throughout the review process.)
We then conducted three secondary searches. First, to capture journals that are not MeSH indexed, we searched again in PubMed, substituting region names with individual country names for all low an middle income countries (LMIC) for which we did not initially include at least two cohorts. Second, we searched PubMed to determine if any conference abstracts identified in the primary search had been published as full-text articles. Finally, we repeated each search in PubMed for the period from August 1, 2013 to January 9, 2014, when the database for the search was closed.
MF supervised the primary search and SR conducted the secondary searches. After excluding those whose titles were not relevant, abstracts were read to determine eligibility. Full text articles were reviewed by both authors to confirm eligibility. Uncertainties were resolved through consensus of both authors.
Statistical Analysis
For cohorts reporting retention to a particular time point (as a proportion or Kaplan-Meier estimate), retention at each point was defined as that reported by the cohort. For cohorts that didn’t report retention at specific time points but provided data on attrition (numbers of subjects lost or died), retention was defined as the proportion alive and in care and assigned to the time closest to the median follow-up.
For analysis, countries were grouped into four regions: Africa (including North Africa); Asia (including Pacific island states); Europe and Central Asia (ECA); and Latin America and the Caribbean (LAC) (including South and Central America and Caribbean island states).
Analysis of reported retention proportions
We estimated mean retention across cohorts using simple averages unweighted by sample size. As each cohort reported to different time periods, we also interpolated any missing time period possible. For example, if a cohort reported 12- and 24-month retention, we interpolated 6- and 18-month retention, assuming a linear decline between two points.
Meta-analysis of retention rates
We synthesized the data in a meta-analysis stratified by last time period reported to. We plotted each retention estimate and its 95% confidence interval (CI) using forest plots and combined estimates using a random effects regression with a Freeman and Tukey arcsine transformation9. We created a patient-level dataset for each study with all attrition occurring at the time period when it was reported. We summarized retention using Kaplan-Meier curves and estimated retention over time using lifetable analysis. We report no confidence intervals for these estimates as the sample size creates misleadingly narrow intervals.
Sensitivity analysis
We plotted mean retention by last time period reported to assess whether cohorts reporting to longer time periods were more likely to report higher retention at earlier time periods than cohorts reporting to shorter time periods. If they were, it would suggest publication bias in later years of follow-up, in that cohorts with worse retention stopped reporting after shorter durations of follow-up than those with better retention. To create upper and lower bounds on true retention, given the varying time periods reported to, we conducted a sensitivity analysis to consider the best-case, worst-case and midpoint scenarios for retention. The best-case scenario assumed no additional attrition from the last period reported to through 60 months. The worst-case scenario assumed retention continued along the same linear trend as was observed between baseline and the last time period reported. The midpoint scenario is the average of the two.
RESULTS
Our primary search identified 3517 unique articles and 6846 abstract citations; an additional 1236 articles were identified by our secondary searches. Of these, 123 met the inclusion criteria (97 articles, 26 abstracts, as depicted in Appendix 1). These studies reported on 154 patient cohorts, described in Appendix 2, and 1,554,773 patients.
A total of 42 countries were represented: 24 in Africa (114 cohorts), 10 in Asia (28 cohorts), and 8 in LAC (12 cohorts). Nearly 75% of all cohorts were from Africa. Within Africa, 24% of cohorts, about 18% of all included cohorts, were from South Africa. In Asia, nearly half of the cohorts came from India, but large cohorts from Thailand and China accounted for 68% and 22% of all patients from Asia, respectively. One third of the LAC cohorts came from Brazil and nearly half the LAC patients came from Haiti. We found no studies from the Middle East, Eastern Europe, or Central Asia reporting on general population adult cohorts. The Europe and Central Asia region (ECA) is therefore not included in the results below.
Most patients initiated ART in their early- to mid-30s, with CD4 counts well below 200 cell/mm3 (Appendix 2). Just under two thirds of patients in Africa were female, while in all other regions >50% were male. While not perfectly monotonic, there is some trend toward higher starting CD4 counts over time, with average or median CD4 counts at 113 cell/mm3 among patients initiating in 2001/2 and 154 cell/mm3 for those starting in 2009/10 (mean difference 41.2; 95%CI: 9.4 to 72.3). Most (74%) cohorts had relatively short follow-up of one or two years, while the rest reported to three or four years (20%) or longer (6%).
Attrition from each cohort by the end of that cohort’s follow-up, stratified by reason for attrition, is reported in Table 1. For cohorts that distinguished between deaths and losses (n=113), an unweighted average of 43% of patients not retained were known to have died, while the remaining 57% were lost. Definitions of loss to follow-up ranged from 1 to 12 months late for the next scheduled clinic visit and 1 to 16 months since the last clinic visit. The most common definition was to categorize patients as lost if they were ≥3 months late for a scheduled visit or did not return for >6 months after the last completed visit (definitions in Appendix 3).
Table 1.
Median follow-up and rates of patient attrition, as reported, from antiretroviral treatment programs
| Study Code | N | Median or mean follow-up (months) | Died (A) | Lost to follow-up (B) |
Total attrition from ART (C) (C=A+B) |
Total retained (D) (D=1-C) |
Transferred care (E) |
Total retained at original site (F) (F=D-E) |
|---|---|---|---|---|---|---|---|---|
| Africa | ||||||||
| Botswana 1 | 633 | 41.9 | 23.4% | 19.9% | 43.4% | 56.6% | 19.1% | 37.5% |
| Botswana 2 | 102,713 | 35.0 | 10.0% | 14.9% | 24.8% | 75.2% | 75.2% | |
| Burkina Faso 1 | 4,255 | 22.6 | 11.4% | 8.2% | 19.6% | 80.4% | 3.6% | 76.7% |
| Burkina Faso 2 | 5,608 | 23.2 | 12.8% | 7.4% | 20.2% | 79.8% | 3.7% | 76.1% |
| Burkina Faso 3 | 867 | 11.2 | 5.7% | 8.5% | 14.2% | 85.8% | 85.8% | |
| Cameroon 1 | 600 | 12.0 | 2.8% | 50.0% | 52.8% | 47.2% | 10.7% | 36.5% |
| Cameroon 2a | 330 | 12.0 | 4.5% | 30.0% | 34.5% | 65.5% | 65.5% | |
| Cameroon 2b | 295 | 12.0 | 2.4% | 13.9% | 16.3% | 83.7% | 83.7% | |
| Cameroon 3 | 1,187 | 58.0 | 35.0% | 6.1% | 41.1% | 58.9% | 18.5% | 40.4% |
| Cameroon 4 | 2,920 | 6.2 | 5.6% | 39.5% | 45.1% | 54.9% | 0.3% | 54.5% |
| Cameroon 5 | 141 | 12.0 | 9.6% | 34.6% | 44.1% | 55.9% | 3.5% | 52.3% |
| Cote d’Ivoire 1 | 1,573 | 6.0 | 9.2% | 13.1% | 22.2% | 77.8% | 1.4% | 76.4% |
| Cote d’Ivoire 2 | 10,211 | 7.7 | 11.5% | 14.0% | 25.5% | 74.5% | 3.0% | 71.5% |
| Cote d’Ivoire 3 | 3,682 | 36.0 | 12.1% | 6.9% | 19.0% | 81.0% | 81.0% | |
| Cote d’Ivoire 4 | 1,008 | |||||||
| Cote d’Ivoire 5 | 247 | 17.3 | 4.7% | 12.7% | 17.4% | 82.6% | 82.6% | |
| DRC 1 | 68 | 19.0 | 6.2% | 18.3% | 24.5% | 75.5% | 1.4% | 74.1% |
| DRC 2 | 1,450 | 16.4% | 14.9% | 31.3% | 68.7% | 1.5% | 67.2% | |
| Ethiopia 1 | 1,540 | 24.0 | 6.4% | 15.6% | 22.0% | 78.0% | 12.5% | 65.6% |
| Ethiopia 2 | 1,709 | 24.0 | 11.1% | 22.6% | 33.7% | 66.3% | 7.9% | 58.4% |
| Ethiopia 3 | 1,537 | 24.0 | 6.4% | 15.6% | 22.0% | 78.0% | 12.5% | 65.5% |
| Ethiopia 4 | 37,466 | 24.0 | ||||||
| Ethiopia 5 | 321 | 18.6% | 8.2% | 26.8% | 73.2% | 1.2% | 71.9% | |
| Ethiopia 6 | 1,428 | 17.7 | 12.8% | 15.2% | 28.0% | 72.0% | 12.0% | 60.0% |
| Gambia 1 | 308 | 12.1 | 19.6% | 3.8% | 23.4% | 76.6% | 7.1% | 69.4% |
| Ghana 1 | 3,054 | 30.0 | 7.7% | 20.4% | 28.1% | 71.9% | 71.9% | |
| Ghana 2 | 290 | 18.0 | 2.4% | 14.1% | 16.6% | 83.4% | 83.4% | |
| Ghana 3 | 91 | 36.0 | 21.7% | 8.4% | 30.1% | 69.9% | 8.8% | 61.1% |
| Guinea Bissau 1 | 2,351 | 20.5 | 10.3% | 44.1% | 54.4% | 45.6% | 3.5% | 42.1% |
| Kenya 1 | 1,307 | 9.0 | 4.2% | 14.8% | 19.1% | 80.9% | 80.9% | |
| Kenya 2a | 120 | 12.0 | 5.8% | 12.5% | 18.3% | 81.7% | 81.7% | |
| Kenya 2b | 120 | 12.0 | 0.8% | 19.2% | 20.0% | 80.0% | 80.0% | |
| Kenya 2c | 120 | 12.0 | 5.8% | 10.0% | 15.8% | 84.2% | 84.2% | |
| Kenya 3 | 830 | 18.0 | 29.4% | 29.4% | 70.6% | 70.6% | ||
| Kenya 4 | 301 | 12.0 | 5.2% | 7.6% | 12.7% | 87.3% | 3.3% | 84.0% |
| Kenya 5 | 1,676 | 3.2% | 42.5% | 45.7% | 54.3% | 6.4% | 47.9% | |
| Lesotho 1 | 3,394 | 13.0 | 3.0% | 7.0% | 10.0% | 90.0% | 90.0% | |
| Lesotho 2 | 4,064 | 12.0 | 9.3% | 2.5% | 11.8% | 88.2% | 88.2% | |
| Lesotho 3 | 3,747 | 17.4 | 11.2% | 15.0% | 26.2% | 73.8% | 73.8% | |
| Malawi 1 | 12,004 | 12.0 | ||||||
| Malawi 2a | 397 | 6.0 | ||||||
| Malawi 2b | 1,868 | 6.0 | ||||||
| Malawi 2c | 2,142 | 6.0 | ||||||
| Malawi 2d | 1,893 | 6.0 | ||||||
| Malawi 2e | 3,164 | 6.0 | ||||||
| Malawi 2f | 1,264 | 6.0 | ||||||
| Malawi 2g | 6,994 | 6.0 | ||||||
| Malawi 3 | 253,154 | |||||||
| Morocco 1 | 412 | 3.6% | 11.4% | 15.0% | 85.0% | 85.0% | ||
| Mozambique 1 | 142 | 22.2 | ||||||
| Mozambique 2 | 11,793 | 7.4 | 14.9% | 17.4% | 32.3% | 67.7% | 6.1% | 61.6% |
| Mozambique 3 | 471 | 6.0 | 16.4% | 16.4% | 83.6% | 2.8% | 80.9% | |
| Mozambique 4 | 2,005 | 24.0 | ||||||
| Mozambique 5 | 7,636 | |||||||
| Mozambique 6 | 2,596 | |||||||
| Mozambique 7 | 1,417 | 120.9 | ||||||
| Mozambique 8 | 9,692 | 13.1 | ||||||
| Nigeria 1 | 4,785 | 28.1 | 3.0% | 21.7% | 24.7% | 75.3% | 5.1% | 70.2% |
| Nigeria 2 | 1,034 | 13.8 | 3.6% | 21.2% | 24.8% | 75.2% | 0.1% | 75.1% |
| Nigeria 3 | 5,760 | 7.1 | 25.9% | 25.9% | 74.1% | 74.1% | ||
| Nigeria 4 | 12,764 | 6.0 | ||||||
| Rwanda 1 | 306 | 12.0 | 7.4% | 3.3% | 10.7% | 89.3% | 2.3% | 87.0% |
| Senegal 1 | 403 | 98.0 | 30.5% | 9.4% | 40.0% | 60.0% | 60.0% | |
| South Africa 01 | 3,162 | 28.8 | 11.8% | 20.9% | 32.7% | 67.3% | 10.3% | 57.0% |
| South Africa 02 | 47,285 | 14.8 | 6.3% | 9.5% | 15.8% | 84.2% | 84.2% | |
| South Africa 03 | 1,154 | 17.4 | 6.6% | 20.2% | 26.8% | 73.2% | 16.3% | 56.9% |
| South Africa 04 | 226 | 12.8% | 87.2% | 87.2% | ||||
| South Africa 05 | 267 | 6.0 | 7.6% | 8.0% | 15.5% | 84.5% | 1.1% | 83.3% |
| South Africa 06 | 9,102 | 12.0 | 12.9% | 14.2% | 27.1% | 72.9% | 2.1% | 70.8% |
| South Africa 07 | 735 | 12.0 | 12.1% | 14.0% | 26.1% | 73.9% | 7.9% | 66.0% |
| South Africa 08 | 2,102 | 1.9% | 15.4% | 17.3% | 82.7% | 0.3% | 82.4% | |
| South Africa 09 | 15,060 | 21.6 | 18.2% | 27.6% | 45.7% | 54.3% | 15.2% | 39.1% |
| South Africa 10 | 49,383 | |||||||
| South Africa 11 | 40,176 | 20.5 | 14.2% | 22.9% | 37.1% | 62.9% | 6.0% | 56.9% |
| South Africa 12 | 6,411 | 18.4 | 8.4% | 10.3% | 18.7% | 81.3% | 4.8% | 76.6% |
| South Africa 13 | 1,380 | 12.0 | 2.1% | 14.1% | 16.2% | 83.8% | 83.8% | |
| South Africa 14 | 1,353 | 24.0 | 9.6% | 2.7% | 12.3% | 87.7% | 4.7% | 83.0% |
| South Africa 15 | 609 | 12.0 | 18.6% | 14.6% | 33.2% | 66.8% | 66.8% | |
| South Africa 16a | 1,794 | 76.8 | 18.1% | 28.2% | 46.3% | 53.7% | 9.9% | 43.8% |
| South Africa 16b | 2,154 | 44.3 | 18.5% | 32.0% | 50.5% | 49.5% | 10.4% | 39.1% |
| South Africa 16c | 2,617 | 38.0 | 15.9% | 31.3% | 47.2% | 52.8% | 10.5% | 42.3% |
| South Africa 16d | 1,996 | 31.0 | 15.3% | 28.5% | 43.8% | 56.2% | 9.4% | 46.8% |
| South Africa 16e | 2,185 | 25.0 | 14.4% | 21.3% | 35.7% | 64.3% | 7.7% | 56.6% |
| South Africa 16f | 2,481 | 17.3 | 10.2% | 20.3% | 30.6% | 69.4% | 6.0% | 63.5% |
| South Africa 17 | 684 | 36.0 | 18.7% | 5.5% | 24.2% | 75.8% | 4.1% | 71.7% |
| South Africa 18 | 309 | 8.4 | 15.9% | 7.4% | 23.3% | 76.7% | 76.7% | |
| South Africa 19 | 2,835 | 22.0 | ||||||
| South Africa 20 | 2,817 | 24.0 | 2.0% | 11.2% | 13.2% | 86.8% | 86.8% | |
| South Africa 21 | 4,674 | 33.2 | 17.4% | 10.6% | 28.0% | 72.0% | 5.6% | 66.5% |
| South Africa 22 | 11,397 | 13.1 | 14.8% | 20.6% | 35.4% | 64.6% | 16.7% | 47.9% |
| Swaziland 1 | 769 | 12.0 | - | 17.2% | 17.2% | 82.8% | 82.8% | |
| Swaziland 2 | 2,510 | |||||||
| Tanzania 1 | 1,463 | 12.0 | 8.8% | 12.9% | 21.7% | 78.3% | 78.3% | |
| Tanzania 2 | 255,143 | 11.0% | 11.0% | 89.0% | 89.0% | |||
| Tanzania 3 | 320 | 10.9 | 33.3% | 10.9% | 44.2% | 55.8% | 10.9% | 44.9% |
| Tanzania 4 | 12,842 | 8.8 | 13.1% | 22.7% | 35.8% | 64.2% | 64.2% | |
| Tanzania 5 | 1,458 | |||||||
| Togo 1 | 16,617 | 6.0 | 1.7% | 1.7% | 98.3% | 98.3% | ||
| Uganda 1 | 399 | 12.0 | 4.3% | 17.5% | 21.8% | 78.2% | 78.2% | |
| Uganda 2 | 8,835 | 37.0 | 3.8% | 3.7% | 7.6% | 92.4% | 92.4% | |
| Uganda 3 | 3,628 | 22.9% | 22.9% | 77.1% | 77.1% | |||
| Uganda 4 | 22,315 | 31.0 | 6.7% | 6.4% | 13.1% | 86.9% | 86.9% | |
| Uganda 5 | 5,633 | 22.5 | 8.4% | 11.3% | 19.8% | 80.2% | 1.2% | 79.0% |
| Uganda 6 | 289 | 72.0 | 3.5% | 4.8% | 8.3% | 91.7% | 0.0% | 91.7% |
| Uganda 7 | 1,763 | 48.0 | 15.6% | 21.4% | 37.0% | 63.0% | 8.2% | 54.8% |
| Uganda 8 | 27,425 | |||||||
| Uganda 9 | 1,472 | |||||||
| Zambia 1 | 3,902 | 12.0 | ||||||
| Zambia 2 | 89,339 | 10.0 | 9.5% | 13.7% | 23.2% | 76.8% | 76.8% | |
| Zambia 3 | 1,084 | 11.9% | 6.4% | 18.3% | 81.7% | 6.0% | 75.8% | |
| Zambia 4 | 1,457 | |||||||
| Zimbabwe 1 | 592 | 15.2 | 9.5% | 12.3% | 21.8% | 78.2% | 78.2% | |
| Zimbabwe 2 | 3,919 | 16.3 | ||||||
| Zimbabwe 3 | 3,030 | 120.9 | ||||||
| Asia | ||||||||
| Cambodia 1 | 2,840 | 48.0 | 13.9% | 6.4% | 20.3% | 79.7% | 3.0% | 76.7% |
| Cambodia 2 | 1,010 | 30.0 | 7.2% | 8.0% | 15.2% | 84.8% | 2.0% | 82.9% |
| Cambodia 3 | 549 | 28.8 | 10.4% | 12.3% | 22.7% | 77.3% | 77.3% | |
| Cambodia 4 | 467 | 13.2 | 7.1% | 4.2% | 11.4% | 88.6% | 5.5% | 83.2% |
| China 1 | 67,732 | 20.0 | 10.9% | 14.7% | 25.6% | 74.4% | 74.4% | |
| China 2 | 1,014 | 9.0% | 2.7% | 11.6% | 88.4% | 88.4% | ||
| India 1 | 230 | 12.0 | 10.8% | 5.2% | 16.0% | 84.0% | 7.8% | 76.1% |
| India 2a | 150 | 8.1% | 14.1% | 22.2% | 77.8% | 10.0% | 67.8% | |
| India 2b | 148 | 9.5% | 21.2% | 30.7% | 69.3% | 7.4% | 61.9% | |
| India 3 | 631 | 21.0 | 13.8% | 24.8% | 38.6% | 61.4% | 11.3% | 50.2% |
| India 4 | 972 | 24.0 | 12.8% | |||||
| India 5 | 717 | 3.8% | 32.4% | 36.1% | 63.9% | 63.9% | ||
| India 6 | 239 | 41.4 | 10.0% | 43.5% | 53.6% | 46.4% | 46.4% | |
| India 7 | 142 | 44.0 | 12.0% | 12.0% | 88.0% | 88.0% | ||
| India 8a | 43 | 6.0 | 20.9% | 18.6% | 39.5% | 60.5% | 60.5% | |
| India 8b | 44 | 6.0 | 6.8% | 15.9% | 22.7% | 77.3% | 77.3% | |
| India 8c | 43 | 6.0 | 7.0% | 46.5% | 53.5% | 46.5% | 46.5% | |
| India 9 | 3,159 | 26.0 | 15.1% | 15.5% | 30.6% | 69.4% | 69.4% | |
| Indonesia | 96 | 8.2 | 19.8% | 14.3% | 34.1% | 65.9% | 5.2% | 60.7% |
| Laos 1 | 913 | 21.7 | 13.1% | 4.9% | 18.0% | 82.0% | 10.7% | 71.2% |
| Myanmar 1 | 5,963 | 36.0 | 14.3% | 6.8% | 21.0% | 79.0% | 3.5% | 75.4% |
| Nepal 1 | 1,049 | 19.1 | 14.1% | 4.6% | 18.7% | 81.3% | 18.9% | 62.4% |
| Papua New Guinea 1 | 993 | 24.0 | ||||||
| Thailand 1 | 36 | 0.0% | 0.0% | 0.0% | 100.0% | 100.0% | ||
| Thailand 2 | 213,753 | 42.0 | 9.7% | 10.6% | 20.3% | 79.7% | 79.7% | |
| Vietnam 1 | 466 | 16.5 | 8.6% | 2.1% | 10.7% | 89.3% | 89.3% | |
| Vietnam 2 | 11,432 | |||||||
| Vietnam 3 | 1,604 | |||||||
| LAC | ||||||||
| Brazil 1 | 541 | 0.4% | 5.2% | 5.5% | 94.5% | 94.5% | ||
| Brazil 2 | 516 | 0.2% | 5.4% | 5.6% | 94.4% | 94.4% | ||
| Brazil 3 | 522 | 12.0 | 3.6% | 5.2% | 8.8% | 91.2% | 91.2% | |
| Brazil 4 | 702 | 22.0 | 1.4% | 6.1% | 7.5% | 92.5% | 92.5% | |
| Dominican Republic 1 | 1,207 | 20.0 | 15.0% | 12.8% | 27.8% | 72.2% | 72.2% | |
| Guyana 1 | 25 | 72.0 | 16.7% | 16.7% | 33.3% | 66.7% | 4.0% | 62.7% |
| Haiti 1 | 4,717 | 27.0 | 12.7% | 12.8% | 25.4% | 74.6% | 74.6% | |
| Honduras 1 | 328 | 12.0 | 10.1% | 0.6% | 10.7% | 89.3% | 89.3% | |
| Jamaica 1 | 476 | 40.0 | 8.0% | 16.2% | 24.2% | 75.8% | 75.8% | |
| Nicaragua 1 | 166 | 14.4 | 21.6% | 2.0% | 23.5% | 76.5% | 8.5% | 68.0% |
| Peru 1 | 873 | 12.0 | 8.8% | 3.1% | 11.9% | 88.1% | 88.1% | |
| Peru 2 | 55 | 18.2% | 10.9% | 29.1% | 70.9% | 70.9% | ||
| All (averages) | 10,096 | 22.7 | 10.6% | 15.0% | 24.7% | 75.3% | 6.8% | 71.7% |
Retention on ART as reported
Table 2 shows retention at each time period reported to, by country. Simple average retention for select time points is plotted in Figure 1. Details are presented in Figure 2, which illustrates retention rates and 95% CIs at 12, 24, 36 and 48 months using forest plots. Simple average retention with no interpolation of missing values averaged 78% at 12 months, 71% at 24 months, and 69% at 36 months across all regions.
Table 2.
Summary of retention at specified time points after ART initiation, by country
| Country | Retained at months on ART | |||||||||
|---|---|---|---|---|---|---|---|---|---|---|
| 6 | 12 | 18 | 24 | 36 | 48 | 60 | 72 | 84 | 96 | |
| Africa | ||||||||||
| Botswana | 74% | 70% | 51% | |||||||
| Burkina Faso | 75% | 80% | ||||||||
| Cameroon | 66% | 65% | 47% | 35% | 47% | |||||
| Cote d’Ivoire | 78% | 81% | 67% | 74% | 71% | 48% | ||||
| DRC | 81% | 75% | 65% | 57% | 63% | |||||
| Ethiopia | 76% | 74% | 72% | 73% | ||||||
| Gambia | 82% | 75% | 73% | |||||||
| Ghana | 83% | 71% | ||||||||
| Guinea Bissau | 46% | |||||||||
| Kenya | 80% | 80% | 64% | 58% | 55% | 45% | 39% | 36% | ||
| Lesotho | 89% | 80% | 67% | |||||||
| Malawi | 83% | 80% | 77% | 72% | 68% | 64% | 54% | |||
| Morocco | 85% | |||||||||
| Mozambique | 83% | 72% | 65% | 56% | 51% | 60% | ||||
| Nigeria | 77% | 75% | 75% | |||||||
| Rwanda | 89% | |||||||||
| Senegal | 60% | |||||||||
| South Africa | 85% | 77% | 71% | 75% | 67% | 50% | 74% | 63% | ||
| Swaziland | 84% | 82% | 77% | 74% | 69% | 66% | ||||
| Tanzania | 82% | 68% | 64% | 61% | 56% | 49% | 38% | |||
| Togo | 98% | |||||||||
| Uganda | 88% | 83% | 86% | 76% | 79% | 69% | 57% | 92% | ||
| Zambia | 81% | 79% | 72% | 68% | 59% | 54% | ||||
| Zimbabwe | 91% | 80% | 79% | 72% | 64% | |||||
| Regional average | 82% | 76% | 71% | 69% | 67% | 57% | 61% | 64% | 37% | 60% |
| Asia | ||||||||||
| Cambodia | 89% | 77% | 85% | 80% | ||||||
| China | 94% | 91% | 87% | 86% | 76% | |||||
| India | 66% | 81% | 78% | 67% | 75% | 74% | ||||
| Indonesia | 66% | |||||||||
| Laos | 88% | |||||||||
| Myanmar | 92% | 89% | 82% | 72% | ||||||
| Nepal | 81% | |||||||||
| Papua New Guinea | 80% | 73% | 68% | 63% | ||||||
| Thailand | 100% | 80% | ||||||||
| Vietnam | 87% | 81% | 89% | 74% | 67% | 63% | ||||
| Regional average | 77% | 84% | 86% | 79% | 72% | 71% | 74% | |||
| LAC | ||||||||||
| Brazil | 94% | 91% | 92% | |||||||
| Dominican Republic | 72% | |||||||||
| Guyana | 67% | |||||||||
| Haiti | 75% | |||||||||
| Honduras | 89% | |||||||||
| Jamaica | 76% | |||||||||
| Nicaragua | 76% | |||||||||
| Peru | 79% | |||||||||
| Regional average | 94% | 85% | 74% | 84% | 76% | 67% | ||||
Figure 1.
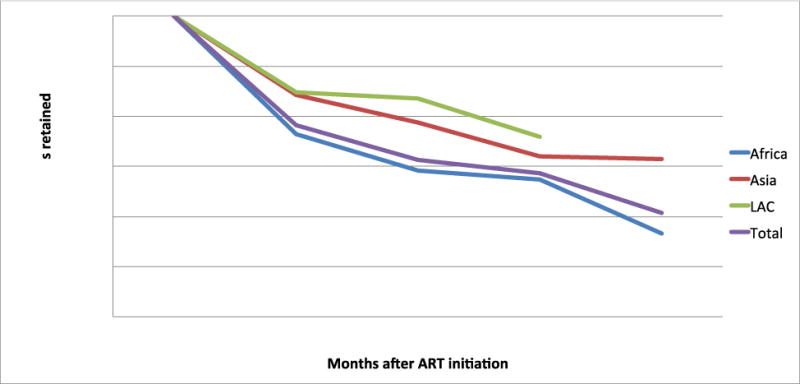
Average retention at specified time points, by region*
* Note: Y axis starts at 40%
Figure 2.
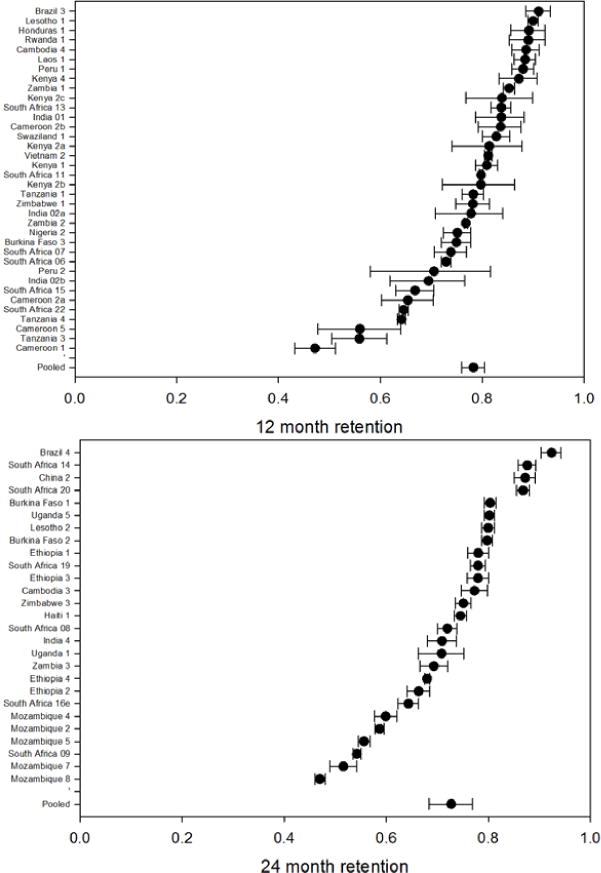
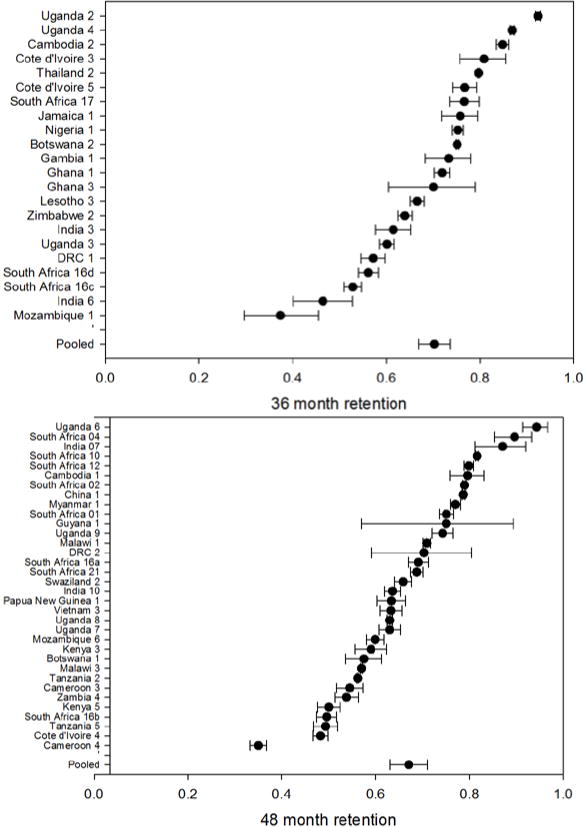
– Forest plots of retention by time period reported to at 12, 24, 36 and 48 months on ART*
* Figure of 48 month retention includes 48 month retention (sometimes interpolated) for all cohorts reporting beyond 48 months
To determine if average retention changed over calendar time, we compared attrition at 12 months in the 66 cohorts completing enrollment before 2008 to 12-month attrition in the 19 starting enrollment on or after 2008. Retention was slightly lower in the later (post-2008) cohorts, averaging 74.3% retention vs. 78.4% in earlier cohorts.
We looked for publication bias by plotting weighted average attrition by last time point reported to. Studies with shorter follow-up periods reported higher attrition at any given time point than did studies with longer follow-up (Appendix 4). Studies reporting only to 12 months, for example, retained an average of 84% of patients at 12 months, while those reporting to 36 months retained an average of 91% of patients at 12 months. This suggests some publication bias; had the studies that reported retention at 12 months continued to follow their cohorts, they would likely have had poorer 36 month retention than those that did report to 36 months.
Meta-Analysis of ART Retention
We plotted Kaplan-Meier survival curves by region (Figure 3a-d) and estimated retention by lifetable analysis. These may be regarded as the most accurate of our aggregate estimates of retention, as they take into account the full set of data available. From this analysis, we estimate 12-, 24-, 36-, 48- and 60-month retention at 83%, 74%, 68%, 64% and 60%, respectively. Asia fared better than Africa or LAC in these estimates, with 36-month retention of 80% in Asia, 65% in Africa, and 64% in LAC.
Sensitivity analysis
Both publication bias and the possibility that cohorts with resources to publish also have more resources for retaining patients suggest simple averages may overestimate true retention. On the other hand, reported loss to follow-up may overestimate true loss to care, as patients who self-transfer to other facilities are often reported as lost. We undertook a sensitivity analysis in which we modeled expected attrition under best-case, worst-case, and midpoint scenarios (Appendix 5). As we previously found for adults in sub-Saharan Africa, there is little variation among the three scenarios up to 24 months on ART. By 36 months, the difference widens, and continues to expand through 60 months. The midpoint estimate of retention at 36 months is 67%. The worst- and best-case estimates at the same time point are 62% and 72%, respectively.
DISCUSSION
This review of 154 general adult patient cohorts comprising 1,554,773 patients from 42 low- and middle-income countries published or presented from 2008 to 2013 allowed us to estimate ART retention with excellent precision. We found that adult 36 month retention averaged 65% in Africa, 80% in Asia, and 64% in Latin America and the Caribbean. Although average starting CD4 counts appear to be rising, attrition also shows some evidence of increasing over time. In considering change over time, however, it should be noted that most cohorts in this review enrolled patients under earlier, more restrictive treatment eligibility guidelines (i.e. CD4 count threshold of 200 cells/mm3 rather than the 350 threshold that is common now).
Since our first two reviews, several reviews have considered other aspects of retention and other regions or populations. These include syntheses of reasons for stopping treatment10,11 and pooled analyses of data from multiple cohorts in a region12. Quantitative results have generally been similar to ours, though several authors have noted that the definition of loss can influence estimated rates13,14. Of importance in interpreting this review is work on the ultimate outcomes of patients categorized as lost15. Studies that actively track lost patients suggest that while many have died or are untraceable, a large minority have re-initiated ART at another site (self-transferred). The term “lost to follow-up” should therefore be regarded as a catchall that includes informal self-transfers and undocumented deaths. It may over-estimate national treatment program ART attrition, while also underestimating the proportion of deaths.
Unlike our previous reviews, for which long-term data were scarce, our current review provides a robust estimate of retention beyond two years. Our lifetable results estimated overall adult retention at 83%, 74%, 68%, 64% and 60% after 12, 24, 36, 48, and 60 months on ART, respectively. We saw a steady reduction in annual attrition after 24 months, suggesting annual attrition slows but is not eliminated in later years on ART. A 2013 WHO report on low- and middle-income countries found similar 12-month retention (86%) but estimated 60-month retention at 72%2. These estimates come from 23 cohorts of ≥2000 patients, and therefore may not be representative of typical cohorts in resource-limited settings. Alternatively as the countries included do not perfectly overlap our analysis and mainly report on recent retention, they could indicate retention is highly variable over long-term follow-up. Longer follow-up in nationally representative cohorts is needed to discern the reasons for these differences.
In this review we included counties outside of sub-Saharan Africa, which allowed us to investigate regional differences in retention. We found some variation, with lifetable estimates of 36-month retention estimated at 65% in Africa, 80% in Asia, and 64% in LAC. Our review was not able to explain these differences, though they may have to do with differences in patient care-seeking behavior, socioeconomic status, experiences with the health care system, distances to the clinics or baseline disease status. We also note that although we excluded studies where >50% of patients were explicitly reported to be drawn from key populations, it is likely that cohorts in Asia and Latin America and the Caribbean, where most countries have concentrated HIV epidemics, included much larger proportions of MSM and IDU, in particular, than those from Africa. Future work is needed to define more accurately the specific populations from which study cohorts are drawn, confirm the variation between regions and populations, and to explain its implications for retention.
As noted above, we found a modest chronological trend toward increasing attrition in later years. Average 12-month retention for cohorts enrolling all patients before 2008, 78%, was higher than for cohorts that started enrolling in 2008 or later, 74%. Because the included cohorts vary widely, by location, population, and other factors, it is impossible to know whether this difference reflects a real trend toward poorer retention or is an artifact of the review. These results suggest that at a minimum, there is no broad trend toward improvement in retention over time. While our finding of increased attrition over time was not robust, it is consistent with findings from the South Africa national treatment program16 and other African treatment programs17. There are many possible explanations for this. It is possible, for example, that as programs scale up they are less able to focus on retention. It is also possible that earlier treatment initiation, as reflected in many countries’ treatment guidelines starting in 2008, is associated with less mortality but more loss to follow-up17. We note that reviews like this one cannot readily address questions of the impact of guideline changes, largely because estimates of retention are rarely reported by either calendar year or patients’ year of ART initiation. This precludes ascribing any cohort’s retention estimate to a specific time period in relation to prevailing guidelines. We encourage future cohort studies to report outcomes by year of treatment inititiation.
Our review identified some important gaps in the retention literature. Roughly 70% of all included studies were African cohorts. While our inclusion criteria covered all low- and middle-income countries, we found relatively few cohorts reporting in English outside Asia and Africa. It is understandable that a majority of research is done in Africa, which has the majority of HIV-infected individuals. We identified no studies meeting our inclusion criteria reporting on general adult populations from Europe and Central Asia. A parallel review of retention in high-risk, rather than general, populations found only one eligible study from the ECA region18. While we stratified our analysis by geographic region, both Asia and LAC had limited country variation, modest numbers of studies, and smaller cohorts. Within Africa, North Africa provided only one cohort, and most studies came from Southern or Eastern Africa, with minimal representation from Central and West Africa. Within Asia, the Middle East is missing entirely, and several very large countries (Malaysia, Pakistan, Bangladesh, Indonesia) had only one or no studies available (these countries were also absent from or poorly represented in the parallel high-risk populations review). Finally few cohorts reported retention beyond 36 months. While 12 or 24 months follow-up captures the high attrition immediately after starting treatment, it doesn’t shed light on the long-term effects of resistance, toxicities, treatment fatigue, and treatment failure, which may only develop after five years or more.
This review has several limitations. First, as noted, we identified publication bias that would be expected to overestimating retention as cohorts with worse attrition were systematically underrepresented. Second, for cohorts reporting overall retention along with median follow-up duration, we ascribed retention to the period closest to the median. This can have an unpredictable effect on estimates; in some cases it will overestimate and in others underestimate retention. Third, large cohorts (e.g. Malawi, China, Thailand) may have had overly strong influence on the results. Fourth, in cases where we calculated cohort retention, we excluded transfer patients. Cohorts that reported Kaplan-Meier analyses often censored patients at transfer, which could bias retention estimates. In addition many patients who transfer care informally are likely reported as lost. Fifth, we accepted each report’s own definition of loss to follow-up as we did not have access to primary data that would have allowed us to apply a common definition. The definition of loss to follow up certainly matters, as has been made clear by other authors13,14. It is unclear, however, how the lack of a standard definition affected our aggregate estimates, as whatever standard definition was applied would have led to some studies overestimating and some underestimating attrition. Sixth, our results, particularly retention at 6 and 12 months, could be biased by the fact that we were forced to interpolate data between time points not reported and chose linear interpolation as the best approach. While attrition is often linear after the first year on treatment, it tends not to be during the first year. For the cohorts where 6 and/or 12 month retention was interpolated, this would likely cause an overestimate of early retention. Seventh, we excluded non-English language publications, which may explain the limited data outside Asia and Africa. Eighth, some cohorts used patient tracing which could have influenced retention rates. Finally, the keywords and MeSH terms used to index publications about ART retention are not consistent across publications. As a result, it is difficult to construct searches in databases like PubMed that are both inclusive and precise.
In conclusion, we found that among 1,554,773 general population patients from low- and middle-income countries, overall retention at 12, 24 and 36 months was estimated to be 83%, 74% and 68% respectively. There appear to be substantial regional differences, with 36-month retention estimated at 65% in Africa, 80% in Asia, and 64% in LAC. As most of the reviewed cohorts came from sub-Saharan Africa, more retention data from low- and middle-income countries outside sub-Saharan Africa are needed to create a robust picture of retention throughout resource-limited settings.
Supplementary Material
Figure 3.
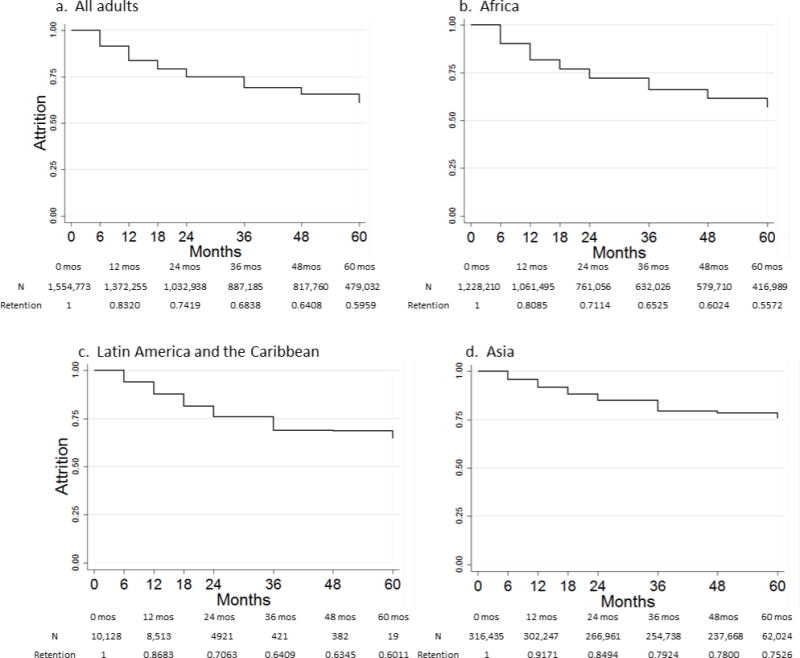
a–d Kaplan-Meir curves of time to attrition for all adults and stratified by region*
* Kaplan Meir data use interpolated estimates
Acknowledgments
This works was supported by the World Health Organization, USAID and NIH. The funders had no role in the study design, the collection, analysis, and interpretation of data, in the writing of the report, approval of the manuscript or in the decision to submit the paper for publication. The authors declare no competing interests. Matthew Fox designed the study, oversaw data collection, drafted parts of the manuscript and approved the final version. Sydney Rosen also designed the study, drafted parts of the manuscript and approved the final version. Matthew Fox had full access to all the data in the study and takes responsibility for the integrity of the data and the accuracy of the data analysis.
Footnotes
Conflict of interest and sources of funding: We declare no conflicts of interest.
References
- 1.World Health Organization. HIV/AIDS Fact Sheet N360. 2014 Available from: http://www.who.int/mediacentre/factsheets/fs360/en//. Accessed 11 December, 2014.
- 2.World Health Organization. Global update on HIV treatment 2013: results, impact and opportunities. 2013 Available: http://www.who.int/hiv/pub/progressreports/update2013/en/. Accessed 19 May, 2014.
- 3.Bor J, Herbst AJ, Newell M-L, Bärnighausen T. Increases in adult life expectancy in rural South Africa: valuing the scale-up of HIV treatment. Science. 2013;339:961–965. doi: 10.1126/science.1230413. [DOI] [PMC free article] [PubMed] [Google Scholar]
- 4.Lessells RJ, Mutevedzi PC, Iwuji CC, Newell M-L. Reduction in early mortality on antiretroviral therapy for adults in rural South Africa since change in CD4+ cell count eligibility criteria. J Acquir Immune Defic Syndr E-pub ahea. 2013 doi: 10.1097/QAI.0b013e31829ceb14. [DOI] [PMC free article] [PubMed] [Google Scholar]
- 5.Rosen S, Fox MP, Gill CJ. Patient retention in antiretroviral therapy programs in sub-Saharan Africa: a systematic review. PLoS Med. 2007;4:e298. doi: 10.1371/journal.pmed.0040298. [DOI] [PMC free article] [PubMed] [Google Scholar]
- 6.Fox MP, Rosen S. Patient retention in antiretroviral therapy programs up to three years on treatment in sub-Saharan Africa, 2007–2009: systematic review. Trop Med Int Heal. 2010;15(Suppl 1):1–15. doi: 10.1111/j.1365-3156.2010.02508.x. [DOI] [PMC free article] [PubMed] [Google Scholar]
- 7.Wilkinson LS, Skordis-Worrall J, Ajose O, Ford N. Self-transfer and mortality amongst adults lost to follow-up in ART programmes in low and middle-income countries: systematic review and meta-analysis. Trop Med Int Heal. 20142014 doi: 10.1111/tmi.12434. published ahead of print. [DOI] [PubMed] [Google Scholar]
- 8.Fox MP, Rosen S. Systematic review of retention of pediatric patients on antiretroviral therapy in low- and middle-income countries 2008–2013. AIDS. 2014 doi: 10.1097/QAD.0000000000000559. [DOI] [PubMed] [Google Scholar]
- 9.Freeman M, Tukey J. Transformations related to the angular and the square root. Ann Inst Stat Math. 1950;21:607–611. [Google Scholar]
- 10.Merten S, Kenter E, McKenzie O, Musheke M, Ntalasha H, et al. Patient-reported barriers and drivers of adherence to antiretrovirals in sub-Saharan Africa: a meta-ethnography. Trop Med Int Health. 2010;15(Suppl 1):16–33. doi: 10.1111/j.1365-3156.2010.02510.x. [DOI] [PubMed] [Google Scholar]
- 11.Ware NC, Wyatt Ma, Geng EH, Kaaya SF, Agbaji OO, et al. Toward an Understanding of disengagement from HIV treatment and care in Sub-Saharan Africa: a qualitative study. PLoS Med. 2013;10:e1001369. doi: 10.1371/journal.pmed.1001369. [DOI] [PMC free article] [PubMed] [Google Scholar]
- 12.Ekouevi DK, Balestre E, Ba-Gomis F-O, Eholie SP, Maiga M, et al. Low retention of HIV-infected patients on antiretroviral therapy in 11 clinical centres in West Africa. Trop Med Int Health. 2010;15(Suppl 1):34–42. doi: 10.1111/j.1365-3156.2010.02505.x. [DOI] [PMC free article] [PubMed] [Google Scholar]
- 13.Chi BH, Yiannoutsos CT, Westfall AO, Newman JE, Zhou J, et al. Universal definition of loss to follow-up in HIV treatment programs: a statistical analysis of 111 facilities in Africa, Asia, and Latin America. PLoS Med. 2011;9:e1001111. doi: 10.1371/journal.pmed.1001111. [DOI] [PMC free article] [PubMed] [Google Scholar]
- 14.Grimsrud AT, Cornell M, Egger M, Boulle A, Myer L. Impact of definitions of loss to follow-up (LTFU) in antiretroviral therapy program evaluation: variation in the definition can have an appreciable impact on estimated proportions of LTFU. J Clin Epidemiol. 2013 doi: 10.1016/j.jclinepi.2013.03.013. [DOI] [PMC free article] [PubMed] [Google Scholar]
- 15.Geng EH, Glidden DV, Bwana MB, Musinguzi N, Emenyonu N, et al. Retention in care and connection to care among HIV-infected patients on antiretroviral therapy in Africa: estimation via a sampling-based approach. PLoS One. 2011;6:e21797. doi: 10.1371/journal.pone.0021797. [DOI] [PMC free article] [PubMed] [Google Scholar]
- 16.Cornell M, Grimsrud A, Fairall L, Fox MP, van Cutsem G, et al. Temporal changes in programme outcomes among adult patients initiating antiretroviral therapy across South Africa, 2002–2007. AIDS. 2010;24:2002–2007. doi: 10.1097/QAD.0b013e32833d45c5. [DOI] [PMC free article] [PubMed] [Google Scholar]
- 17.Grimsrud A, Myer L, Balkan S, Casas EC, Lujan J, et al. Temporal trends in patient characteristics and outcomes from ART programmes in resource-limited settings; Abstract MOPE058, 7th International Conference on HIV Pathogenesis, Treatment and Prevention; Kuala Lumpur. 30 June–03 July 2013.2013. [Google Scholar]
- 18.Tsertsvadze T, Chkhartishvili N, Sharvadze L, Dvali N, Chokoshvili O, et al. Outcomes of Universal Access to Antiretroviral Therapy (ART) in Georgia. AIDS Res Treat. 2011;2011:621078. doi: 10.1155/2011/621078. [DOI] [PMC free article] [PubMed] [Google Scholar]
- 19.Bussmann H, Wester CW, Ndwapi N, Grundmann N, Gaolathe T, et al. Five-year outcomes of initial patients treated in Botswana’s National Antiretroviral Treatment Program. AIDS. 2008;22:2303–2311. doi: 10.1097/QAD.0b013e3283129db0. [DOI] [PMC free article] [PubMed] [Google Scholar]
- 20.Farahani M, Vable A, Lebelonyane R, Seipone K, Anderson M, et al. Outcomes of the Botswana national HIV/AIDS treatment programme from 2002 to 2010: a longitudinal analysis. Lancet Glob Heal. 2014;2:e44–e50. doi: 10.1016/S2214-109X(13)70149-9. [DOI] [PubMed] [Google Scholar]
- 21.Harries K, Zachariah R, Manzi M, Firmenich P, Mathela R, et al. Baseline characteristics, response to and outcome of antiretroviral therapy among patients with HIV-1, HIV-2 and dual infection in Burkina Faso. Trans R Soc Trop Med Hyg. 2010;104:154–161. doi: 10.1016/j.trstmh.2009.08.012. [DOI] [PubMed] [Google Scholar]
- 22.Kouanda S, Meda IB, Nikiema L, Tiendrebeogo S, Doulougou B, et al. Determinants and causes of mortality in HIV-infected patients receiving antiretroviral therapy in Burkina Faso: a five-year retrospective cohort study. AIDS Care. 2012;24:478–490. doi: 10.1080/09540121.2011.630353. [DOI] [PubMed] [Google Scholar]
- 23.Meda N, Sanou S, Dahourou D, Tiendrebeogo I, Koala C, et al. Community¬ based organizations (CBO) HIV treatment programmes in urban Burkina Faso: initial mortality and its predictors; Abstract MOPE188, 7th International Conference on HIV Pathogenesis, Treatment and Prevention; Kuala Lumpur. 30 June–03 July 2013.2013. [Google Scholar]
- 24.Abessolo Abessolo H. Application of WHO recommendations on biological monitoring of HIV-infected patients on ART in Yaoundé: it is not just matter of availability; Abstract CDD038, 6th International Conference on HIV Pathogenesis, Treatment and Prevention; Rome. 17–20 July 2011.2011. [Google Scholar]
- 25.Ngolle M. Free antiretroviral drugs contributes to reduced mortality, treatment interruptions and lost to follow up in an urban hospital in Yaoundé, Cameroon; Abstract MOPE483, 6th International Conference on HIV Pathogenesis, Treatment and Prevention; Rome. 17–20 July 2011.2011. [Google Scholar]
- 26.Sieleunou I, Souleymanou M, Schönenberger A-M, Menten J, Boelaert M. Determinants of survival in AIDS patients on antiretroviral therapy in a rural centre in the Far-North Province, Cameroon. Trop Med Int Health. 2009;14:36–43. doi: 10.1111/j.1365-3156.2008.02183.x. [DOI] [PubMed] [Google Scholar]
- 27.Mosoko JJ, Akam W, Weidle PJ, Brooks JT, Aweh AJ, et al. Retention in an antiretroviral therapy programme during an era of decreasing drug cost in Limbe, Cameroon. J Int AIDS Soc. 2011;14:32. doi: 10.1186/1758-2652-14-32. [DOI] [PMC free article] [PubMed] [Google Scholar]
- 28.Billong SC, Fokam J, Aghokeng AF, Milenge P, Kembou E, et al. Population-based monitoring of emerging HIV-1 drug resistance on antiretroviral therapy and associated factors in a sentinel site in Cameroon: low levels of resistance but poor programmatic performance. PLoS One. 2013;8:e72680. doi: 10.1371/journal.pone.0072680. [DOI] [PMC free article] [PubMed] [Google Scholar]
- 29.Messou E, Chaix M, Gabillard D, Minga A, Losina E, et al. Association between medication possession ratio, virologic failure and drug resistance in HIV-1 infected adults on antiretroviral therapy in Côte d’Ivoire. J Acquir Immune Defic Syndr. 2011;56:356–364. doi: 10.1097/QAI.0b013e3182084b5a. [DOI] [PMC free article] [PubMed] [Google Scholar]
- 30.Toure S, Kouadio B, Seyler C, Traore M, Dakoury-dogbo N, et al. Rapid scaling-up of antiretroviral therapy in 10 000 adults in Cote d’Ivoire: 2-year outcomes and determinants. AIDS. 2008;22:873–882. doi: 10.1097/QAD.0b013e3282f768f8. [DOI] [PMC free article] [PubMed] [Google Scholar]
- 31.Centers for Disease Control Differences Between HIV-Infected Men and Women in Antiretroviral Therapy Outcomes—Six African Countries, 2004–2012. Morb Mortal Wkly Rep. 2013;62:2002–2011. [PMC free article] [PubMed] [Google Scholar]
- 32.Abo Y, Minga A, Menan H, Danel C, Ouassa T, et al. Incidence of serious morbidity in HIV-infected adults on antiretroviral therapy in a West African care centre, 2003–2008. BMC Infect Dis. 2013;13:607. doi: 10.1186/1471-2334-13-607. [DOI] [PMC free article] [PubMed] [Google Scholar]
- 33.Ekouevi DK, Coffie Pa, Chaix M-L, Tonwe-Gold B, Amani-Bosse C et al. Immunological response to highly active antiretroviral therapy following treatment for prevention of mother to child transmission of HIV-1: a study in Côte d’Ivoire. J Int AIDS Soc. 2010;13:28. doi: 10.1186/1758-2652-13-28. [DOI] [PMC free article] [PubMed] [Google Scholar]
- 34.Kitenge Lubangi K. Patient retention in workplace ART programs. Case analysis of Bralima/DRC since the inception in 2002 of the HAART treatment; Abstract CDC0592, AIDS 2008 – XVII International AIDS Conference; Mexico City. 3–9 August 2008.2008. [Google Scholar]
- 35.Koole O, Kalenga L, Kiumbu M, Menten J, Ryder RW, et al. Retention in a NGO supported antiretroviral program in the Democratic Republic of Congo. PLoS One. 2012;7:e40971. doi: 10.1371/journal.pone.0040971. [DOI] [PMC free article] [PubMed] [Google Scholar]
- 36.Reda Aa, Biadgilign S, Deribew A, Gebre B, Deribe K. Predictors of change in CD4 lymphocyte count and weight among HIV infected patients on anti-retroviral treatment in Ethiopia: a retrospective longitudinal study. PLoS One. 2013;8:e58595. doi: 10.1371/journal.pone.0058595. [DOI] [PMC free article] [PubMed] [Google Scholar]
- 37.Balcha TT, Jeppsson A. Outcomes of antiretroviral treatment: a comparison between hospitals and health centers in Ethiopia. J Int Assoc Physicians AIDS Care (Chic) 2010;9:318–324. doi: 10.1177/1545109710367518. [DOI] [PubMed] [Google Scholar]
- 38.Biadgilign S, Reda Aa, Digaffe T. Predictors of mortality among HIV infected patients taking antiretroviral treatment in Ethiopia: a retrospective cohort study. AIDS Res Ther. 2012;9:15. doi: 10.1186/1742-6405-9-15. [DOI] [PMC free article] [PubMed] [Google Scholar]
- 39.Assefa Y, Kiflie A, Tesfaye D, Mariam DH, Kloos H, et al. Outcomes of antiretroviral treatment program in Ethiopia: retention of patients in care is a major challenge and varies across health facilities. BMC Health Serv Res. 2011;11:81. doi: 10.1186/1472-6963-11-81. [DOI] [PMC free article] [PubMed] [Google Scholar]
- 40.Gugsa S. Determinants of retention and mortality during 6-month follow-up after initiation of HAART in an Ethiopian public HIV treatment program; Abstract CDB0246, AIDS 2008 – XVII International AIDS Conference; Mexico City. 3–9 August 2008.2008. [Google Scholar]
- 41.Mulissa Z, Jerene D, Lindtjørn B. Patients present earlier and survival has improved, but pre-ART attrition is high in a six-year HIV cohort data from Ethiopia. PLoS One. 2010;5:e13268. doi: 10.1371/journal.pone.0013268. [DOI] [PMC free article] [PubMed] [Google Scholar]
- 42.Peterson I, Togun O, de Silva T, Oko F, Rowland-Jones S, et al. Mortality and immunovirological outcomes on antiretroviral therapy in HIV-1 and HIV-2-infected individuals in the Gambia. AIDS. 2011;25:2167–2175. doi: 10.1097/QAD.0b013e32834c4adb. [DOI] [PubMed] [Google Scholar]
- 43.Sarfo FS, Keegan R, Appiah L, Shakoor S, Phillips R, et al. High prevalence of renal dysfunction and association with risk of death amongst HIV-infected Ghanaians. J Infect. 2013;67:43–50. doi: 10.1016/j.jinf.2013.03.008. [DOI] [PubMed] [Google Scholar]
- 44.Barlow-Mosha LN, Bagenda DS, Mudiope PK, Mubiru MC, Butler LM, et al. The long-term effectiveness of generic adult fixed-dose combination antiretroviral therapy for HIV-infected Ugandan children. Afr Health Sci. 2012;12:249–258. doi: 10.4314/ahs.v12i3.2. [DOI] [PMC free article] [PubMed] [Google Scholar]
- 45.Okyere GA, Alalbil PA, Ping-Naah H, Tifere Y. Determinants of survival in adult HIV clients on Antiretroviral therapy in Lawra and Jirapa Districts of Upper West Region, Ghana. J Int Assoc Provid AIDS Care. 2013 doi: 10.1177/2325957413500531. [DOI] [PubMed] [Google Scholar]
- 46.Hønge BL, Jespersen S, Nordentoft PB, Medina C, da Silva D, et al. Loss to follow-up occurs at all stages in the diagnostic and follow-up period among HIV-infected patients in Guinea-Bissau: a 7-year retrospective cohort study. BMJ Open. 2013;3:e003499. doi: 10.1136/bmjopen-2013-003499. [DOI] [PMC free article] [PubMed] [Google Scholar]
- 47.Chung MH, Drake AL, Richardson BA, Thiga J, Sakr SR, et al. Impact of prior HAART use on clinical outcomes in a large Kenyan HIV treatment program. Curr HIV/AIDS Res. 2009;7:441–446. doi: 10.2174/157016209788680552. [DOI] [PMC free article] [PubMed] [Google Scholar]
- 48.Larson BA, Bii M, Henly-thomas S, Mccoy K, Sawe F, et al. ART treatment costs and retention in care in Kenya: a cohort study in three rural outpatient clinics. J Int AIDS Soc. 2013;16:18026. doi: 10.7448/IAS.16.1.18026. [DOI] [PMC free article] [PubMed] [Google Scholar]
- 49.Unge C, Södergård B, Ekström AM, Carter J, Waweru M, et al. Challenges for scaling up ART in a resource-limited setting: a retrospective study in Kibera, Kenya. J Acquir Immune Defic Syndr. 2009;50:397–402. doi: 10.1097/QAI.0b013e318194618e. [DOI] [PubMed] [Google Scholar]
- 50.Achieng L, Musangi H, Ong’uti S, Ombegoh E, Bryant L, et al. An observational cohort comparison of facilitators of retention in care and adherence to anti-eetroviral therapy at an HIV treatment center in Kenya. PLoS One. 2012;7:e32727. doi: 10.1371/journal.pone.0032727. [DOI] [PMC free article] [PubMed] [Google Scholar]
- 51.Ng’ang’a L. Long-term retention and predictors of loss to follow-up in an antiretroviral therapy program in an urban slum in Kenya; Abstract TUPE741, AIDS 2012-XIX International AIDS Conference; Washington DC. July 22–27 2012.2012. [Google Scholar]
- 52.Asiimwe F. Rapid scale up of an industry wide workplace ART program in Lesotho through private public partnership; Abstract MOPED030, 5th IAS Conference on HIV Pathogenesis, Treatment and Prevention; Cape Town. 19–22 July 2009.2009. [Google Scholar]
- 53.Cohen R. Nurse-driven, community-supported HIV/AIDS care and treatment: 2 year antiretroviral treatment outcomes from a primary care level programme in rural Lesotho; Abstract MOAD102, 5th IAS Conference on HIV Pathogenesis, Treatment and Prevention; Cape Town. 19–22 July 2009.2009. [Google Scholar]
- 54.Labhardt ND, Keiser O, Sello M, Lejone TI, Pfeiffer K, et al. Outcomes of antiretroviral treatment programmes in rural Lesotho: health centres and hospitals compared. J Int AIDS Soc. 2013;16:18616. doi: 10.7448/IAS.16.1.18616. [DOI] [PMC free article] [PubMed] [Google Scholar]
- 55.Rasschaert F, Koole O, Zachariah R, Lynen L, Manzi M, et al. Short and long term retention in antiretroviral care in health facilities in rural Malawi and Zimbabwe. BMC Health Serv Res. 2012;12:444. doi: 10.1186/1472-6963-12-444. [DOI] [PMC free article] [PubMed] [Google Scholar]
- 56.Le Paih M. Scale up impact on care access and early program attrition: seven years of providing ART in rural Malawi; Abstract WEAD104, 5th IAS Conference on HIV Pathogenesis, Treatment and Prevention; Cape Town. 19–22 July 2009.2009. [Google Scholar]
- 57.Jahn A. Monitoring retention and mortality in Malawi’s National ART Programme: improved outcomes with earlier treatment initiation and decentralization of services; Abstract MOAE0305, AIDS 2010-XVIII International AIDS Conference; Vienna. July 28–23 2010.2010. [Google Scholar]
- 58.Brinkhof MWG, Dabis F, Myer L, Bangsberg DR, Boulle AM, et al. Early loss of HIV-infected patients on potent antiretroviral therapy programmes in lower-income countries. Bull World Health Organ. 2008;86:559–567. doi: 10.2471/BLT.07.044248. [DOI] [PMC free article] [PubMed] [Google Scholar]
- 59.Palladino C, Briz V, Bellón JM, Bártolo I, Carvalho P, et al. Predictors of attrition and immunological failure in HIV-1 patients on highly active antiretroviral therapy from different healthcare settings in Mozambique. PLoS One. 2013;8:e82718. doi: 10.1371/journal.pone.0082718. [DOI] [PMC free article] [PubMed] [Google Scholar]
- 60.Lambdin BH, Micek Ma, Koepsell TD, Hughes JP, Sherr K, et al. Patient volume, human resource levels, and attrition from HIV Treatment programs in central Mozambique. J Acquir Immune Defic Syndr. 2011;57:33–9. doi: 10.1097/QAI.0b013e3182167e90. [DOI] [PMC free article] [PubMed] [Google Scholar]
- 61.Micek Ma, Gimbel-Sherr K, Baptista AJ, Matediana E, Montoya P, et al. Loss to follow-up of adults in public HIV care systems in central Mozambique: identifying obstacles to treatment. J Acquir Immune Defic Syndr. 2009;52:397–405. doi: 10.1097/QAI.0b013e3181ab73e2. [DOI] [PMC free article] [PubMed] [Google Scholar]
- 62.Ehmer J. Patient characteristics and antiretroviral treatment outcomes in a very rural setting in Northern Moçambique, without access to second line; Abstract CDD127, 6th International Conference on HIV Pathogenesis, Treatment and Prevention; Rome. 17–20 July 2011.2011. [Google Scholar]
- 63.Moon TD. Predictors of adult mortality and loss-to-follow-up within two years of initiation of combination antiretroviral therapy in rural Mozambique; Abstract MOPE117, AIDS 2012-XIX International AIDS Conference; Washington DC. July 22–27 2012.2012. [Google Scholar]
- 64.Wandeler G, Keiser O, Pfeiffer K, Pestilli S, Fritz C, et al. Outcomes of antiretroviral treatment programs in rural Southern Africa. J Acquir Immune Defic Syndr. 2012;59:9–16. doi: 10.1097/QAI.0b013e31823edb6a. [DOI] [PMC free article] [PubMed] [Google Scholar]
- 65.Shepherd BE, Blevins M, Vaz LME, Moon TD, Kipp AM, et al. Impact of definitions of loss to follow-up on estimates of retention, disease progression, and mortality: application to an HIV program in Mozambique. Am J Epidemiol. 2013;178:819–828. doi: 10.1093/aje/kwt030. [DOI] [PMC free article] [PubMed] [Google Scholar]
- 66.Odafe S, Idoko O, Badru T, Aiyenigba B, Suzuki C, et al. Patients’ demographic and clinical characteristics and level of care associated with lost to follow-up and mortality in adult patients on first-line ART in Nigerian hospitals. J Int AIDS Soc. 2012;15:17424. doi: 10.7448/IAS.15.2.17424. [DOI] [PMC free article] [PubMed] [Google Scholar]
- 67.Onoka Ca, Uzochukwu BS, Onwujekwe OE, Chukwuka C, Ilozumba J, et al. Retention and loss to follow-up in antiretroviral treatment programmes in southeast Nigeria. Pathog Glob Health. 2012;106:46–54. doi: 10.1179/2047773211Y.0000000018. [DOI] [PMC free article] [PubMed] [Google Scholar]
- 68.Charurat M, Oyegunle M, Benjamin R, Habib A, Eze E, et al. Patient retention and adherence to antiretrovirals in a large antiretroviral therapy program in Nigeria: a longitudinal analysis for risk factors. PLoS One. 2010;5:e10584. doi: 10.1371/journal.pone.0010584. [DOI] [PMC free article] [PubMed] [Google Scholar]
- 69.Akinwande O. Facility-level variation in outcomes among ART cohorts in Nigeria; Abstract CDD111, 6th International Conference on HIV Pathogenesis, Treatment and Prevention; Rome. 17–20 July 2011.2011. [Google Scholar]
- 70.Franke MF, Kaigamba F, Socci AR, Hakizamungu M, Patel A, et al. Improved retention associated with community-based accompaniment for antiretroviral therapy delivery in rural Rwanda. Clin Infect Dis. 2013;56:1319–1326. doi: 10.1093/cid/cis1193. [DOI] [PubMed] [Google Scholar]
- 71.Diouf A. Long-term efficacy of HAART among adult patients receiving ART in Senegal: a twelve years cohort study; Abstract CDB340 6th International Conference on HIV Pathogenesis, Treatment and Prevention; Rome. 17–20 July 2011.2011. [Google Scholar]
- 72.Nglazi MD, Lawn SD, Kaplan R, Kranzer K, Uk M, et al. Changes in programmatic outcomes during 7 years of scale-up at a community-based antiretroviral treatment service in South Africa. J Acquir Immune Defic Syndr. 2011;56:1–8. doi: 10.1097/QAI.0b013e3181ff0bdc. [DOI] [PMC free article] [PubMed] [Google Scholar]
- 73.Fatti G, Meintjes G, Shea J, Eley B, Grimwood A. Improved survival and antiretroviral treatment outcomes in adults receiving community-based adherence support: 5-year results from a multicentre cohort study in South Africa. J Acquir Immune Defic Syndr. 2012;61:50–58. doi: 10.1097/QAI.0b013e31826a6aee. [DOI] [PubMed] [Google Scholar]
- 74.Kranzer K, Lewis JJ, Ford N, Zeinecker J, Orrell C, et al. Treatment interruption in a primary care antiretroviral therapy program in South Africa: cohort analysis of trends and risk factors. J Acquir Immune Defic Syndr. 2010;55:e17–23. doi: 10.1097/QAI.0b013e3181f275fd. [DOI] [PMC free article] [PubMed] [Google Scholar]
- 75.Buhlungu N. Five year follow up of clients receiving ART in resource poor setting of Umlazi Township in South Africa; Abstract CDB0239, AIDS 2008 – XVII International AIDS Conference; Mexico City. 3–9 August 2008.2008. [Google Scholar]
- 76.Dahab M, Kielmann K, Charalambous S, Karstaedt AS, Hamilton R, et al. Contrasting reasons for discontinuation of antiretroviral therapy in workplace and public-sector HIV programs in South Africa. AIDS Patient Care STDS. 2011;25:53–59. doi: 10.1089/apc.2010.0140. [DOI] [PMC free article] [PubMed] [Google Scholar]
- 77.Innes C, Hamilton R, Hoffmann CJ, Hippner P, Fielding K, et al. A novel HIV treatment model using private practitioners in South Africa. Sex Transm Infect. 2012;88:136–140. doi: 10.1136/sextrans-2011-050194. [DOI] [PMC free article] [PubMed] [Google Scholar]
- 78.Peltzer K, Ramlagan S, Khan MS, Gaede B. The social and clinical characteristics of patients on antiretroviral therapy who are “lost to follow-up” in KwaZulu-Natal, South Africa: a prospective study. SAHARA J. 2011;8:179–186. doi: 10.1080/17290376.2011.9725002. [DOI] [PubMed] [Google Scholar]
- 79.Searle CM, et al. Using a file audit as a means of strengthening record keeping, improving quality of care & monitoring adherence at a public sector ARV site in KwaZulu-Natal, South Africa; Abstract TUPED154, 5th IAS Conference on HIV Pathogenesis, Treatment and Prevention; Cape Town. 19–22 July 2009.2009. [Google Scholar]
- 80.Hoffmann CJ, Fielding KL, Johnston V, Charalambous S, Innes C, et al. Changing predictors of mortality over time from cART start: implications for care. J Acquir Immune Defic Syndr. 2011;58:269–276. doi: 10.1097/QAI.0b013e31823219d1. [DOI] [PMC free article] [PubMed] [Google Scholar]
- 81.Osler M. Despite increased burden due to scale-up, ART programme retention remains high in the Western Cape; Abstract MOPED048, 5th IAS Conference on HIV Pathogenesis, Treatment and Prevention; Cape Town. 19–22 July 2009.2009. [Google Scholar]
- 82.Evans D, Menezes C, Mahomed K, Macdonald P, Untiedt S, et al. Treatment outcomes of HIV-Infected adolescents attending public-sector HIV clinics across Gauteng and Mpumalanga, South Africa. AIDS Res Hum Retroviruses. 2013;29:892–900. doi: 10.1089/aid.2012.0215. [DOI] [PMC free article] [PubMed] [Google Scholar]
- 83.Van Cutsem G, Ford N, Hildebrand K, Goemaere E, Mathee S, et al. Correcting for mortality among patients lost to follow up on antiretroviral therapy in South Africa: a cohort analysis. PLoS One. 2011;6:e14684. doi: 10.1371/journal.pone.0014684. [DOI] [PMC free article] [PubMed] [Google Scholar]
- 84.Clouse K, Pettifor A, Maskew M, Bassett J, Van Rie A, et al. Initiating antiretroviral therapy when presenting with higher CD4 cell counts results in reduced loss to follow-up in a resource-limited setting. AIDS. 2013;27:645–650. doi: 10.1097/QAD.0b013e32835c12f9. [DOI] [PMC free article] [PubMed] [Google Scholar]
- 85.MacPherson P, Moshabela M, Martinson N, Pronyk P. Mortality and loss to follow-up among HAART initiators in rural South Africa. Trans R Soc Trop Med Hyg. 2009;103:588–593. doi: 10.1016/j.trstmh.2008.10.001. [DOI] [PubMed] [Google Scholar]
- 86.Barth RE, van der Meer JTM, Hoepelman aIM, Schrooders Pa, van de Vijver Da, et al. Effectiveness of highly active antiretroviral therapy administered by general practitioners in rural South Africa. Eur J Clin Microbiol Infect Dis. 2008;27:977–984. doi: 10.1007/s10096-008-0534-2. [DOI] [PubMed] [Google Scholar]
- 87.Fox M, Shearer K, Maskew M, Macleod W, Majuba P, et al. Treatment outcomes after 7 years of public-sector HIV treatment. AIDS. 2012;26:1823–1828. doi: 10.1097/QAD.0b013e328357058a. [DOI] [PMC free article] [PubMed] [Google Scholar]
- 88.Khan MS. Retention and attrition of patients commenced on HAART at Ladysmith Provincial Hospital in South Africa; Abstract MOPEB045, 5th IAS Conference on HIV Pathogenesis, Treatment and Prevention; Cape Town. 19–22 July 2009.2009. [Google Scholar]
- 89.Ojikutu B, Zheng H, Walensky R, Lu Z, Losina E, et al. Predictors of mortality in patients initiating antiretroviral therapy in Durban, South Africa. South African Med J. 2008;98:204–208. [PMC free article] [PubMed] [Google Scholar]
- 90.Vella V, Govender T, Dlamini S, Taylor M, Moodley I, et al. Retrospective study on the critical factors for retaining patients on antiretroviral therapy in KwaZulu-Natal, South Africa. J Acquir Immune Defic Syndr. 2010;55:109–116. doi: 10.1097/QAI.0b013e3181e7744e. [DOI] [PubMed] [Google Scholar]
- 91.Nachega JB, Hislop M, Dowdy DW, Gallant JE, Chaisson RE, et al. Efavirenz versus nevirapine-based initial treatment of HIV infection: clinical and virological outcomes in Southern African adults. AIDS. 2008;22:2117–2125. doi: 10.1097/QAD.0b013e328310407e. [DOI] [PMC free article] [PubMed] [Google Scholar]
- 92.Mutevedzi PC, Lessells RJ, Newell M-L. Disengagement from care in a decentralised primary health care antiretroviral treatment programme: cohort study in rural South Africa. Trop Med Int Heal. 2013;18:934–941. doi: 10.1111/tmi.12135. [DOI] [PMC free article] [PubMed] [Google Scholar]
- 93.Ahonkhai Aa, Noubary F, Munro A, Stark R, Wilke M, et al. Not all are lost: interrupted laboratory monitoring, early death, and loss to follow-up (LTFU) in a large South African treatment program. PLoS One. 2012;7:e32993. doi: 10.1371/journal.pone.0032993. [DOI] [PMC free article] [PubMed] [Google Scholar]
- 94.Takuva S, Evans D, Zuma K, Okello V, Louwagie G. Comparative durability of nevirapine versus efavirenz in first-line regimens during the first year of initiating antiretroviral therapy among Swaziland HIV-infected adults. Pan Afr Med J. 2013;15:5. doi: 10.11604/pamj.2013.15.5.1889. [DOI] [PMC free article] [PubMed] [Google Scholar]
- 95.Mossdorf E, Stoeckle M, Mwaigomole EG, Chiweka E, Kibatala PL, et al. Improved antiretroviral treatment outcome in a rural African setting is associated with cART initiation at higher CD4 cell counts and better general health condition. BMC Infect Dis. 2011;11:98. doi: 10.1186/1471-2334-11-98. [DOI] [PMC free article] [PubMed] [Google Scholar]
- 96.Kilama B, Todd J, Ewings F, Josiah R, Ramadhani A, et al. Tanzanian experience: treatment outcomes after 7 years of a national public¬-driven HIV care and treatment program; Abstract TULBPE39, 7th International Conference on HIV Pathogenesis, Treatment and Prevention; Kuala Lumpur. 30 June–03 July 2013.2013. [Google Scholar]
- 97.Johannessen A, Naman E, Ngowi BJ, Sandvik L, Matee MI, et al. Predictors of mortality in HIV-infected patients starting antiretroviral therapy in a rural hospital in Tanzania. BMC Infect Dis. 2008;8:52. doi: 10.1186/1471-2334-8-52. [DOI] [PMC free article] [PubMed] [Google Scholar]
- 98.Hawkins C, Chalamilla G, Okuma J, Spiegelman D, Hertzmark E, et al. Sex differences in antiretroviral treatment outcomes among HIV-infected adults in an urban Tanzanian setting. AIDS. 2011;25:1189–1197. doi: 10.1097/QAD.0b013e3283471deb. [DOI] [PubMed] [Google Scholar]
- 99.Saka B, Landoh DE, Patassi A, d’Almeida S, Singo A, et al. Loss of HIV-infected patients on potent antiretroviral therapy programs in Togo: risk factors and the fate of these patients. Pan Afr Med J. 2013;15:35. doi: 10.11604/pamj.2013.15.35.2198. [DOI] [PMC free article] [PubMed] [Google Scholar]
- 100.Bajunirwe F, Arts EJ, Tisch DJ, King CH, Debanne SM, et al. Adherence and treatment response among HIV-1-infected adults receiving antiretroviral therapy in a rural government hospital in Southwestern Uganda. J Int Assoc Physicians AIDS Care (Chic) 2009;8:139–147. doi: 10.1177/1545109709332470. [DOI] [PubMed] [Google Scholar]
- 101.Funk A, Kanters S, Nansubuga M, Mwehire D, Featherstone A, et al. Cohort profile: the MUg Observational Cohort. Int J Epidemiol. 2012;41:1594–1594f. doi: 10.1093/ije/dys170. [DOI] [PubMed] [Google Scholar]
- 102.Mills EJ, Bakanda C, Birungi J, Mwesigwa R, Chan K, et al. Mortality by baseline CD4 cell count among HIV patients initiating antiretroviral therapy: evidence from a large cohort in Uganda. AIDS. 2011;25:851–855. doi: 10.1097/QAD.0b013e32834564e9. [DOI] [PubMed] [Google Scholar]
- 103.Kiragga AN, Castelnuovo B, Musomba R, Levin J, Kambugu A, et al. Comparison of Methods for Correction of Mortality Estimates for Loss to Follow-Up after ART Initiation: A Case of the Infectious Diseases Institute, Uganda. PLoS One. 2013;8:e83524. doi: 10.1371/journal.pone.0083524. [DOI] [PMC free article] [PubMed] [Google Scholar]
- 104.Mudiope PK, Kim S, Wabwire D, Nyende L, Bagenda D, et al. Long-term clinical and immunologic outcomes of HIV-infected women with and without previous exposure to nevirapine. Trop Med Int Health. 2013;18:344–351. doi: 10.1111/tmi.12054. [DOI] [PMC free article] [PubMed] [Google Scholar]
- 105.Burkey MD, Weiser SD, Fehmie D, Alamo-Talisuna S, Sunday P, et al. Socioeconomic determinants of mortality in HIV: evidence from a clinical cohort in Uganda. J Acquir Immune Defic Syndr. 2013 doi: 10.1097/QAI.0000000000000094. [DOI] [PMC free article] [PubMed] [Google Scholar]
- 106.Namuwenge N. Temporal trends in baseline characteristics and treatment outcomes among clients initiating antiretroviral therapy in Uganda, 2005–2010; Abstract WEPE126, AIDS 2012-XIX International AIDS Conference; Washington DC. July 22–27 2012.2012. [Google Scholar]
- 107.Torpey KE, Kabaso ME, Mutale LN, Kamanga MK, Mwango AJ, et al. Adherence support workers: a way to address human resource constraints in antiretroviral treatment programs in the public health setting in Zambia. PLoS One. 2008;3:e2204. doi: 10.1371/journal.pone.0002204. [DOI] [PMC free article] [PubMed] [Google Scholar]
- 108.Schöni-Affolter F, Keiser O, Mwango A, Stringer J, Ledergerber B, et al. Estimating loss to follow-up in HIV-infected patients on antiretroviral therapy: the effect of the competing risk of death in Zambia and Switzerland. PLoS One. 2011;6:e27919. doi: 10.1371/journal.pone.0027919. [DOI] [PMC free article] [PubMed] [Google Scholar]
- 109.Moyo C. Quality of ART services in rural Zambia after the rapid expansion of ART through task-shifting: are we providing quality care?; Abstract CDD016, 6th International Conference on HIV Pathogenesis, Treatment and Prevention; Rome. 17–20 July 2011.2011. [Google Scholar]
- 110.Bygrave H, Mtangirwa J, Ncube K, Ford N, Kranzer K, et al. Antiretroviral therapy outcomes among adolescents and youth in rural Zimbabwe. PLoS One. 2012;7:e52856. doi: 10.1371/journal.pone.0052856. [DOI] [PMC free article] [PubMed] [Google Scholar]
- 111.Mutasa-Apollo T, Shiraishi RW, Takarinda KC, Dzangare J, Mugurungi O, et al. Patient retention, clinical outcomes and attrition-associated factors of HIV-infected patients enrolled in Zimbabwe’s National Antiretroviral Therapy Programme, 2007–2010. PLoS One. 2014;9:e86305. doi: 10.1371/journal.pone.0086305. [DOI] [PMC free article] [PubMed] [Google Scholar]
- 112.Van Griensven J, Thai S. Predictors of immune recovery and the association with late mortality while on antiretroviral treatment in Cambodia. Trans R Soc Trop Med Hyg. 2011;105:694–703. doi: 10.1016/j.trstmh.2011.08.007. [DOI] [PubMed] [Google Scholar]
- 113.Argemi X, Dara S, You S, Mattei JF, Courpotin C, et al. Impact of malnutrition and social determinants on survival of HIV-infected adults starting antiretroviral therapy in resource-limited settings. AIDS. 2012;26:1161–1166. doi: 10.1097/QAD.0b013e328353f363. [DOI] [PubMed] [Google Scholar]
- 114.Morineau G, Vun MC, Barennes H, Wolf RC, Song N, et al. Survival and quality of life among HIV-positive people on antiretroviral therapy in Cambodia. AIDS Patient Care STDS. 2009;23:669–677. doi: 10.1089/apc.2008.0241. [DOI] [PubMed] [Google Scholar]
- 115.Pujades-Rodríguez M, Schramm B, Som L, Nerrienet E, Narom P, et al. Immunovirological outcomes and resistance patterns at 4 years of antiretroviral therapy use in HIV-infected patients in Cambodia. Trop Med Int Health. 2011;16:205–213. doi: 10.1111/j.1365-3156.2010.02689.x. [DOI] [PubMed] [Google Scholar]
- 116.Zhu H, Napravnik S, Eron J, Cole S, Ma Y, et al. Attrition among human immunodeficiency virus (HIV)- infected patients initiating antiretroviral therapy in China, 2003–2010. PLoS One. 2012;7:e39414. doi: 10.1371/journal.pone.0039414. [DOI] [PMC free article] [PubMed] [Google Scholar]
- 117.Spillane H, Nicholas S, Tang Z, Szumilin E, Balkan S, et al. Incidence, risk factors and causes of death in an HIV care programme with a large proportion of injecting drug users. Trop Med Int Heal. 2012;17:1255–1263. doi: 10.1111/j.1365-3156.2012.03056.x. [DOI] [PubMed] [Google Scholar]
- 118.McMahon JH, Manoharan A, Wanke C, Mammen S, Jose H, et al. Targets for intervention to improve virological outcomes for patients receiving free antiretroviral therapy in Tamil Nadu, India. AIDS Care 2014. 2013;26:559–66. doi: 10.1080/09540121.2013.845282. [DOI] [PubMed] [Google Scholar]
- 119.Hingankar NK, Thorat SR, Deshpande A, Rajasekaran S, Chandrasekar C, et al. Initial virologic response and HIV drug resistance among HIV-infected individuals initiating first-line antiretroviral therapy at 2 clinics in Chennai and Mumbai, India. Clin Infect Dis. 2012;54(Suppl 4):S348–54. doi: 10.1093/cid/cis005. [DOI] [PMC free article] [PubMed] [Google Scholar]
- 120.Tiwari BR, Karki S, Ghimire P, Sharma B, Malla S. Improvement in immunological parameters in patients receiving highly active anti-retroviral therapy in Nepal. Jpn J Infect Dis. 2013;66:252–255. doi: 10.7883/yoken.66.252. [DOI] [PubMed] [Google Scholar]
- 121.Rewari B, Raj S. Two-year treatment outcomes of the first-line antiretroviral therapy programme in India; Abstract MOPE0054, AIDS 2008 – XVII International AIDS Conference; Mexico City. 3–9 August 2008.2008. [Google Scholar]
- 122.Rai S, Mahapatra B, Sircar S, Raj PY, Venkatesh S, et al. Adherence to Antiretroviral Therapy and Its Effect on Survival of HIV-Infected Individuals in Jharkhand, India. PLoS One. 2013;8:e66860. doi: 10.1371/journal.pone.0066860. [DOI] [PMC free article] [PubMed] [Google Scholar]
- 123.Ghate M, Tripathy S, Gangakhedkar R, Thakar M, Bhattacharya J, et al. Use of first line antiretroviral therapy from a free ART programme clinic in Pune, India – a preliminary report. Indian J Med Res. 2013;137:942–949. [PMC free article] [PubMed] [Google Scholar]
- 124.Chadha S, Bhalla P, Jha AK, Gautam H, Saini S, et al. Disease progression and antiretroviral therapy in newly seropositive HIV subjects in a tertiary care hospital in North India. J Infect Dev Ctries. 2013;7:110–115. doi: 10.3855/jidc.2875. [DOI] [PubMed] [Google Scholar]
- 125.Alvarez-Uria G, Naik PK, Pakam R, Midde M. Factors associated with attrition, mortality, and loss to follow up after antiretroviral therapy initiation: data from an HIV cohort study in India. Glob Health Action. 2013;6:21682. doi: 10.3402/gha.v6i0.21682. [DOI] [PMC free article] [PubMed] [Google Scholar]
- 126.Wisaksana R, Indrati AK, Fibriani A, Rogayah E, Sudjana P, et al. Response to first-line antiretroviral treatment among human immunodeficiency virus-infected patients with and without a history of injecting drug use in Indonesia. Addiction. 2010;105:1055–1061. doi: 10.1111/j.1360-0443.2010.02898.x. [DOI] [PubMed] [Google Scholar]
- 127.Bastard M, Soulinphumy K, Phimmasone P, Saadani AH, Ciaffi L, et al. Women experience a better long-term immune recovery and a better survival on HAART in Lao People’s Democratic Republic. BMC Infect Dis. 2013;13:27. doi: 10.1186/1471-2334-13-27. [DOI] [PMC free article] [PubMed] [Google Scholar]
- 128.Sabapathy K, Ford N, Chan KN, Kyaw MK, Elema R, et al. Treatment outcomes from the largest antiretroviral treatment program in Myanmar (Burma): a cohort analysis of retention after scale-up. J Acquir Immune Defic Syndr. 2012;60:e53–62. doi: 10.1097/QAI.0b013e31824d5689. [DOI] [PubMed] [Google Scholar]
- 129.Bhatta L, Klouman E, Deuba K, Shrestha R, Karki DK, et al. Survival on antiretroviral treatment among adult HIV-infected patients in Nepal: a retrospective cohort study in far-western Region, 2006–2011. BMC Infect Dis. 2013;13:604. doi: 10.1186/1471-2334-13-604. [DOI] [PMC free article] [PubMed] [Google Scholar]
- 130.Das S, Carmone A, Franke MF, Frank D, Kiromat H, et al. Retention amongst ART patients in the highlands of Papua New Guinea: evaluating the Papua model. J Acquir Immune Defic Syndr. 2013 doi: 10.1097/QAI.0b013e3182a14f7e. [DOI] [PubMed] [Google Scholar]
- 131.Ruxrungtham K, Avihingsanon A, Pinyakorn S, Narkpaichit C, Sawasdivorn W, et al. Excellent outcomes of the Thailand national antiretroviral treatment universal coverage program in over 200,000 HIV- infected adults; Abstract MOPE175, 7th International Conference on HIV Pathogenesis, Treatment and Prevention; Kuala Lumpur. 30 June–03 July 2013.2013. [Google Scholar]
- 132.Le Y, Do N, Nguyen DB, Medland N, Cosimi L, et al. Poorer antiretroviral therapy outcomes in HIV infected injecting drug users in Vietnam; Abstract CDB0136, AIDS 2010 – XVIII International AIDS Conference; Vienna. July 28–23 2010.2010. [Google Scholar]
- 133.Duong B. Application of ART cohort analysis and HIV drug resistance early warning indicators as tools to monitor HIV/AIDS care and treatment program in Viet Nam; Abstract CDC0508, XVIII International AIDS Conference; Vienna. July 28–23 2010.2010. [Google Scholar]
- 134.Nguyen DB, Do NT, Shiraishi RW, Le YN, Tran QH, et al. Outcomes of antiretroviral therapy in Vietnam: results from a national evaluation. PLoS One. 2013;8:e55750. doi: 10.1371/journal.pone.0055750. [DOI] [PMC free article] [PubMed] [Google Scholar]
- 135.Tuboi SH, Schechter M, McGowan CC, Cesar C, Krolewiecki A, et al. Mortality during the first year of potent antiretroviral therapy in HIV-1-infected patients in 7 sites throughout Latin America and the Caribbean. J Acquir Immune Defic Syndr. 2009;51:615–623. doi: 10.1097/QAI.0b013e3181a44f0a. [DOI] [PMC free article] [PubMed] [Google Scholar]
- 136.Cardoso SW, Grinsztejn B, Velasque L, Veloso VG, Luz PM, et al. Incidence of modifying or discontinuing first HAART regimen and its determinants in a cohort of HIV-infected patients from Rio de Janeiro, Brazil. AIDS Res Hum Retroviruses. 2010;26:865–874. doi: 10.1089/aid.2009.0274. [DOI] [PubMed] [Google Scholar]
- 137.Koenig SP, Rodriguez LA, Bartholomew C, Edwards A, Carmichael TE, et al. Long-term antiretroviral treatment outcomes in seven countries in the Caribbean. J Acquir Immune Defic Syndr. 2012;59:60–71. doi: 10.1097/QAI.0b013e318245d3c1. [DOI] [PMC free article] [PubMed] [Google Scholar]
- 138.Halpern M, Lachmansingh B, Minior T, Hasbrouck LM, Persaud N, et al. Implementation of a standardized HIV patient monitoring system in Guyana. Rev Panam Salud Publica. 2010;28:107–113. doi: 10.1590/s1020-49892010000800006. [DOI] [PubMed] [Google Scholar]
- 139.Shakir F. Early mortality of HIV-patients on ART from a low-prevalence country in Latin America: results from Nicaragua; Abstract THPE0417, AIDS 2010 – XVIII International AIDS Conference; Vienna. July 28–23 2010.2010. [Google Scholar]
- 140.Muñoz M, Finnegan K, Zeladita J, Caldas A, Sanchez E, et al. Community-based DOT-HAART accompaniment in an urban resource-poor setting. AIDS Behav. 2010;14:721–730. doi: 10.1007/s10461-009-9559-5. [DOI] [PMC free article] [PubMed] [Google Scholar]
Associated Data
This section collects any data citations, data availability statements, or supplementary materials included in this article.