

Abstract
Apnea is nearly universal among very low birth weight (VLBW) infants, and the associated bradycardia and desaturation may have detrimental consequences. We describe here very long (>60 s) central apnea events (VLAs) with bradycardia and desaturation, discovered using a computerized detection system applied to our database of over 100 infant years of electronic signals. Eighty-six VLAs occurred in 29 out of 335 VLBW infants. Eighteen of the 29 infants had a clinical event or condition possibly related to the VLA. Most VLAs occurred while infants were on nasal continuous positive airway pressure, supplemental oxygen, and caffeine. Apnea alarms on the bedside monitor activated in 66% of events, on average 28 s after cessation of breathing. Bradycardia alarms activated late, on average 64 s after cessation of breathing. Before VLAs oxygen saturation was unusually high, and during VLAs oxygen saturation and heart rate fell unusually slowly. We give measures of the relative severity of VLAs and theoretical calculations that describe the rate of decrease of oxygen saturation. A clinical conclusion is that very long apnea (VLA) events with bradycardia and desaturation are not rare. Apnea alarms failed to activate for about one-third of VLAs. It appears that neonatal intensive care unit (NICU) personnel respond quickly to bradycardia alarms but not consistently to apnea alarms. We speculate that more reliable apnea detection systems would improve patient safety in the NICU. A physiological conclusion is that the slow decrease of oxygen saturation is consistent with a physiological model based on assumed high values of initial oxygen saturation.
Keywords: apnea, neonatal, hypoxia, bradycardia
more than two decades ago, Southall et al. (60) reported prolonged apnea and bradycardia events in preterm infants cared for in neonatal intensive care units (NICUs). In their study of 14 babies observed for 24-h periods, the authors were disturbed to report cessations of breathing as long as 213 s and to report that extended apnea events were often not detected or reported. Present practices (13, 18, 36) hold that any cessation of breathing longer than 10 s, if accompanied by bradycardia and oxygen desaturation, is an event that should be considered clinically significant (as should any apnea longer than 20 s regardless of bradycardia or desaturation). Most events last less than half a minute, either self-resolving or terminating when a caregiver stimulates the infant in response to a monitor alarm. Very long apnea (VLA) events may reflect abnormal physiology, impending illness, alarm failure, and/or failure of bedside clinicians to rescue infants from prolonged apneic spells.
Nearly all very low birthweight infants (VLBW; <1,500 g) experience apnea due to inherent brainstem and peripheral chemoreceptor immaturity, and pathologic processes such as sepsis, respiratory failure, intracranial hemorrhage, and seizures may increase the number or severity of apnea events. Apnea events may lead to tissue hypoxemia and, especially if prolonged, severe, or frequent, might contribute to adverse short- and long-term outcomes, including neurodevelopmental impairment. Preventing or minimizing bradycardia and desaturation related to apnea should therefore be a priority in NICU care. Steps toward this goal include understanding physiologic associations with severe apnea and optimizing monitor alarm systems and caregiver responses.
Apnea research was previously hindered by inaccurate and inefficient recording of events. Our group recently developed an automated apnea detection system that analyzes chest impedance (CI) waveform signals from all NICU bedside monitors, filters out cardiac and motion artifacts, and accurately identifies central apnea events accompanied by bradycardia and oxygen desaturation (ABD) (34). Using this novel system, together with a database consisting of over 100 infant years of electronic signals, we sought to quantitate and characterize VLA events in VLBW infants, defined as cessation of breathing >60 s accompanied by bradycardia (heart rate <100 beats/min) and oxygen desaturation (SpO2 <80%).
In this article we report descriptive clinical aspects and quantitative physiological aspects of very long central apnea events. We seek answers to the following questions. 1) Do infants really stop breathing for more than 60 s? How frequent are such events in our population? 2) Are the babies who have VLAs in some way different from those who do not, or is it the events that are different? 3) How significant are these events for the health of the infants? 4) Why do these events still occur? 5) We observe in these events very slow decline of heart rate and oxygen saturation. Can we give a physiological explanation for either of them? This article is organized such that the primary clinical results are in the main text, and everything mathematical is in appendixes b–d.
Neonatal apnea has previously been addressed from a variety of perspectives: physiology of respiration (8, 25), apnea of prematurity (6, 7, 13, 18, 27, 31, 35, 37, 41, 44, 46, 63), long apnea events (1, 10, 30, 45, 61), failure of monitoring (9, 22, 39, 60, 62, 66), the effect of saturation on apnea (23, 24), and the effect of apnea on SpO2 and bradycardia (16, 20, 28, 42, 43, 57). However, no previous workers have had access to such a large dataset (∼100 infant years, 335 VLBW infants, ∼20,000 apnea events), and none have connected clinical observations to the quantitative physiological theory that we give in the appendixes.
METHODS
Patients
We studied all 335 VLBW (<1,500 g) infants admitted from January 2009 through March 2011 to the 45 bed University of Virginia (UVa) NICU, a quaternary care facility that has more than 500 admissions per year, about one quarter of them VLBW. The study was approved by the UVa Institutional Review Board with waiver of consent and subsequently by the William and Mary Protection of Human Subjects Committee.
Bedside Monitor Data Collection
We collected and stored all waveform, vital sign, and alarm data from all NICU bedside monitors (GE Medical, models Solar 8000M and I and Dash 3000) via a BedMaster central network server (Excel Medical, Jupiter, FL). CI waveforms were collected at 60 Hz, three channels of electrocardiogram waveforms were collected at 240 Hz, and the photoplethysmographic waveform was collected at 120 Hz. In addition, vital sign data (heart rate, CI-derived respiratory rate, and pulse oximetry-derived O2 saturation recorded every 2 s) were collected. Also, all bedside monitor alarms were collected. Bradycardia alarms sound when the heart rate goes below a set limit (typically 90 beats/min) for at least eight heartbeats, oxygen alarms sound when SpO2 is lower than a set limit (typically 85%) for at least 5 s, and apnea alarms sound after 15 s of no monitor-detected breaths in the CI signal.
Apnea Analysis
We previously developed and validated a new algorithm for detecting central apnea (34). The algorithm filters the cardiac artifact and low-frequency fluctuations from the CI signal, analyzes the residual fluctuations, and produces, at quarter-second intervals, the probability that the infant is having a central apnea event at that moment. Careful validation indicated that the algorithm agrees with the expert opinion of clinicians in ∼90% of central apnea events. For the current analysis, we focused on central apnea events associated with bradycardia and desaturation. The algorithm's threshold for bradycardia is a heart rate <100 beats/min and for oxygen desaturation SpO2 <80%, for any duration. The events are categorized as ABDn, with “n” signifying the minimum length of cessation of breathing in seconds (e.g., ABD60 means cessation of breathing was 60 s or more, and ABD30–40 means cessation of breathing was between 30 and 40 s). For all infants in our database, we have recorded the date, time, and duration of every ABD10 event (10 s or more). Those ABD60 events that survived the validation described below are called VLAs.
We also collected several random samples of 10- to 20-s and 30- to 40-s apnea events to compare their properties with those of VLAs.
Identification of VLAs
In VLBW infants the computer algorithm identified 461 very long central apnea events (≥60 s) accompanied by bradycardia and desaturation in which all waveforms were available in VLBW infants. Every such event was examined by at least two clinicians who are expert on interpretation of the signals. Two groups of two clinicians independently reviewed half of the candidate VLA events, followed by consensus review in equivocal cases. It was found that some algorithmically detected events were artifacts caused by weak signals. In many other cases, the CI waveform signal was not completely flat but had some small or brief fluctuation that might represent one or several shallow breaths. Such events appear to be clinically relevant, and we discuss them in appendix a. Here, however, we wish to focus on the less common indisputable events. Candidate events were accepted as VLAs only if there was an acceptable CI tracing before, during, and after the event, the event was accompanied by any duration of bradycardia (<100 beats/min) and desaturation (<80%), the cessation of breathing lasted at least 60 s, and the filtered CI had no artifacts, no indication of shallow breaths, and no twitches in CI having an associated increase in heart rate. With this stringent process, 86 VLA events were identified in 29 infants (Fig. 1A and appendix a).
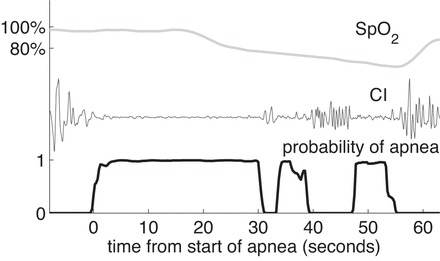
Fig. 1.
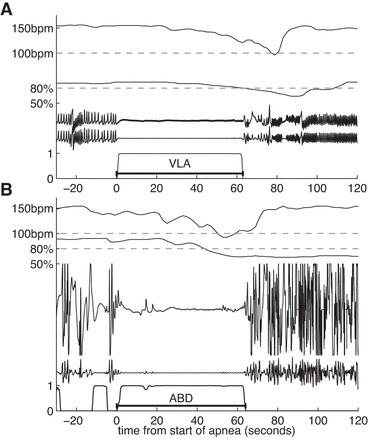
A: an example of a very long apnea (VLA). Shown are raw and processed electronic signals collected from bedside monitors. From top to bottom: heart rate from monitor, 100 beat/min threshold for bradycardia, oxygen saturation and 80% threshold for desaturation, raw chest impedance (CI), and filtered CI (removing cardiac artifact and slow fluctuation). Bottom curve is probability that the infant is having an apnea at each moment. This VLA lasts slightly more than 60 s. B: example of an apnea event lasting at least 60 s accompanied by bradycardia and oxygen desaturation (ABD60) that was excluded in our conservative validation. The small waves in the CI signal followed by an increase in heart rate might have been small breaths.
Study Group (I) and Comparison Group (N)
The result of this validation was that algorithmically-detected ABD60 events were divided into three categories: 1) VLAs, which we regard as indisputable cessations of breathing of 60 s or more; 2) “questionable” 60-s events involving, for example, long apnea-hypopnea combinations, which we regard as clinically significant but not indisputable VLAs (discussed in appendix a); and 3) excluded events. The same process identified the study group (I), consisting of those 29 infants who had “Indisputable” events. We chose a comparison group (N), consisting of those infants whose electronic signals “Never” showed a 60-s event of any type, validated, questionable, or excluded. In results we compare apnea rates and other characteristics of these groups. (We also report the number of infants who never had a computer-detected ABD10.)
Medical Record Review
Demographic data collected from the medical record included gestational age at birth, postmenstrual age (PMA) at the time of events, birthweight, and gender. Respiratory data collected from the medical record included the type of respiratory support, supplemental oxygen, administration of caffeine (if any), and the time on and off respiratory support. Times on mechanical ventilation were excluded. Clinical conditions or events potentially associated with VLA events were recorded, including severe intraventricular hemorrhage, severe gastroesophageal reflux, suspected sepsis (cultures obtained and antibiotics initiated within 24 h of VLA), respiratory failure (intubation and mechanical ventilation within 12 h after the VLA), and death. Survival to NICU discharge and length of NICU stay were recorded.
RESULTS
Patient Characteristics and Clinical Associations
Data from 335 VLBW infants were analyzed, and 86 VLA events in 29 infants were validated by the process described in methods and in appendix a. The estimated frequency of these VLA events is 1 per 70 infant days. (If questionable events were included, the estimate of the frequency would be about four times larger; see appendix a.) Characteristics of the infants are given in Table 1. The number of events per infant ranged from 1 to 19 (Fig. 2). In most respects, infants with VLAs were not significantly different from other VLBW infants (Table 1). Infants with VLA events had significantly longer NICU stays than those without (P = 0.02), and their average gestational age was slightly lower (P = 0.09; Table 1). Over half of the VLA infants fell in the gestational age (GA) range of 25–27 wk (Fig. 3A) and 84% of VLAs occurred <4 wk from birth (Fig. 3B). Seventy-nine percent of the VLAs occurred while infants were on continuous positive airway pressure (CPAP), usually with supplemental oxygen (Fig. 4). All 29 infants were on caffeine therapy at some time during their NICU stay, one VLA occurred 4 days after caffeine was discontinued. Two infants had VLA on the day of birth, before caffeine being initiated. No VLA events occurred within 10 days of NICU discharge.
Table 1.
Infant characteristics
| VLA (n = 29) | No VLA (n = 306) | P = | |
|---|---|---|---|
| Gestational age, wk | 26.5 ± 1.9 | 27.5 ± 3.1 | 0.09 |
| Birth weight, g | 952 ± 249 | 988 ± 299 | 0.53 |
| ELBW | 19 (66%) | 150 (49%) | 0.12 |
| Male | 14 (48%) | 154 (50%) | 0.85 |
| Mechanical ventilation at any time | 23 (79%) | 214 (70%) | 0.39 |
| Death before NICU discharge | 1 (3%) | 31 (10%) | 0.34 |
| Length of NICU stay, days | 78 ± 27 | 63 ± 42 | 0.02 |
VLA, very long apnea; ELBW, extremely low birth weight; NICU, neonatal intensive care unit.
Fig. 2.
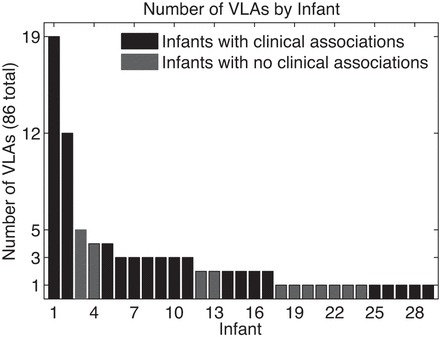
Number of VLA events per infant (infant 1 had 19 events, and 29 infants had at least 1 event).
Fig. 3.
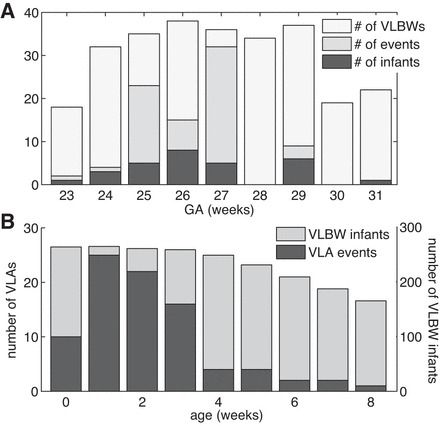
A: histogram of number of VLA events and number of VLA infants vs. gestational age (GA) at birth. For comparison the number of infants vs. GA for the entire population of very low birth weight (VLBW) infants in our database is also shown. For example, among 26-wk GA infants, 8 of the 37 VLBW infants had at least 1 event, and there were 15 total events. B: histogram of number of VLA events vs. chronological age (CA) at time of event for those infants having 1 or more VLAs (left scale). For comparison the number of VLBW infants who were in the University of Virginia neonatal intensive care unit (NICU) at that CA is also shown (right scale). For example, at 1 wk of age, there were 25 VLAs among 266 VLBW infants.
Fig. 4.
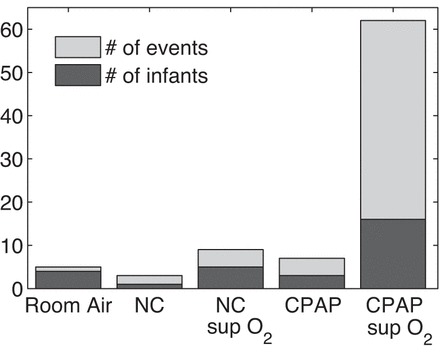
Histogram showing respiratory support of VLA infants at the times of their events. From left to right: room air, nasal cannula (NC) without supplemental oxygen (sup O2), nasal cannula with supplemental oxygen, continuous positive airway pressure (CPAP) without supplemental oxygen, and CPAP with supplemental oxygen. Most VLA events occurred while infants were on CPAP with supplemental oxygen.
For 18 of the 29 infants with VLAs, medical record review identified clinical conditions (separate from prematurity, which was present in all subjects), which are possibly associated with apnea (Table 2). Ten infants were receiving antibiotics at the time of the VLA, four were started on antibiotics within 24 h of the VLA for suspected sepsis (although none had proven septicemia), seven were intubated within 12 h of the VLA, and six had other conditions. The infant with the greatest number of events (19) died suddenly and unexpectedly for unclear reasons. He was stable on full feeds, CPAP, and caffeine at the time of death, and autopsy was declined. The other infant with a large number of events (12 VLAs at 2–3 wk of age) was on erythromycin for severe gastroesophageal reflux. No VLAs occurred beyond 18 days of age, and he was discharged home at 78 days of age. We could see no systematic differences in the characteristics of the VLAs associated with these different clinical situations.
Table 2.
Clinical conditions
| #Infants | Clinical Association | GA | #VLAs | PMA |
|---|---|---|---|---|
| 1 | Died 48 h after last VLA | 27 | 19 | 28–32 |
| 1 | Posthemorrhagic hydrocephalus, ventricular tap performed before VLA cluster | 26 | 3 | 31 |
| 1 | Grade IV intraventricular hemorrhage | 26 | 2 | 30 |
| 1 | On prostaglandins for congenital heart disease | 29 | 3 | 31 |
| 2 | On medication for severe GE reflux | 25 | 3–12 | 27–29 |
| 4 | Antibiotics started for suspected sepsis within 24 h of VLA | 23–29 | 1–19 | 26–31 |
| 10 | Receiving antibiotics at time of event | 25–30 | 1–19 | 25–32 |
| 7 | Intubated within 12 h of VLA | 23–29 | 1–4 | 24–31 |
| 11 | None identified, other than prematurity | 24–31 | 1–5 | 27–34 |
GA, gestational age; PMA, postmenstrual age; GE, gastroesophageal.
For the other 11 infants (38% of the VLA infants), we could not identify a clinical condition that appeared to be a cause or effect or to have an association with the VLA. These 11 differ only slightly from the 18 with clinical associations. The infants without clinical associations had slightly higher GAs, but the difference was not significant (P = 0.16). Not surprisingly, these 11 infants also had shorter stays in the NICU than the other 18 infants (P = 0.02). There were no differences in the rate of fall of heart rate and SpO2 between VLA infants with clinical associations and those without.
Apnea Rates in Different Groups of Infants
ABD10 tags in our database identify every computer-detected cessation of breathing lasting at least 10 s, when also accompanied by bradycardia and desaturation. The majority of VLBW infants in our population never had any computer-detected 60-s ABD event (group N). This group of infants had a low rate of short apnea events, and 31% of them never had even an ABD10 event. On the other hand, infants who had indisputable VLAs (group I) also had many short apnea events. The total number of ABD10 tags for the study group (I) and the comparison group (N) of VLBW infants are in Table 3.
Table 3.
Study group characteristics
| Groups | Number of ABD10 Tags | Number of Infants | %All VLBW Babies | Tags per Baby-Day of Data |
|---|---|---|---|---|
| Group I: infants with indisputable 60-s VLAs | 6,617 | 29 | 9 | 4.29 |
| Group N: infants who Never had a ABD60 | 6,300 | 199 | 59 | 1.52 |
| Infants who never had a computer-detected ABD10 (included in group N) | 0 | 62 | 19 | 0 |
| All VLBW infants | 30,793 | 335 | 100 | 2.94 |
ABD, apnea events accompanied by bradycardia and oxygen desaturation.
Included in the 199 infants in group N are 62 infants who never had a computer-detected apnea lasting at least 10 s with bradycardia and desaturation (ABD10). Thus in our population, 81% of VLBWs had at least one detected ABD10, while 19% did not.
Bedside Monitor Alarms in VLA Events
Apnea alarms are supposed to activate 15 s from the beginning of cessation of breathing; in fact they activated in 66% of these VLAs but failed to activate in 34% of them. Since bradycardia alarms activated in 57% of VLAs, and low oxygen alarms activated in 81%, the end result is that at least one alarm activated in 97% of VLAs. The monitors and the algorithm use slightly different criteria for bradycardia and desaturation, so it is not surprising that these alarms did not go off during all VLA events. (For additional comparisons among algorithm detection, monitor alarms, and nursing records, see Ref. 66.)
For the cases in which the bedside monitor gave an apnea or bradycardia alarm, Fig. 5 shows histograms of lengths of time from the start of the computer-detected apnea to the alarm and of times from the alarm to the end of the detected apnea. If an apnea alarm activated, it did so rather promptly, usually <25 s from the beginning of the computer-detected apnea. If a bradycardia alarm sounded, it usually occurred long after the cessation of breathing (Fig. 5), consistent with the slow fall of heart rate in these events. Shortly after the bradycardia alarm sounded (but frequently quite long after the apnea alarm), the apnea ended. We do not know which events were self-resolved and which were ended by staff response, but this observation is consistent with many others that suggest that NICU personnel respond quickly to bradycardia alarms and not necessarily to apnea alarms (9, 22, 39, 60, 62, 66).
Fig. 5.
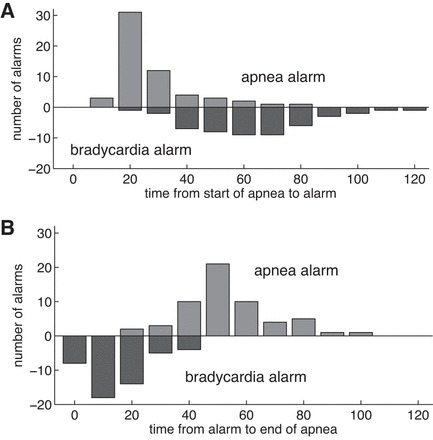
Time from cessation of breathing to bedside apnea or bradycardia alarm (A), and time from alarm to end of apnea for VLAs (B). If the apnea alarm sounds, it usually does so within ∼20 s after the beginning of the apnea. In VLA events, the heart rate falls slowly, so the bradycardia alarm is much delayed, typically sounding 60–70 s after the apnea begins. Apneas usually end a short time after the bradycardia alarm.
Characteristics of Short Apnea Events in Infants with and without VLA
To determine whether short apnea events in infants who have VLAs are different from short apnea events in other infants we collected a random sample of 100 ABD30–40 events from our study group (I) and also from our comparison group (N). Events for this comparison group were chosen such that infants' PMA at the time of the event was <34 wk and there was no apnea in the 5 min preceding the ABD30–40 event.
In Fig. 6 we show the average heart rate and oxygen saturation for these 100 events in each group. There is no statistically significant difference between these two groups in the rate of fall of oxygen saturation or heart rate. The same holds for ABD10–20 events. In this regard there is no difference between VLA infants and non-VLA infants.
Fig. 6.
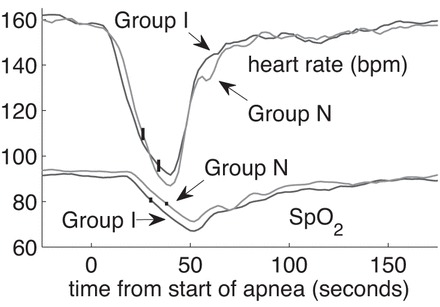
Average heart rate and oxygen saturation in a random selection of 100 ABD30–40 events in infants who had indisputable VLAs (group I) and infants of comparable PMA who never had an ABD60 (group N). SpO2, oxygen saturation. Vertical lines indicate ± 1SE.
Comparison of Short and Long Events in Infants Having VLAs
A striking characteristic of the long apnea events is that the heart rate and oxygen saturation fall later and more slowly compared with the decline in heart rate and SpO2 during shorter ABD events. This is shown in Fig. 7; 100 ABD 10–20 and 100 ABD 30–40 events were randomly selected only from infants who had indisputable VLAs (group I). The events were chosen such that the infant's PMA was <31 wk at the time of the event. The average of multiple events is plotted, and the standard error of the means is marked. The heart rate fell below 100 beats/min and the oxygen saturation fell below 80% in every individual event. However, these thresholds were crossed at different times in different events, so the averages do not necessarily fall below the thresholds.
Fig. 7.
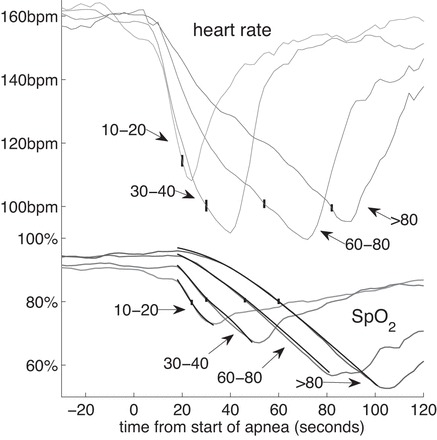
In VLAs oxygen saturation and heart rate fall slowly. We show the average heart rate and SpO2 for all of the VLAs (ABD60–80, n = 46, and ABD80, n = 40). For the shorter events we took a random sample of ABD10–20 (n = 100) and ABD30–40 (n = 100) from this same group of infants. The start of the computer-detected apnea is t = 0. The black curves, barely distinguishable from the observed SpO2 curves, are based on the theory from Eqs. 1–6 with constants given in Table D1. Vertical lines indicate ± 1SE.
Just before the VLA begins, the oxygen saturation is significantly higher than the saturation before shorter ABDs (other somewhat related studies include Refs. 16, 20, 23, 24, 28, 42, 43, 57). The median oxygen saturations in the 60 s before the apnea begins are 92% for ABD10–20 events; 93% for ABD30–40 events; 96% for VLAs in which apnea lasts from 60 to 80 s; and 97% for VLAs where apnea lasts longer than 80 s. Oxygen saturations before VLAs was significantly greater than saturation before the shorter apnea events (Wilcoxon rank-sum, P << 0.001).
Additional details about the rate of fall of SpO2 are given in appendexes b–d. 1) Because of the slow fall, it is not immediately clear whether the severity of apnea events increases in proportion to their duration; measures of severity of apnea events of various durations are discussed in appendix b, and we conclude that the duration is indeed a fair measure of the deficit of oxygen transported in the blood. 2) In appendix c, we show that before a VLA, the infants are, on average, breathing slightly faster than they are before a short apnea, and we show that the median SpO2 is gradually rising in the 5 min before the VLA. 3) A quantitative theory for the rate of fall of SpO2 is given in appendix d; the results of this theoretical calculation are shown in Fig. 7.
DISCUSSION
While apnea is a normal developmental phenomenon in preterm infants, exaggerated apnea is an important problem that may reflect or lead to adverse events or outcomes. These events are interesting from a physiologic perspective and important from a patient safety perspective; thus we turn to the questions posed in the Introduction.
1) How frequent are the events? VLA events are not rare. We used very stringent criteria to define a VLA. We found that infants show no evidence of breathing for durations of up to 132 s. These events occur with a frequency of 1 per 70 infant days in our population.
2) Are the infants with VLA different? VLA infants differ from non-VLA infants in that they have a much higher rate of short apnea events and presumably have less developed respiratory control. We found short apnea events in VLA infants to be indistinguishable from short apnea events in non-VLA infants.
3) How clinically significant are the events? It is difficult to establish the effect of VLAs on the short-term or long-term health of infants. In appendix b we show that, despite the slow drop of SpO2 in VLAs, the available measure of deficit in oxygen transport is approximately proportional to the duration of the cessation of breathing, i.e., 90-s apnea events result in approximately three times the oxygen transport deficit of 30-s apnea events (which are already considered by some to be “extreme”; Ref. 30). Our information on clinical consequences leads to ambiguous results. On one end of the VLA spectrum, an apparently healthy preterm infant had 19 events over a 3-wk period and eventually died following a respiratory arrest from which he could not be resuscitated. However, other VLA infants had normal courses in the NICU. Lacking postdischarge objective neurodevelopmental follow-up testing on infants, we can only say that, with the possible exception of the infant who died, no clinical consequences could be proved to be caused by VLAs. Nevertheless, VLAs cannot be good for infants, and their frequency is disturbing.
4) Why do VLAs occur? Part of the explanation of why VLAs occur is that apnea alarms fail to activate in about one-third of these events. In addition, we previously showed that about two-thirds of all apnea alarms are false alarms (34), so alarm fatigue or alarm distrust may also be a factor (66). Clinical experience and our data suggest that bedside caregivers respond quickly to bradycardia alarms, which are “crisis” alarms on the monitors in the UVa NICU (in contrast to apnea “warning” alarms), but as a result of the slow fall of heart rate these alarms are delayed. We believe that more reliable apnea alarms, with fewer false negatives and false positives, would be helpful to NICU personnel and might have a significant beneficial effect on the health of infants by reducing hypoxemia and bradycardia.
5) What is the physiological mechanism? We show that the respiratory rate is somewhat elevated and SpO2 steadily rises in the 5 min before a VLA. Accordingly, SpO2 is unusually high at the commencement of the event (see Comparison of Short and Long Events in Infants Having VLAs and appendix c). Combining this observation with the hypothesis that venous oxygen is also somewhat elevated leads to a quantitative description of the average rate of fall of SpO2 with time (presented in appendix d).
CONCLUSION
Prolonged apnea events should be preventable. Since these events could have detrimental consequences and are often not noticed and/or not recorded in the medical record, improvements in bedside monitor apnea detection, alarm systems, and caregiver responses are key to providing a safer environment for hospitalized preterm infants.
GRANTS
This work was funded by National Institute of Child Health and Human Development GO Grant 1 1RC2-HD-064488-02 and by National Science Foundation Grant 1068344. Computations were performed using computational facilities at the College of William and Mary, which were provided with the assistance of the National Science Foundation, the Virginia Port Authority, Sun Microsystems, and Virginia's Commonwealth Technology Research Fund.
DISCLOSURES
JBD and HL have a patent on the apnea detector.
AUTHOR CONTRIBUTIONS
Author contributions: M.A.M., B.D.V., H.L., J.R.M., K.D.F., and J.B.D. conception and design of research; M.A.M., B.D.V., H.L., D.E.L., A.C.M., J.K., R.A.S., K.D.F., and J.B.D. analyzed data; M.A.M., B.D.V., H.L., A.C.M., J.K., R.A.S., K.D.F., and J.B.D. interpreted results of experiments; M.A.M., A.C.M., and J.B.D. prepared figures; M.A.M., B.D.V., and J.B.D. drafted manuscript; M.A.M., B.D.V., J.K., R.A.S., K.D.F., and J.B.D. edited and revised manuscript; M.A.M., B.D.V., H.L., M.T.C., D.E.L., J.K., R.A.S., J.R.M., K.D.F., and J.B.D. approved final version of manuscript; H.L., M.T.C., D.E.L., and J.R.M. performed experiments.
ACKNOWLEDGMENTS
Present address of M. T. Clark: Adult Medical Predictive Devices, Diagnostics, and Displays, LLC, Charlottesville, VA 22903.
Appendix A: QUESTIONABLE AND EXCLUDED EVENTS
Clinicians reviewed 461 ABD60 events in VLBW infants for which all waveforms were available. Of these, 20 had poor and uninterpretable signals, and 38 were recognized as apnea events of less than a 60-s duration. These 58 events were excluded. The remaining 317 events failed our strict VLA criteria for the following reasons: there were fluctuations in the CI with a frequency lower than typical breathing, the origin of these fluctuations is unknown, but they certainly do not represent normal breathing; there were small shallow breaths present (hypopnea); the event was actually two separate apnea events; or there was a small wave in the CI which was followed by a rise in the heart rate. In Fig. 1B the two small fluctuations in the CI are followed by an increase in heart rate, so they are possibly small breaths and this event was excluded.
We consider these 317 “questionable” cases to be examples of failure of respiratory regulation lasting at least 60 s, but we do not include them in our category of indisputable VLAs. If these 317 events have clinical significance comparable to that of the indisputable VLAs, then the total number of events is more than four times larger than stated in Patient Characteristics and Clinical Associations, i.e., 1 per 16 infant days in our population.
Appendix B: MEASURES OF SEVERITY OF A VLA
A balanced perspective on the significance of VLAs is needed. One difficulty in assessing their impact arises from the slow fall in oxygen saturation and heart rate during these events; consequently, it is not clear that the duration of the apnea is a good measure of the severity of a VLA. Indeed, Alvarro and Rigatto (2) suggested that “The length of the respiratory pause is not a very useful indicator of [its] severity. . . . For this reason, many centers . . . have decided to rely on heart rate as the primary indicator of severity.” Furthermore, the optimal oxygen saturation for infants is a matter of current debate (4, 5, 11, 15, 40, 53, 58, 59, 65, 70).
To compare VLAs with shorter apnea events, we defined and computed measures of the oxygen deficit and the heartbeat deficit. These measures are areas on graphs of SpO2 or heart rate vs. time.
Method
Clinicians note the depth and the duration of desaturation events. However, automated data analysis systems could provide superior measures, for example, the area enclosed by the SpO2 curve below a chosen threshold. This area is related to the deficit in the quantity of oxygen carried by the blood. If normal oxygen transport in the blood is M ml/min, and the measured area under the baseline is A % min, then M·A/100 is the oxygen deficit resulting from the apnea. For example, if normal transport were 5 ml O2/min (Ref. 14, p. 970), then an area of 22% min means that over the duration of the apnea event, the blood transported 1.1 ml of O2 less than it would have in the absence of the apnea.
The area obtained depends on the baseline chosen. We choose our baseline to be the lesser of 92% or a measured preapnea baseline (PAB). That PAB was obtained by evaluating the mean μ and standard deviation σ of SpO2 over an interval before the long event and taking PAB = μ-2σ. The interval was chosen to be within 120 s of the beginning of the VLA but not containing another desaturation with an area greater than 2% min. An example is shown in Fig. B1A, with an area of 22% min.
Fig. B1.
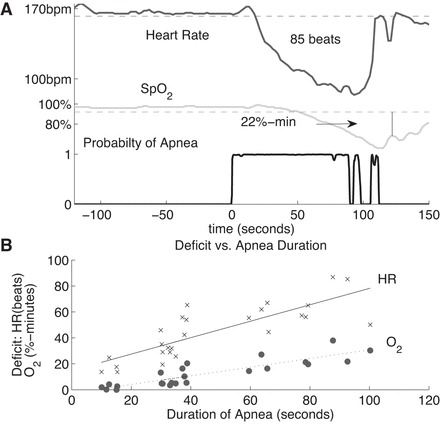
Methods for measuring severity of apneas. A: for each signal, a baseline is chosen. For heart rate the mean minus two standard deviations in an interval before the apnea that contains no significant deceleration is chosen as a baseline. For SpO2 the lower of a similar baseline or 92% is used. The areas between the chosen baseline and the signal are computed. In this case the VLA is followed by short events, and after reaching a minimum, SpO2 rises and falls again. We include only the area up to the marked boundary, at the local max of SpO2. B: oxygen deficit (O2) and heartbeat deficit (HR) vs. apnea duration for 1 infant, with linear fits using the least squares method. For HR the linear fit is A = 0.64T-14.79 and the correlation coefficient is 0.81. For O2 the linear fit is A = 0.33T-2.6 and the correlation coefficient is 0.88.
The depth and duration of an associated bradycardia are relevant measures of the severity of an apnea event, but again an area measure is more appropriate. For each event, we chose a baseline from the heart rate before the apnea, mean minus two standard deviations over an interval within 120 s from the cessation of breathing but not containing a drop of more than 10 beats/min. We calculate the area between that baseline and the actual heart rate while the heart rate is below the baseline. This area is the heartbeat deficit, the number of heartbeats that the infant would have had if its heart rate continued at the baseline value minus the actual number of beats. In Fig. B1A this baseline is shown and the area below the baseline in this case amounts to a deficit of 85 beats.
Results
We examined long and short apnea events in “Infant 1,” the infant who had 19 VLAs. Random sets of ABD10–20 and ABD30–40 events from this infant were collected. With the use of the method described above, the “oxygen deficit” and the “heartbeat deficit” were calculated in these shorter events and in the 19 VLAs. The results are shown in Fig. B1B. The areas increase approximately linearly with the duration of the apnea. The sample correlation coefficients are 0.81 for heart rate (P << 0.001) and 0.88 for oxygen saturation (P << 0.001). This indicates that the area measure is providing some information independent of the duration, but area and duration are well correlated.
Lower baselines give smaller areas. A baseline of 80% for oxygen saturation gives a slope that is about half of what our baseline gave (0.18%·min·s−1), but the correlation coefficient is comparable (0.79, P << 0.001).
Discussion
The graphs in Fig. B1B show measures of the relative significance of VLAs vs. short apnea events. The roughly linear trend suggests that a 90-s apnea results in about three times the oxygen deficit and three times the heartbeat deficit of a 30-s apnea. (This fact is not obvious a priori, because heart rate and SpO2 decrease slowly in long apnea events.) Such deficits could be reduced by earlier and more accurate identification of apnea events.
Appendix C: OXYGENATION BEFORE VLAS
Here we give evidence that infants are raising the oxygen level in their blood before a VLA. 1) We show that those infants who have VLAs breathe more rapidly before a VLA than before a short apnea. 2) We show that the median SpO2 rises gradually in the minutes before a VLA.
Method
The respiration rate reported by monitors is notoriously unreliable because of artifacts in the CI signal. Using our filtered CI (34), from which most artifacts have been removed, we found zero-crossings of the filtered CI and maxima and minima between each zero-crossing. We define the breath length to be the time between two successive minima. To prevent residual fluctuations around zero to be mistakenly interpreted as breaths, we applied two additional criteria. 1) The probability of apnea must be less than 0.5 at the times of the minima. 2) Consecutive maxima and minima must be at least 0.1 times the standard deviation of the signal.
We examined apnea events only in those infants who have VLAs. We obtained the respiration rate for 100 breaths preceding each of the 86 VLAs and also for 100 breaths preceding 100 randomly selected apnea events of duration 10–20 s in the same infants.
The best way to make the comparison is with the cumulative histograms of breath lengths (Fig. C1A). This shows for each duration T the fraction of breaths having duration less than T. That curve was fit to a rational function of T, and the derivative of that rational function was computed, giving what we call the continuous-fit histogram.
Fig. C1.
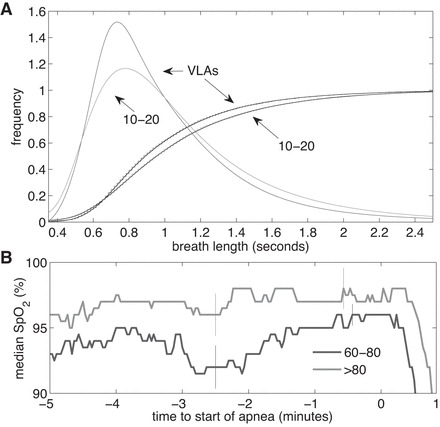
A: continuous histograms and cumulative probability distributions with rational-function fit of 100 breaths right before an apnea. Distributions are shown for VLAs and ABD10–20 events in the same infants. B: median SpO2 in the 5 min leading up to a VLA for the 46 ABD60–80 events and the 40 ABD80 events. Apnea starts at t = 0. Vertical lines indicate ± 1SE.
For SpO2 we calculated the median in the 5 min leading up to the 86 VLAs and in the 5 min leading up to the same randomly selected apnea events of 10- to 20-s duration (Fig. C1B).
Result
The resulting graphs are shown in Fig. C1. From the cumulative histograms it is clear that the breath durations leading up to a VLA are generally shorter than those leading up to a 10- to 20-s apnea. Comparing the two distributions using the Kolmogorov-Smirnov test gives a P value of 0.0024, confirming that the two distributions are different. Barely visible behind the cumulative distributions in Fig. C1A is a smooth curve representing the rational-function fit. The derivatives of these, the continuous-fit histograms, are also shown. Breaths before VLAs are on average 3% shorter, in median 3.3% shorter, and in mode 9% shorter than breaths before 10- to 20-s apnea events.
Also we see that median SpO2 rises gradually in the 5 min leading up to VLAs.
Appendix D: A MATHEMATICAL MODEL FOR THE RATE OF DECLINE OF SpO2
Here we present the theory represented by the theoretical curves in Fig. 7 showing SpO2 as a function of time. The most striking fact about the VLAs is that oxygen saturation falls more slowly in these events than in shorter apnea events (Fig. 7). Why does this happen? We propose that the explanation of the slow fall of SpO2 is that both arterial and venous oxygenation are unusually high at the start of the event. The high value of venous saturation (Sv) causes the partial pressure of oxygen in the alveoli to drop rather slowly. The high initial values of SpO2 correspond to values at which the oxygen-hemoglobin dissociation curve SpO2(Po2) is flat; as oxygen is absorbed from alveoli into blood, and the partial pressure of oxygen in the alveoli falls, the associated drop in arterial oxygen saturation is small. Here we give a quantitative model that shows this effect.
Method
An excellent study of the theory of arterial oxygen desaturation during apnea in preterm infants was carried out by Sands et al. (50), following a long tradition of closely related work (17, 25, 32, 38, 54, 55, 64, 68, 69) (see also Refs. 48, 49, 51, 52, 67). We use this as the basis for the following theory which we compare with our observations. The assumptions and approximations used are 1) during an apnea, the only loss of oxygen in the alveoli arises from diffusion into the blood. 2) In each heartbeat, gaseous oxygen in the alveoli equilibrates with oxygen in pulmonary capillaries. 3) Venous blood is homogeneous, with uniform SpO2. 4) The oxygen saturation in the pulmonary vein leaving the lungs is equal to the oxygen saturation measured by the pulse oximeter a few seconds later, in the finger or toe. 5) All O2 in the blood is carried by hemoglobin. 6) During the apnea, the cardiac output does not change significantly. 7) SpO2 is related to partial pressure of oxygen in the alveoli by an equation first given by Hill (29) and quoted (with a slight change) by Delivoria-Papadopoulos and McGowan (14)
| (1) |
In this equation, we took n = 2.9 (14) and calculated k from reasonable values of P50, the value of pressure at which SpO2 = 50%.
These assumptions lead to two differential equations with a time delay:
| (2) |
| (3) |
Equation 2 is equivalent to Eq. 10 of Sands et al. (50), and Eq. 3 can be derived from Eq. 6 in Sands et al. Here S(t) is the oxygen saturation leaving the lungs, which by assumption is equal to the measured SpO2 a few seconds later; Sv(t) = SvO2, the venous oxygen saturation, C is a constant, proportional to hemoglobin concentration in the blood and to the cardiac output and inversely proportional to lung volume, and
| (4) |
which can be obtained from Eq. 1, and which must be expressed as a function of SpO2 rather than Po2. T is arterial transit time, d is equal to cardiac output divided by venous blood volume, and e is the rate at which oxygen is utilized by the tissues. We treat C, T, d, and e as constants, independent of time, and independent of the duration of the apnea event. From their values, and from the initial conditions S(t = 0) and Sv(t = 0), the above equations determine the evolution of S(t).
These four constants and the initial conditions were determined by first obtaining preliminary estimates and then refining by fitting to the observations. The preliminary estimates were obtained by the following process. Sands et al. (50) showed that oxygen saturation during an apnea frequently follows a two-stage pattern. In the first stage, t ≤ T, S(t) drops rapidly, while in the second stage, it drops more slowly and at a constant rate (Fig. D1). In cases where the two stages can be easily identified on a graph of S(t) the arterial transit time T can be determined from the graph. Also, in the first stage Sv(t) is constant. Hence in this stage, Eq. 2 contains two unknowns: Sv and C. These can be determined by choosing two points in time early in the apnea, tj = (t1, t2), extracting S(tj) and dS/dt|tj from the observations, and then solving the two equations for C and Sv.
Fig. D1.
An example of oxygen saturation falling in 2 stages. SpO2, filtered CI, and the probability of apnea are shown.
To obtain estimates of d and e we set t = T in Eq. 3 and find
| (5) |
In the second stage, the arterial oxygen saturation falls linearly with time at a rate approximately equal to (50)
| (6) |
From the observed rate of decline dS(t)/dt in the second stage, and with Sv(0) determined as above from stage 1, we have two equations for d and e with two unknowns.
Two issues remain. 1) There is a time delay between oxygen leaving the lungs and oxygen detected in the finger or toe. Part of this time delay is related to circulation time of blood and part of it is related to the averaging time of the oxygen monitor. A time delay of 20 s was chosen for all of the average curves in Fig. 7 and gave satisfactory results. 2) The average saturation curves do not show any clear division between stage 1 and stage 2. Therefore, individual apnea events that show this distinction were used to obtain estimates of T, d, and e. There are several such cases, one of which is shown in Fig. D1.
Finally, the values of these parameters were adjusted to fit the observations.
Results
It is very important to note that we used the same constant values of C, T, d, and e for short and long apnea events. We adjusted only the initial conditions S(0) and Sv(0) to fit the individual curves.
Table D1 lists the constants (except e, which can be found using Eq. 5) and the initial conditions. The resulting theoretical curves are shown in Fig. 7. The agreement with the average SpO2 curves is remarkable: over the whole of each of the ranges where SpO2 is falling, the theoretical curves are only barely discernible from the observed ones and differ from them by less than the standard error of the means of the observations.
Table D1.
Initial conditions and constants. Values in parentheses were obtained using the one-at-a-time method
| Parameter | ABD10–20 | ABD30–40 | ABD60–80 (VLAs) | ABD80 (VLAs) |
|---|---|---|---|---|
| S | 0.870 (0.005) | 0.915 (0.007) | 0.950 (0.005) | 0.970 (0.003) |
| Sv | 0.70 (0.01) | 0.74 (0.01) | 0.800 (0.005) | 0.825 (0.005) |
| C | 13.3 (0.6) | |||
| d | 0.2 (0.6) | |||
| T | 12 (1) | |||
S, saturation; Sv, venous saturation; C, constant proportional to hemoglobin concentration in the blood and to the cardiac output and inversely proportional to lung volume; d, cardiac output divided by venous blood volume; T, arterial transit time.
In parentheses in Table D1 we report the uncertainty in the values of the parameters. These were obtained by finding the standard deviation of the mean of each set of observations and adjusting parameters one-at-a-time to find values where the theoretical curves would disagree with observations by more than one standard error of the mean.
Discussion
We have shown that the theory given by Sands et al. (50) leads to remarkable agreement with observation. Thereby, it provides a credible explanation of why SpO2(t) falls slowly in long apnea events (whereas other attempted explanations fail). Two factors are at work. At high oxygen saturations, the curve relating oxygen saturation to partial pressure of oxygen SpO2(Po2) is flat, and the function D(S) is near zero. In the alveoli and in the arteries, a large change in partial pressure of oxygen gives only a small change in SpO2. As a result, SpO2 falls very slowly near the beginning of an apnea when oxygen saturation is high. In this regard the slow fall of SpO2 from high levels is a natural consequence of well-known physiology. The second factor is the inferred somewhat elevated oxygen saturation in the veins. We have no direct measurements of venous oxygen saturation; it is obtained only by fitting to the observations. However, this is consistent with the result shown in appendix c showing the steady rise of SpO2 over at least 5 min before VLAs.
Assumptions and approximations.
To understand the limits of the theory (50) as we apply it, let us reexamine some of the approximations. During an apnea, the CO2 concentration and pH of the blood may change, and these shift the hemoglobin saturation curve, SpO2(Po2). This shift can be characterized by a changed value of P50, the pressure at which hemoglobin is 50% saturated. This change, however, turns out to have only a small effect on the time dependence SpO2(t). One can include the effect approximately by changing the value of k in Eq. 1. However, when calculating SpO2(t) as described above using Eq. 1, the value of k exactly cancels (for fixed C and SvO2), so at this level of approximation, P50 has no effect. [In a more accurate treatment, again holding C and SvO2 fixed, P50 would have a nonzero but small effect; Sands et al. (50), who used the Severinghaus formula (56) instead of Eq. 1, found that a change of P50 by 6–12 mmHg gave significant changes to SpO2(t), but part of the change they obtained resulted from changed initial values of SpO2 and SvO2.]
Another effect we neglected is extrapulmonary right-to-left shunt. Since we find that the median oxygen saturation before a VLA is 96–98%, it appears that shunted blood is a small fraction of arterial blood and would have little effect on the calculation of SpO2(t). Sands et al. (50) also note that shunt fraction affects the starting value of SpO2(t) but has little effect on its rate of change.
Cardiac output was assumed to be approximately constant. This approximation is commonly used in models of short apnea events and models of periodic breathing (32, 38, 64), and it can be justified as a manifestation of the Frank-Starling effect (25), which is now known to be present in neonates (3, 20, 33, 47).
Further study of assumption (3), that venous blood is well-mixed and homogeneously oxygenated would be beneficial. This should be accurate in steady state, but it is not clear that it would hold during the rapid changes of oxygenation that occur during apnea.
Alternative hypotheses.
We arrived at this theory only after elimination of a number of other hypotheses, which we examine here. 1) Infants who have VLAs are different in some way from other infants of comparable age. For example, they may have unusually high amounts of fetal hemoglobin, which holds oxygen more strongly than adult hemoglobin, and therefore oxygen saturation may drop more slowly when they have apnea. However, this hypothesis can be excluded, because these same infants (in the same epochs) have short apnea events that are indistinguishable from short apnea events in other infants. 2) There is some mechanism acting in some instances that, analogous to the “diving seal” reflex, reduces oxygen consumption in these infants. This hypothesis is not credible because these events look nothing like the dive reflex. This reflex acts within seconds; one observation of the dive reflex in a human infant showed the heart rate dropping from >150 to <105 beats/min in ∼1 s (21). Furthermore, reduced oxygen consumption would affect venous oxygen saturation, which would slow the rate of fall of arterial oxygen only after a time delay, but we see arterial oxygen saturation falling slowly from the beginning. 3) Noting that most of the infants who have VLAs are on CPAP, one might hypothesize that the infant is somehow getting oxygen from the CPAP even though there is no detectable chest movement. CPAP is expected to maintain functional residual capacity; in this regard, this hypothesis is consistent with the model presented above. In addition, one might hypothesize that CPAP is providing a flow of fresh air to the alveoli that is not visible in the CI signal (12). “Apneic oxygenation” is flow of fresh air into alveoli caused by removal of oxygen into the blood stream (19, 26). Rough estimates suggest that this process would have a small effect. We have no decisive evidence for or against this hypothesis, but it does not explain why the same infant in the same epochs has short apnea events in which oxygenation falls quickly and long ones in which it falls slowly. Also, a quantitative theory of this process is not presently available, it would be complex, and it would depend on a number of unknown parameters. In contrast, the theory given in Sands et al. (50) and applied above is fully developed, and we can extract all parameters by fitting to observations.
Conclusion
This theoretical method might turn out to provide useful physiological information. C and d are both proportional to cardiac output, e is proportional to metabolic rate, and Sv is the venous oxygen saturation, none of which are continuously available in NICU monitoring. By fitting the time course of SpO2 in individual apnea events to the theory, it may be possible to get estimates of these parameters during each apnea. This will be the topic of a future study.
REFERENCES
- 1.Al-Saedi SA, Lemke RP, Haider ZA, Gates DB, Kwiatkowski K, Rigatto H. Prolonged apnea in the preterm infant is not a random event. Am J Perinatol 14: 195–200, 1997. [DOI] [PubMed] [Google Scholar]
- 2.Alvaro RE, Rigatto H. Control of breathing in fetal life and onset and control of breathing in the neonate. In: Fetal and Neonatal Physiology, edited by Polin RA, Fox WW, Abman SH. New York: Elsevier-Saunders, 2011. [Google Scholar]
- 3.Anderson PA, Kleinman CS, Lister G, Talner NS. Chapter 81A: cardiovascular function during normal fetal and neonatal development and with hypoxic stress. In: Fetal and Neonatal Physiology, edited by Polin RA, Fox WW. New York: Elsevier, 1998, p. 837–888. [Google Scholar]
- 4.Askie LM, Henderson-Smart DJ, Ko H. Restricted versus liberal oxygen exposure for preventing morbidity and mortality in preterm or low birth weight infants. Cochrane Database Syst Rev 1: CD001077, 2009. [DOI] [PMC free article] [PubMed] [Google Scholar]
- 5.Askie LM, Henderson-Smart DJ, Irwig L, Simpson JM. Oxygen-saturation targets and outcomes in extremely preterm infants. N Engl J Med 349: 959–967, 2003. [DOI] [PubMed] [Google Scholar]
- 6.Baird TM, Martin RJ, Abu-Shaweesh JM. Clinical associations, treatment, and outcome of apnea of prematurity. Neoreviews 3: e66-e70, 2002. [Google Scholar]
- 7.Barrington K, Finer N. The natural history of the appearance of apnea of prematurity. Pediatr Res 29: 372–375, 1991. [DOI] [PubMed] [Google Scholar]
- 8.Boron WF, Boulpaep EL. Medical Physiology (2e updated ed.). New York: Elsevier Health Sciences, 2012. [Google Scholar]
- 9.Brockmann PE, Wiechers C, Pantalitschka T, Diebold J, Vagedes J, Poets CF. Under-recognition of alarms in a neonatal intensive care unit. Arch Dis Child Fetal Neonatal Ed 98: F524–7, 2013. [DOI] [PubMed] [Google Scholar]
- 10.Butcher-Puech MC, Henderson-Smart DJ, Holley D, Lacey JL, Edwards DA. Relation between apnoea duration and type and neurological status of preterm infants. Arch Dis Child 60: 953–958, 1985. [DOI] [PMC free article] [PubMed] [Google Scholar]
- 11.Campbell K. Intensive oxygen therapy as a possible cause of retrolental fibroplasia; a clinical approach. Med J Aust 2: 48–50, 1951. [PubMed] [Google Scholar]
- 12.Chang HK. Mechanisms of gas transport during ventilation by high frequency oscillation. J Appl Physiol Respir Environ Exercise Physiol 56: 553–563, 1984. [DOI] [PubMed] [Google Scholar]
- 13.Darnall RA, Kattwinkel J, Nattie C, Robinson M. Margin of safety for discharge after apnea in preterm infants. Pediatrics 100: 795, 1997. [DOI] [PubMed] [Google Scholar]
- 14.Delivoria-Papadopoulos M, McGowan JE. Oxygen transport and delivery. In: Fetal and Neonatal Physiology, edited by Polin RA, Fox WW, Abman SH. New York: Elsevier-Saunders, 2011, p. 970–979. [Google Scholar]
- 15.Deulofeut R, Critz A, Adams-Chapman I, Sola A. Avoiding hyperoxia in infants ≤1250 g is associated with improved short-and long-term outcomes. J Perinatol 26: 700–705, 2006. [DOI] [PubMed] [Google Scholar]
- 16.Di Fiore JM, Arko MK, Miller MJ, Krauss A, Betkerur A, Zadell A, Kenney SR, Martin RJ. Cardiorespiratory events in preterm infants referred for apnea monitoring studies. Pediatrics 108: 1304–1308, 2001. [DOI] [PubMed] [Google Scholar]
- 17.Farmery A, Roe P. A model to describe the rate of oxyhaemoglobin desaturation during apnoea. Br J Anaesth 76: 284–291, 1996. [DOI] [PubMed] [Google Scholar]
- 18.Finer NN, Higgins R, Kattwinkel J, Martin RJ. Summary proceedings from the apnea-of-prematurity group. Pediatrics 117, Suppl 1: S47–S51, 2006. [DOI] [PubMed] [Google Scholar]
- 19.Frumin MJ, Epstein RM, Cohen G. Apneic oxygenation in man. Anesthesiology 20: 789–798, 1959. [DOI] [PubMed] [Google Scholar]
- 20.Girling DJ. Changes in heart rate, blood pressure, and pulse pressure during apnoeic attacks in newborn babies. Arch Dis Child 47: 405–410, 1972. [DOI] [PMC free article] [PubMed] [Google Scholar]
- 21.Goksör E, Rosengren L, Wennergren G. Bradycardic response during submersion in infant swimming. Acta Paediatr 91: 307–312, 2002. [DOI] [PubMed] [Google Scholar]
- 22.Graff M, Soriano C, Rovell K, Hiatt IM, Hegyi T. Undetected apnea and bradycardia in infants. Pediatr Pulmonol 11: 195–197, 1991. [DOI] [PubMed] [Google Scholar]
- 23.Haider AZ, Rehan V, Alvaro R, Al-Saedi S, Kwiatkowski K, Cates D, Rigatto H. Low baseline oxygenation predisposes preterm infants to mixed apneas during inhalation of 100% oxygen. Am J Perinatol 13: 363–369, 1996. [DOI] [PubMed] [Google Scholar]
- 24.Haider A, Rehan V, Al-Saedi S, Alvaro R, Kwiatkowski K, Cates D, Rigatto H. Effect of baseline oxygenation on the ventilatory response to inhaled 100% oxygen in preterm infants. J Appl Physiol 79: 2101–2105, 1995. [DOI] [PubMed] [Google Scholar]
- 25.Hall JE, Guyton AC. Textbook of Medical Physiology. New York: Elsevier Health Sciences, 2010. [Google Scholar]
- 26.Heller ML, Watson TR Jr, Imredy DS. Apneic oxygenation in man: polarographic arterial oxygen tension study. Anesthesiology 25: 25–30, 1964. [DOI] [PubMed] [Google Scholar]
- 27.Henderson-Smart DJ. Apnea of prematurity. In: Respiratory Control Disorders in Infants and Children, edited by Beckerman RC, Brouillette RT, Hunt CE. Baltimore, MD: Williams & Wilkins, 1992, p. 161–177. [Google Scholar]
- 28.Henderson-Smart DJ, Butcher-Puech MC, Edwards DA. Incidence and mechanism of bradycardia during apnoea in preterm infants. Arch Dis Child 61: 227–232, 1986. [DOI] [PMC free article] [PubMed] [Google Scholar]
- 29.Hill AV. The possible effects of the aggregation of the molecules of haemoglobin on its dissociation curves. J Physiol 40: iv–vii, 1910. [Google Scholar]
- 30.Hoppenbrouwers T, Hodgman JE, Ramanathan A, Dorey F. Extreme and conventional cardiorespiratory events and epidemiologic risk factors for SIDS. J Pediatr 152: 636–641, 2008. [DOI] [PubMed] [Google Scholar]
- 31.Kattwinkel J. Neonatal apnea: pathogenesis and therapy. J Pediatr 90: 342–347, 1977. [DOI] [PubMed] [Google Scholar]
- 32.Khoo MC, Kronauer RE, Strohl KP, Slutsky AS. Factors inducing periodic breathing in humans: a general model. J Appl Physiol 53: 644, 1982. [DOI] [PubMed] [Google Scholar]
- 33.Kirkpatrick SE, Pitlick PT, Naliboff J, Friedman WF. Frank-Starling relationship as an important determinant of fetal cardiac output. Am J Physiol 231: 495–500, 1976. [DOI] [PubMed] [Google Scholar]
- 34.Lee H, Rusin CG, Lake DE, Clark MT, Guin L, Smoot TJ, Paget-Brown AO, Vergales BD, Kattwinkel J, Moorman JR, Delos JB. A new algorithm for detecting central apnea in neonates. Physiol Meas 33: 1, 2012. [DOI] [PMC free article] [PubMed] [Google Scholar]
- 35.Martin RJ, Fanaroff AA, Walsh MC. Neonatal-Perinatal Medicine. New York: Elsevier, 2011. [Google Scholar]
- 36.Martin RJ, Abu-Shaweesh JM, Baird TM. Apnoea of prematurity. Paediatr Respir Rev 5: S377–S382, 2004. [DOI] [PubMed] [Google Scholar]
- 37.Martin RJ, Abu-Shaweesh JM, Baird TM. Pathophysiologic mechanisms underlying apnea of prematurity. Neoreviews 3: e59–e65, 2002. [Google Scholar]
- 38.Milhorn HT, Guyton AC. An analog computer analysis of Cheyne-Stokes breathing. J Appl Physiol 20: 328, 1965. [Google Scholar]
- 39.Peabody JL, Gregory GA, Willis MM, Philip AG, Lucey JF. Failure of conventional monitoring to detect apnea resulting in hypoxemia. Birth Defects Orig Artic Ser 15: 274–284, 1979. [PubMed] [Google Scholar]
- 40.Phelps D, Lindblad A, Bradford J, Wood N, Oden N, Cole C, MacKinnon B, Yaffe A, Everett D, Wright L. Supplemental therapeutic oxygen for prethreshold retinopathy of prematurity (STOP-ROP), a randomized, controlled trial. I: Primary outcomes. Pediatrics 105: 295–310, 2000. [DOI] [PubMed] [Google Scholar]
- 41.Poets CF. Apnea of prematurity: what can observational studies tell us about pathophysiology? Sleep Med 11: 701–707, 2010. [DOI] [PubMed] [Google Scholar]
- 42.Poets CF, Stebbens VA, Samuels MP, Southall DP. The relationship between bradycardia, apnea, and hypoxemia in preterm infants. Pediatr Res 34: 144–147, 1993. [DOI] [PubMed] [Google Scholar]
- 43.Poets C, Pauls U, Bohnhorst B. Effect of blood transfusion on apnoea, bradycardia and hypoxaemia in preterm infants. Eur J Pediatr 156: 311–316, 1997. [DOI] [PubMed] [Google Scholar]
- 44.Poets C, Samuels M, Southall D. Epidemiology and pathophysiology of apnoea of prematurity. Neonatology 65: 211–219, 1994. [DOI] [PubMed] [Google Scholar]
- 45.Poets CF, Stebbens VA, Richard D, Southall DP. Prolonged episodes of hypoxemia in preterm infants undetectable by cardiorespiratory monitors. Pediatrics 95: 860–863, 1995. [PubMed] [Google Scholar]
- 46.Polin RA, Fox WW, Abman SH. Fetal and Neonatal Physiology: Expert Consult (2-vol set). New York: Elsevier Health Sciences, 2011. [Google Scholar]
- 47.Price JF. Unique aspects of heart failure in the neonate. In: Heart Failure in Congenital Heart Disease: From Fetus to Adult, edited by Shaddy RE. New York: Springer, 2011, p. 21–42. [Google Scholar]
- 48.Sands SA, Edwards BA, Kee K, Turton A, Skuza EM, Roebuck T, O'Driscoll DM, Hamilton GS, Naughton MT, Berger PJ. Loop gain as a means to predict a positive airway pressure suppression of Cheyne-Stokes respiration in patients with heart failure. Am J Respir Crit Care Med 184: 1067–1075, 2011. [DOI] [PubMed] [Google Scholar]
- 49.Sands SA, Edwards BA, Kelly VJ, Davidson MR, Wilkinson MH, Berger PJ. A model investigation of the impact of ventilation-perfusion mismatch on oxygenation during apnea in preterm infants. J Theor Biol 264: 657–662, 2010. [DOI] [PubMed] [Google Scholar]
- 50.Sands SA, Edwards BA, Kelly VJ, Davidson MR, Wilkinson MH, Berger PJ. A model analysis of arterial oxygen desaturation during apnea in preterm infants. PLoS Comput Biol 5: e1000588, 2009. [DOI] [PMC free article] [PubMed] [Google Scholar]
- 51.Sands SA, Edwards BA, Kelly VJ, Skuza EM, Davidson MR, Wilkinson MH, Berger PJ. Mechanism underlying accelerated arterial oxygen desaturation during recurrent apnea. Am J Respir Crit Care Med 182: 961–969, 2010. [DOI] [PubMed] [Google Scholar]
- 52.Sands SA, Kelly VJ, Edwards BA, Davidson MR, Wilkinson MH, Berger PJ. A dynamic model for assessing the impact of diffusing capacity on arterial oxygenation during apnea. Respir Physiol Neurobiol 171: 193–200, 2010. [DOI] [PubMed] [Google Scholar]
- 53.Saugstad OD, Aune D. Optimal oxygenation of extremely low birth weight infants: a meta-analysis and systematic review of the oxygen saturation target studies. Neonatology 105: 55–63, 2013. [DOI] [PubMed] [Google Scholar]
- 54.Saunders KB. Oscillations of arterial CO2 tension in a respiratory model: some implications for the control of breathing in exercise. J Theor Biol 84: 163–179, 1980. [DOI] [PubMed] [Google Scholar]
- 55.Saunders KB, Bali HN, Carson ER. A breathing model of the respiratory system: the controlled system. J Theor Biol 84: 135–161, 1980. [DOI] [PubMed] [Google Scholar]
- 56.Severinghaus JW. Simple, accurate equations for human blood O2 dissociation computations. J Appl Physiol 46: 599–602, 1979. [DOI] [PubMed] [Google Scholar]
- 57.Shimizu M, Ono T. Analysis of heart rate variability in neonatal apnea. Acta Neonatologica Japonica 39: 519–525, 2003. [Google Scholar]
- 58.Silverman WA. A cautionary tale about supplemental oxygen: the albatross of neonatal medicine. Pediatrics 113: 394–396, 2004. [DOI] [PubMed] [Google Scholar]
- 59.Silverman WA. The lesson of retrolental fibroplasia. Sci Am 236: 100–107, 1977. [DOI] [PubMed] [Google Scholar]
- 60.Southall D, Levitt G, Richards J, Jones R, Kong C, Farndon P, Alexander J, Wilson A. Undetected episodes of prolonged apnea and severe bradycardia in preterm infants. Pediatrics 72: 541–551, 1983. [PubMed] [Google Scholar]
- 61.Southall D, Richards J, Rhoden K, Alexander J, Shinebourne E, Arrowsmith W, Cree J, Fleming P, Goncalves A, Orme R. Prolonged apnea and cardiac arrhythmias in infants discharged from neonatal intensive care units: failure to predict an increased risk for sudden infant death syndrome. Pediatrics 70: 844–851, 1982. [PubMed] [Google Scholar]
- 62.Southall DP, Richards JM, Lau KC, Shinebourne EA. An explanation for failure of impedance apnoea alarm systems. Arch Dis Child 55: 63–65, 1980. [DOI] [PMC free article] [PubMed] [Google Scholar]
- 63.Stokowski LA. A primer on apnea of prematurity. Adv Neonatal Care 5: 155, 2005. [DOI] [PubMed] [Google Scholar]
- 64.Tehrani FT. A model study of periodic breathing, stability of the neonatal respiratory system, and causes of sudden infant death syndrome. Med Eng Phys 19: 547–555, 1997. [DOI] [PubMed] [Google Scholar]
- 65.VanderVeen DK, Mansfield TA, Eichenwald EC. Lower oxygen saturation alarm limits decrease the severity of retinopathy of prematurity. J AAPOS 10: 445–448, 2006. [DOI] [PubMed] [Google Scholar]
- 66.Vergales BD, Paget-Brown AO, Lee H, Guin LE, Smoot TJ, Rusin CG, Clark MT, Delos JB, Fairchild KD, Lake DE, Moorman R, Kattwinkel J. Accurate automated apnea analysis in preterm infants. Am J Perinatol 31: 157–162, 2014. [DOI] [PMC free article] [PubMed] [Google Scholar]
- 67.Wilkinson MH, Skuza EM, Rennie GC, Sands SA, Yiallourou SR, Horne RS, Berger PJ. Postnatal development of periodic breathing cycle duration in term and preterm infants. Pediatr Res 62: 331, 2007. [DOI] [PubMed] [Google Scholar]
- 68.Wilkinson M, Berger P, Blanch N, Brodecky V. Effect of venous oxygenation on arterial desaturation rate during repetitive apneas in lambs. Respir Physiol 101: 321–331, 1995. [DOI] [PubMed] [Google Scholar]
- 69.Wilkinson M, Berger P, Blanch N, Brodecky V, Jones C. Source of respiratory drive during periodic breathing in lambs. Respir Physiol 104: 115–126, 1996. [DOI] [PubMed] [Google Scholar]
- 70.Wright KW, Sami D, Thompson L, Ramanathan R, Joseph R, Farzavandi S. A physiologic reduced oxygen protocol decreases the incidence of threshold retinopathy of prematurity. Trans Am Ophthalmol Soc 104: 78, 2006. [PMC free article] [PubMed] [Google Scholar]