

Abstract
Abstract
Acute infusion of glucagon-like peptide-1 (GLP-1) has potent effects on blood flow distribution through the microcirculation in healthy humans and rats. A high fat diet induces impairments in insulin-mediated microvascular recruitment (MVR) and muscle glucose uptake, and here we examined whether this could be reversed by GLP-1. Using contrast-enhanced ultrasound, microvascular recruitment was assessed by continuous real-time imaging of gas-filled microbubbles in the microcirculation after acute (5 days) and prolonged (8 weeks) high fat diet (HF)-induced insulin resistance in rats. A euglycaemic hyperinsulinaemic clamp (3 mU min−1 kg−1), with or without a co-infusion of GLP-1 (100 pmol l−1), was performed in anaesthetized rats. Consumption of HF attenuated the insulin-mediated MVR in both 5 day and 8 week HF interventions which was associated with a 50% reduction in insulin-mediated glucose uptake compared to controls. Acute administration of GLP-1 restored the normal microvascular response by increasing the MVR after both 5 days and 8 weeks of HF intervention (P < 0.05). This effect of GLP-1 was associated with a restoration of both whole body insulin sensitivity and increased insulin-mediated glucose uptake in skeletal muscle by 90% (P < 0.05) after 5 days of HF but not after 8 weeks of HF. The present study demonstrates that GLP-1 increases MVR in rat skeletal muscle and can reverse early stages of high fat diet-induced insulin resistance in vivo.
Key points
Acute glucagon-like peptide-1 (GLP-1) infusion reversed the high fat diet-induced microvascular insulin resistance that occurred after both 5 days and 8 weeks of a high fat diet intervention.
When GLP-1 was co-infused with insulin it had overt effects on whole body insulin sensitivity as well as insulin-mediated skeletal muscle glucose uptake after 5 days of a high fat diet, but not after 8 weeks of high fat diet intervention.
Acute GLP-1 infusion did not have an additive effect to that of insulin on microvascular recruitment or skeletal muscle glucose uptake in the control group.
Here we demonstrate that GLP-1 potently increases the microvascular recruitment in rat skeletal muscle but does not increase glucose uptake in the fasting state. Thus, like insulin, GLP-1 increased the microvascular recruitment but unlike insulin, GLP-1 had no direct effect on skeletal muscle glucose uptake.
Introduction
Glucagon-like peptide-1 (GLP-1), secreted from the L-cells in the gut during a meal, is a hormone which potently stimulates glucose-induced insulin secretion (Holst, 2007). In patients with type 2 diabetes mellitus, both the meal-induced secretion of GLP-1 (Toft-Nielsen et al. 2001; Vilsbøll et al. 2001) and the potency by which GLP-1 stimulates glucose-induced insulin secretion is reduced (Kjems et al. 2003). However, the fact that insulin secretion can still be improved by administration of pharmacological amounts of GLP-1 is part of the foundation for the clinical use of GLP-1 receptor agonists in diabetes treatment. GLP-1 also has extra-pancreatic effects. For instance, GLP-1 has been shown to cause vasorelaxation in isolated large vessels in vitro (Golpon et al. 2001; Nyström et al. 2005) and infusion of GLP-1 in rats was recently shown to increase microvascular recruitment (MVR) and increase glucose utilization in muscle via a nitric oxide-dependent mechanism (Chai et al. 2012). Also, GLP-1 may enhance any effects of insulin on MVR. In humans, ingestion of a mixed meal increased the MVR in forearm muscles by ∼100% whereas insulin infusion during a euglycaemic hyperinsulinaemic clamp only increased the MVR by ∼40% (Liu et al. 2009). Thus, the meal-induced rise in endogenous GLP-1 secretion could conceivably explain the larger increase in MVR after the meal compared to the insulin clamp. Insulin resistance is often coupled with endothelial dysfunction where one defect is that insulin action within the microvasculature through the PI3-kinase/Akt/endothelial nitric oxide synthase (eNOS) pathway is attenuated (Kim et al. 2005, 2006) resulting in a decreased insulin-mediated increase in MVR and decreased glucose uptake (Vincent et al. 2003). Insulin-mediated MVR is attenuated in obese subjects (Keske et al. 2009) and obese Zucker rats (Wallis et al. 2002) and is also attenuated by an intralipid infusion in healthy humans (Liu et al. 2009) and in rats (Clerk et al. 2002). In humans, some studies showed that GLP-1 increases whole body glucose disposal in an insulin-independent manner (Gutniak et al. 1992; D'Alessio et al. 1994) while others showed no effect (Toft-Nielson et al. 1996). In addition, it has been repeatedly reported that GLP-1 increases glucose uptake in muscle cell culture in vitro (Gonzalez et al. 2005; Green et al. 2012). In contrast, we recently found no effect of GLP-1 on glucose uptake across a human leg nor an increase in 2-deoxy-glucose uptake in the rat hindlimb muscles despite the fact that GLP-1 increased the MVR (Sjøberg et al. 2014). The aim of the present study was to determine the effect of GLP-1 on the microvasculature in an early onset (5 days) and more prolonged (8 weeks) model of high fat diet-induced insulin resistance. Furthermore, we wanted to investigate whether GLP-1 would have an additive effect to that of insulin with regard to both MVR and skeletal muscle glucose uptake.
Methods
Protocol
Male Sprague–Dawley rats were obtained from Monash farm (Melbourne, Victoria, Australia) for the experiments performed at the University of Tasmania and from Taconic Farms Inc. (Greve, Denmark) for the experiments performed at the University of Copenhagen.
Animals for the control and 5 day high fat diet (HF) experiments arrived at the animal facility at 8–9 weeks of age, 2 weeks before the experiments and were randomly assigned to either the control group or the 5 day HF intervention. Animals for the 8 week HF intervention arrived at 2–3 weeks of age and were immediately randomly assigned to either the control group or HF. The specific experimental diets and water were provided ad libitum. The high fat diet provided was the High Fat Diet for Diet Induced Obesity D12492 (Research diets, Inc., New Brunswick, NJ, USA). Animals were housed at 20–22°C on a 12 h:12 h light–dark cycle. Animals were fasted overnight before experiments. Also on experimental days animals were randomly assigned to receive either an infusion of insulin alone or a co-infusion of glucagon-like peptide-1 (GLP-1) with insulin. On experimental days rats weighed an average of 303 ± 13 g (chow fed controls, n = 32), 315 ± 21 g (5 day HF, n = 19) and 420 ± 8 g (8 week HF, n = 32) and all being 9–11 weeks of age.
The study was approved by the University of Tasmania Ethics Committee and conformed to the guidelines for the care and use of experimental animals as described by the National Health and Medical Research Council (Australia) and the Danish Animal Experimental Inspectorate, and complied with the European Convention for the protection of Vertebrate Animals used for Experiments and Other Scientific Purposes (Council of Europe 123, Strasbourg, France).
Experimental procedure
Rats were anaesthetized with an intraperitoneal injection of pentobarbital sodium (60 mg (kg body wt)−1) with 1:10 Xylocaine. Polyethylene cannulas (PE50, Intramedic, Franklin Lakes, NJ, USA) were inserted into the carotid artery for arterial blood sampling and the jugular veins for continuous administration of anaesthetics, insulin with or without GLP-1, and glucose in one catheter and infusion of microbubbles for measurement of MVR in the other. Anaesthesia was maintained during the experiment by an infusion of aqueous pentobarbital sodium (0.5 mg min−1 (kg body wt)−1). Depth of anaesthesia was assessed by continuous monitoring of mean arterial blood pressure which was kept within a range of 110–120 mmHg by varying the infusion rate of pentobarbital sodium. Sixty minutes after surgery basal blood samples for the determination of plasma concentrations of glucose, insulin and GLP-1 were drawn and the basal MVR was measured. A euglycaemic hyperinsulinaemic clamp was initiated by a constant intravenous infusion of insulin (3 mU min−1 kg−1) (Actrapid; Novo Nordisk, Bagsvaerd, Denmark) with or without GLP-1 (100 pmol kg−1 min−1) (Bachem, Bubendorf, Switzerland). Plasma glucose levels were maintained at fasting levels by infusion of 30% glucose solution. After 60 min of insulin or insulin plus GLP-1 stimulation, blood was sampled for plasma insulin and GLP-1 concentrations. After ∼75 min, the insulin- or insulin plus GLP-1-stimulated MVR was measured. Subsequently, a 1.85 MBq bolus of [14C]2-deoxy-glucose (2-DG) in isotonic saline was administered via the jugular vein. Immediately following the 2-DG injection, an arterial blood sample was drawn by an automated syringe pump at 50 μl min−1 over 10 min to determine the average plasma specific radioactivity of 2-DG as previously described (Merry et al. 2010). At 90 min the gastrocnemius–soleus muscle group was immediately dissected out and freeze clamped for later determination of muscle 2-DG uptake. Subsequently, epididymal fat and individual muscles were dissected out of the contralateral leg and immediately frozen in liquid nitrogen for subsequent biochemical analysis. Animals were killed by cervical dislocation. All tissue samples were stored at −80°C until analysis. The same procedure was repeated both after 5 days and 8 weeks of diet intervention.
Measurement of microvascular recruitment
The MVR was measured across the adductor magnus and semimembranosus muscles, with a real-time contrast-enhanced ultrasound technique using a linear-array transducer connected to an ultrasound system (L9-3 transducer, iU22, Philips Ultrasound, Santa Ana, CA, USA) as previously described (Sjøberg et al. 2011). In short, a transducer was positioned over the left hindlimb and secured for the course of the experiment. A suspension of Definity microbubbles (Lantheus Medical Imaging, Billerica, MA, USA) was infused intravenously (60 μl min−1) using a rotating syringe pump (Vue Ject, BR-inf 100; Bracco, Geneva, Switzerland) to ensure a homogeneous microbubble solution. An infusion time of 10 min was used before MVR recordings were performed to ensure steady state conditions during recordings. Data were exported to a quantification software (QLab, Philips, Andover, MA, USA) for analysis. Regions of interest were drawn clear of connective tissue and large vessels and copied into each file to ensure that regions were identical for each recording. Calculations were made in accordance with Wei et al. (1998) where acoustic intensity (AI) versus time curves were fitted to the exponential function: y = A(1 – exp(−β(t − Bt)), where t is time (seconds), Bt the time used for background subtraction, y is the acoustic intensity at any given t, A is the plateau AI defined as MVR, and β is the flow rate constant (1itres s−1) that determines the rate of rise of AI.
Control experiments were performed in which MVR was measured in the basal state and after a 75 min saline infusion (similar to the insulin and insulin plus GLP-1 infusions). To further elucidate whether GLP-1 in the absence of exogenous insulin would increase the MVR, two subgroups received a saline plus GLP-1 infusion: chow (n = 5) and 8 week HF (n = 5).
In the present study, MVR was measured in the adductor/semimembranosus muscle group and muscle glucose uptake was measured in the gastrocnemius/soleus muscle group. Earlier studies have shown that these muscle groups share a similar muscle fibre type composition of 5% slow oxidative (SO), 37% fast oxidative glycolytic (FOG) and 57% fast glycolytic (FG) muscle fibres in the adductor/semimembranosus muscles, and of 12% SO, 37% FOG and 51% FG muscle fibres in the gastrocnemius/soleus muscles (Laughlin & Armstrong, 1983). It is expected that the two muscle groups share the same responses to insulin with regard to microvascular recruitment and 2-DG uptake.
Blood analysis
Plasma glucose concentrations were measured on a HemoCue 201+ (HemoCue AB, Ängelholm, Sweden) and plasma insulin concentrations were measured using an enzyme-linked immunosorbent rat insulin assay (DRG Diagnostics, Marburg, Germany). Blood for GLP-1 analysis was sampled in ice-chilled Eppendorf tubes and immediately spun down, and plasma was stored at −20°C until analysis. Plasma samples were analysed for total GLP-1 immunoreactivity as previously described (Orskov et al. 1994), using radioimmunoassay (antiserum no. 89390). The assay's detection limit was below 1 pmol l−1 and the intra-assay coefficient of variation below 5% at 20 pmol l−1.
SDS–PAGE and Western blot analyses
Rat soleus muscle (30 mg) was homogenized in ice-cold buffer and lysates were prepared as previously described (Jeppesen et al. 2010). All samples were heated in Laemmli buffer before being subjected to SDS–PAGE and immunoblotting for protein expression and protein phosphorylation.
Antibodies used were: anti-Akt2 (Cell Signaling Technology, Danvers, MA, USA), anti-AS160 (Cell Signaling Technology), anti-eNOS Type III (BD Transduction Laboratories, San Jose, CA, USA), anti-glycogen synthase kinase 3α (anti-GSK-3α) (Upstate Biotechnology, Lake Placid, NY, USA). The primary phospho-specific antibodies were anti-phospho-Akt Ser473 (Cell Signaling Technology), anti-phospho-Akt Thr308 (Cell Signaling Technology), anti-phospho-AS160 (using a PAS160 antibody which primary recognizes Thr642 on TBC1D4) (Cell Signaling Technology), and anti-phospho-eNOS Ser1177 (BD Transduction Laboratories), anti-phospho-GSK-3α Ser21 (Upstate Biotechnology).
In vivo skeletal muscle 2-deoxy-glucose uptake
The gastrocnemius–soleus muscle group was ground under liquid nitrogen and 100 mg muscle was homogenized with 1.5 ml water before free and phosphorylated glucose was isolated by ion-exchange chromatography using anion exchange resin (AG1-X8; Bio-Rad, Hercules, CA, USA). Inorganic liquid scintillation cocktail (Amersham Life Science, Pittsburg, KS, USA) was added to samples, and radioactivity was measured by a β-scintillation counter (Packard TriCarb 2900TR; Perkin-Elmer, Boston, MA, USA). Based on plasma glucose, muscle and plasma 2-DG concentrations, muscle 2-DG glucose uptake, which reflects glucose uptake into the muscle, was calculated as previously described by others (James et al. 1985).
Statistics
Data are presented as means ± SEM and were analysed on Sigma Plot software (version 11; Systat Software, San Jose, CA, USA). Chow fed controls n = 32, 5 day HF n = 19 and 8 week HF n = 32 unless indicated otherwise in the text. Statistical comparison within the groups or between the groups was performed by one-way ANOVA. When significant differences of P ≤ 0.05 were found, the Student–Newman–Keuls test was used to determine significant differences between the various conditions.
Results
Microvascular recruitment
In the control group MVR was significantly increased ∼27% by insulin stimulation and ∼37% by insulin plus GLP-1 (Fig.1A and B). After consumption of the high fat diet, insulin-stimulated MVR was significantly reduced both after 5 days and 8 weeks (Fig.1D, E, G and H). Insulin plus GLP-1 significantly increased MVR ∼25% and ∼37% compared to saline infusion in the 5 day and 8 week HF interventions, respectively (Fig.1D, E, G and H).
Figure 1.
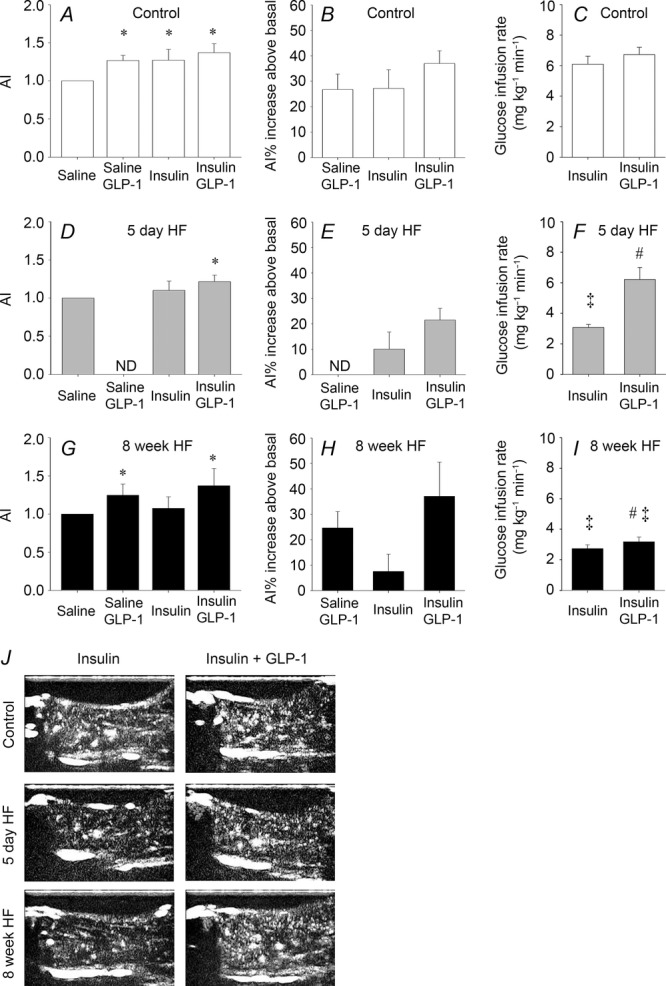
Microvascular recruitment and glucose infusion rate
MVR is presented as the mean acoustic intensity (AI) after 75 min of saline, saline + GLP-1, insulin and insulin + GLP-1 infusions in the hindlimb of control trials, n = 5; n = 5; n = 10 and n = 12 (A), 5 day HF trials, n = 5; n = 7 and n = 7 (D) and 8 week HF trials, n = 5; n = 5, n = 10 and n = 12, respectively (G). Microvascular recruitment is presented as percentage increase from basal after 75 min of saline + GLP-1, insulin and insulin + GLP-1 infusions in controls (B), 5 day HF (E) and 8 week HF (H) interventions. Glucose infusion rate in controls, n = 10 and n = 12 (C), 5 day HF, n = 7 and n = 7 (F) and 8 week HF, n = 10 and n = 12 (I), interventions. Bar graph values are expressed as means of n and error bars are SEM. All stimulated MVR values are normalized to the individual basal value. Different from basal, *P < 0.05. Different from corresponding control, ‡P < 0.05. Different from insulin within intervention, #P < 0.05. Basal SEM values are ±0.05 (saline + GLP-1), ±0.27 (insulin) and ±0.25 (insulin + GLP-1) (A), ±0.43 (insulin) and ±0.28 (insulin + GLP-1) (D) and ±0.57 (saline + GLP-1), ±0.29 (insulin) and ±0.31 (insulin + GLP-1) (G). Microvascular recruitment was not determined (ND) in saline + GLP-1-treated animals (D and E). J, representative presentation of the contrast-enhanced ultrasound image during insulin and insulin + GLP-1 stimulation in the control, 5 day HF and 8 week HF interventions.
In control experiments, where saline was infused, MVR remained similar to basal values both in control and 8 week HF fed animals (data not shown). These observations are similar to our previous findings in both humans and rats (Sjøberg et al. 2011). However, when GLP-1 was co-infused with saline MVR was significantly increased ∼25% both in control and 8 week HF fed animals (Fig.1A, B, G and H).
The mean arterial blood pressure (MAP) 60 min after surgery and before baseline microvascular recruitment measurements (during anaesthesia) was 108 ± 2, 107 ± 4 and 116 ± 2 mmHg in chow (control), 5 day HF and 8 week HF fed animals, respectively. There was no statistical difference between the three groups and the MAP remained at the respective levels within each group throughout the experiments. This is in accordance with a previous study by Premilovac et al. (2013) where MAP was similar in animals fed a high fat diet for 4 weeks compared to controls during anaesthesia. Thus, the MAP for each animal was similar during determination of the microvascular recruitment under basal, and insulin- and insulin plus GLP-1-stimulated conditions.
Blood parameters
Eight weeks of HF increased fasting plasma glucose concentration significantly by ∼25% compared to both control and 5 day HF (Table1). Fasting plasma insulin concentrations increased significantly by ∼100% after 5 days of HF (insulin plus GLP-1 group) and by 150% after 8 weeks of HF (insulin group) (Table1). Insulin and insulin plus GLP-1 infusion increased plasma insulin concentrations in all groups but after 5 day and 8 week HF plasma insulin concentration was higher after 60 min of insulin or insulin plus GLP-1 infusion compared to controls (Table1). Fasting plasma GLP-1 concentrations were negligible in all groups; insulin infusion did not affect the plasma GLP-1 levels, whereas insulin plus GLP-1 infusion increased the plasma GLP-1 concentrations in all groups, respectively.
Table 1.
Body weight and plasma concentrations of glucose, insulin and GLP-1
| Control | 5 day HF | 8 week HF | ||||
|---|---|---|---|---|---|---|
| 0 min | 60 min | 0 min | 60 min | 0 min | 60 min | |
| Insulin infusion | ||||||
| Weight (g) | 303 ± 18 | — | 324 ± 36 | — | 429 ± 13*,** | — |
| Plasma glucose (mmol l−1) | 4.9 ± 0.2 | 5.1 ± 0.2 | 5.3 ± 0.3 | 5.4 ± 0.3 | 6.3 ± 0.4a | 6.0 ± 0.2 |
| Plasma insulin (pmol l−1) | 64 ± 11 | 184 ± 20* | 97 ± 14 | 248 ± 25*,*** | 160 ± 29a | 381 ± 38b |
| Plasma GLP-1 (nmol l−1) | <0.001 | <0.001 | <0.001 | <0.001 | <0.001 | <0.001 |
| Insulin + GLP-1 infusion | ||||||
| Weight (g) | 303 ± 22 | — | 308 ± 28 | — | 408 ± 73*,** | — |
| Plasma glucose (mmol l−1) | 4.7 ± 0.2 | 5.1 ± 0.2* | 5.1 ± 0.4 | 5.4 ± 0.4 | 5.6 ± 0.2*** | 6.0 ± 0.2 |
| Plasma insulin (pmol l−1) | 48 ± 6 | 165 ± 7* | 104 ± 16*** | 271 ± 34*,*** | 71 ± 13 | 260 ± 22*,*** |
| Plasma GLP-1 (nmol l−1) | <0.001 | 2.45 ± 0.88 | <0.001 | 2.88 ± 0.69 | <0.001 | 3.78 ± 0.22 |
Different from basal
P < 0.05. Different from corresponding control
P < 0.05. Different from 5 day HF
P < 0.05.
Different from basal, corresponding control and 5 day HF, all P < 0.05.
Different from basal, corresponding control, 5 day HF and insulin + GLP-1 within intervention, all P < 0.05.
Euglycaemic hyperinsulinaemic clamp
Glucose infusion rate (GIR) averaged 6.1 ± 0.5 mg min−1 kg−1 in the control group (Fig.1C) and was reduced by ∼50% after both 5 days and 8 weeks of HF (Fig.1F and I). Infusion of insulin plus GLP-1 had no additive effect on GIR in the control group (Fig.1C) whereas GIR was normalized after 5 days of HF (Fig.1F). Infusion of insulin plus GLP-1 resulted in a small but significant increase in GIR after 8 weeks of HF compared to the insulin trial but did not normalize GIR after 8 weeks of HF, which remained 50% lower compared to controls (Fig.1C and I).
Insulin-stimulated 2-deoxy-glucose uptake
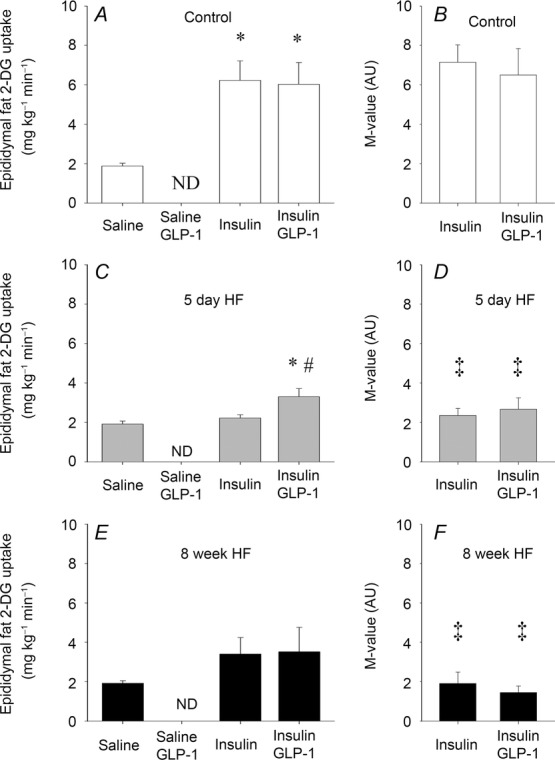
Insulin increased 2-DG uptake in mixed muscle by ∼120% in the control group (Fig.2A) but was attenuated after both 5 days and 8 weeks of HF which only increased by ∼50% compared to saline infusion (Fig.2C and E). Insulin plus GLP-1 had no additive effect to insulin on muscle 2-DG uptake in controls (Fig.2A), whereas insulin plus GLP-1 reversed the attenuation and increased muscle 2-DG uptake by ∼90% after 5 days of HF compared to saline infusion and was similar to the control trial (Fig.2C). In contrast, muscle 2-DG uptake increased by only ∼33% after 8 weeks of HF by insulin plus GLP-1 (Fig.2E). Saline plus GLP-1 infusion had no effect on muscle 2-DG uptake in controls or after 8 weeks of HF, respectively (Fig.2A and E). Insulin infusion increased epididymal fat 2-DG uptake by ∼230% in the control group (Fig.3A) whereas it was negligible after 5 days of HF and increased by ∼75% after 8 weeks of HF (Fig.3C and E). Similar to the observation in skeletal muscle, insulin plus GLP-1 had no additive effect to insulin on epididymal fat 2-DG uptake in controls (Fig.3A). Insulin plus GLP-1 increased epididymal fat 2-DG uptake by ∼75% after 5 days of HF whereas it had no additive effect on epididymal fat 2-DG uptake after 8 weeks of HF (Fig.3C and E).
Figure 2.
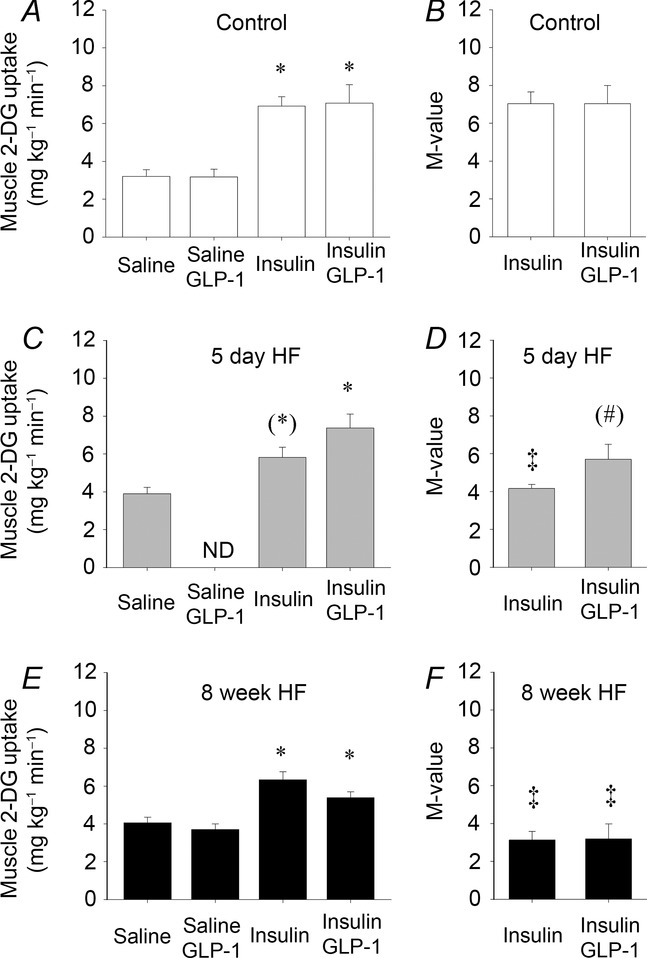
Skeletal muscle 2-deoxy-glucose uptake
Skeletal muscle 2-deoxy-glucose uptake after 90 min infusion of saline (basal), saline + GLP-1, insulin and insulin + GLP-1 infusions in controls, n = 5, n = 5, n = 10 and n = 10 (A), 5 day HF intervention, n = 5, n = 7 and n = 7 (D) and 8 week HF intervention, n = 5, n = 5, n = 10 and n = 12, respectively (E). M-value presented as muscle 2-DG uptake divided by plasma insulin concentration in controls (B), 5 day HF (D) and 8 week HF fed animals (F). AU, arbitrary units. Bar graph values are expressed as means of n and error bars are SEM. Different from basal, *P < 0.05 and (*)P = 0.06. Different from corresponding control group, ‡P < 0.05. Different from insulin within the group, (#)P = 0.07.
Figure 3.
Epididymal fat 2-deoxy-glucose uptake
Epididymal fat 2-deoxy-glucose uptake after 90 min infusion of saline (basal), insulin and insulin + GLP-1 infusions in controls, n = 5, n = 5 and n = 5 (A), 5 day HF intervention, n = 5, n = 5 and n = 5 (D), and 8 week HF intervention, n = 5, n = 5 and n = 5, respectively (E). M-value presented as epididymal fat 2-DG uptake divided by plasma insulin concentration in controls (B), 5 day HF (D) and 8 week HF fed animals (F). Bar graph values are expressed as means of n and error bars are SEM. Different from basal, *P < 0.05 and different from insulin within the group, #P < 0.05. Different from corresponding control group, ‡P < 0.05.
Insulin signalling
eNOS, hexokinase II and GSK-3α protein expression were similar between groups after saline infusion (basal) (Fig.4A–C). Glucose transporter 4 (GLUT-4) protein expression was reduced by ∼25% after 5 days of HF but back to basal levels after 8 weeks of HF (Fig.4D). Eight weeks of HF reduced basal Akt2 protein expression by 40% and TBC1D4 protein expression by 25% compared to controls and 5 day HF, respectively, for both proteins (Fig.4E and F).
Figure 4.

Basal protein expression
A, eNOS; B, hexokinase II (HK II); C, GSK-3α; D, GLUT-4; E, Akt2; F, TBC1D4; and G, representative blots. Protein expression was determined in animals who only received a saline infusion. Protein expression did not change with insulin or insulin + GLP-1 in any of the groups. Bar graph values are expressed as means of n = 5 for each group, and error bars are SEM. Different from control, *P < 0.05; different from 8 week HF trial, †P < 0.05.
Both insulin and insulin plus GLP-1 increased Akt Ser473 and Akt Thr308 phosphorylation in soleus muscle in control animals (Fig.5A and D). Basal Akt Ser473 phosphorylation was reduced (P = 0.05) after 5 days of HF compared to controls. Insulin and insulin plus GLP-1 increased Akt Ser473 phosphorylation but the concentration was lower compared to controls (Fig.5A and B). Insulin and insulin plus GLP-1 stimulation of Akt Thr308 phosphorylation was blunted after 5 days of HF (Fig.5E). Eight weeks of HF reduced basal Akt Ser473 phosphorylation (P = 0.05) compared to control (Fig.5A and C). Insulin and insulin plus GLP-1 increased Akt Ser473 and Akt Thr308 phosphorylation and there was an additive effect of GLP-1 to that of insulin on Akt Ser473 phosphorylation (P = 0.05) (Fig.5C) and a tendency on Akt Thr308 phosphorylation (P = 0.08) (Fig.5F). Furthermore, insulin plus GLP-1-stimulated increases of Akt Ser473 and Akt Thr308 phosphorylation were higher compared to controls (Fig.5A–C and D–F).
Figure 5.
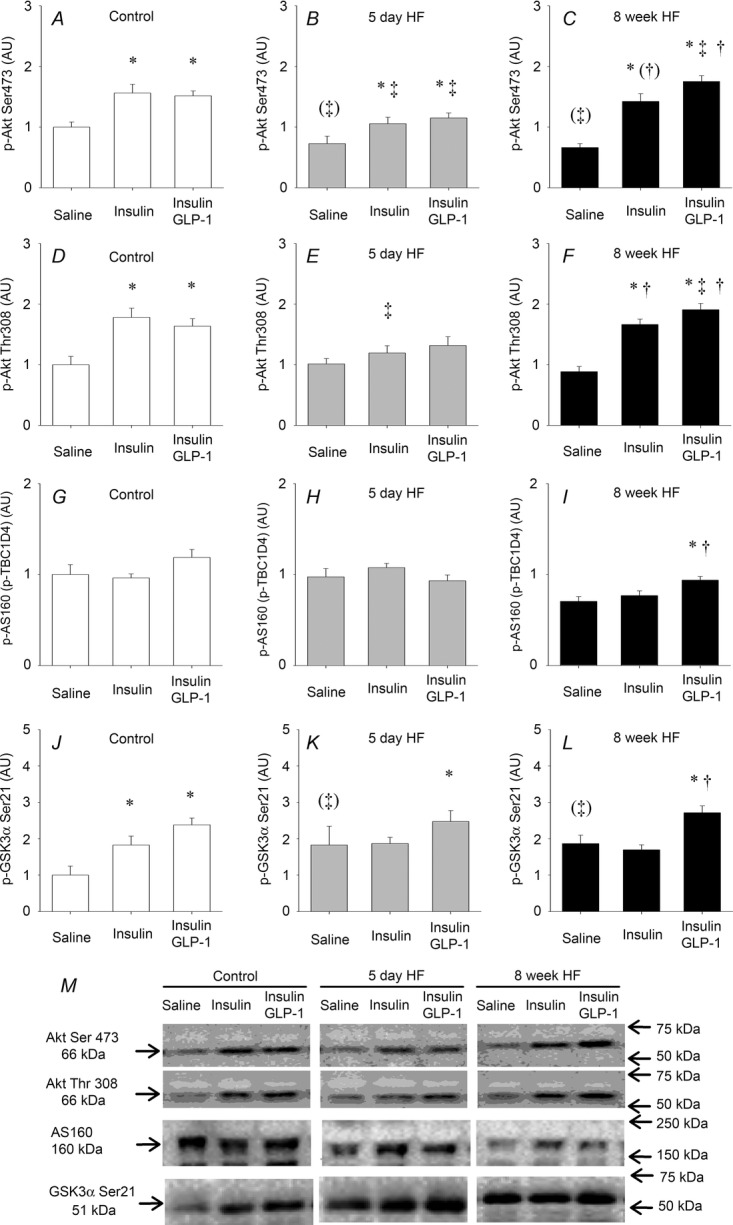
Insulin and insulin + GLP-1-induced phosphorylation of key proteins in the insulin signalling cascade
Phosphorylation of Akt Ser473 and Thr308, AS160 (p-TBC1D4) and GSK-3α Ser21 in soleus muscle in relation to a saline infusion (basal) in controls (A, D, G and J), 5 day HF interventions (B, E, H and K) and 8 week HF interventions (C, F, I and L). Representative blots (M). Bar graph values are expressed as means and error bars are SEM. Different from saline, *P < 0.05. Different from corresponding control, ‡P < 0.05 and (‡)P = 0.05. Different from 5 day HF, †P < 0.05.
Insulin plus GLP-1 did not affect TBC1D4 phosphorylation in soleus muscle in either the control animals or after 5 days of HF (Fig.5G and H). However, insulin plus GLP-1 increased TBC1D4 phosphorylation in soleus muscle after the 8 week HF compared to both saline and insulin infusion within the 8 week HF intervention (Fig.5I).
Both insulin and insulin plus GLP-1 increased GSK-3α Ser21 phosphorylation in soleus muscle in control animals (Fig.5J). Basal GSK-3α Ser21 phosphorylation tended (P = 0.068) to be higher after both 5 days and 8 weeks of HF, respectively (Fig.5K and L). Insulin plus GLP-1 increased GSK-3α Ser21 phosphorylation after both 5 days and 8 weeks of HF, respectively, whereas insulin alone did not (Fig.5K and L).
eNOS Ser1177 phosphorylation did not change in response to either insulin or insulin plus GLP-1. Subsequently, we performed a time course experiment where we observed that eNOS Ser1177 phosphorylation was increased by ∼30% after 20 min of insulin stimulation whereas the phosphorylation was similar to the basal level after 90 min in chow fed animals (Fig.6). Thus, this transient effect of insulin on eNOS Ser1177 phosphorylation could explain the lack of response in the main study as eNOS Ser1177 phosphorylation was only measured at the end of the experiments after 90 min of insulin or insulin plus GLP-1 infusion.
Figure 6.
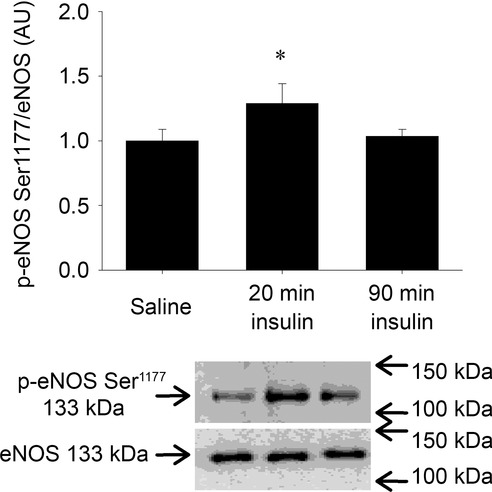
Time course of effects of insulin on eNOS Ser1177 phosphorylation
eNOS Ser1177 phosphorylation in chow fed animals. Bar graph values are means of n = 8 in each group and error bars are SEM. Different from saline, *P < 0.05.
Discussion
In the present study, we demonstrate that acute administration of GLP-1 (7–36 amide) ameliorated both the 5 day and the 8 week high fat diet-induced impairment of insulin action in the microvasculature and restored normal microvascular function by increasing the MVR. Importantly, this effect of GLP-1 on the microcirculation was associated with a restoration of whole body insulin sensitivity as well as skeletal muscle glucose uptake when co-infused with insulin in the 5 day HF intervention. However, in the 8 week HF intervention, GLP-1 did not restore whole body insulin sensitivity or skeletal muscle 2-DG uptake although GLP-1 exerted similar effects on the microcirculation and increased MVR. Thus, the current study illustrates the potent vasoregulatory effects of GLP-1 on the microcirculation in vivo despite diet-induced vascular insulin resistance, together with overt effects on insulin-mediated glucose disposal after 5 days of HF but not after 8 weeks of HF.
The mechanisms by which GLP-1 could exert the microvascular effects in states of diet-induced insulin resistance are unclear. A growing body of evidence indicates that the vasorelaxant effects of GLP-1 are endothelial dependent although one study did not support this conclusion (Nyström et al. 2005). GLP-1 has been reported to have a direct vasorelaxant effect in vitro in large vessels including the rat pulmonary artery (Golpon et al. 2001), and femoral artery (Nyström et al. 2005), and in pig (Hansen et al. 2004) and mouse mesenteric arteries (Ban et al. 2008). Recently Chai et al. (2012) showed in the rat that GLP-1 acts via a nitric oxide (NO)-dependent mechanism similar to that utilized by insulin (Vincent et al. 2003) and that the GLP-1-induced changes in MVR could be blunted by a pre-infusion of the NO inhibitor l-NAME (Chai et al. 2012). These findings are further substantiated by cell culture experiments performed with human umbilical vein endothelial cells (Ding & Zhang, 2012) and bovine aortic endothelial cells (Chai et al. 2012). In these studies, GLP-1-induced eNOS Ser1177 phosphorylation appeared in a dose-dependent manner which was attenuated when cells were incubated with either l-NAME (Ding & Zhang, 2012) or exendin (9–39), a specific GLP-1 receptor antagonist (Chai et al. 2012).
In the present study we were not able to associate the HF-induced attenuation of insulin-mediated changes in MVR with the levels of eNOS Ser1177 phosphorylation as this did not change in response to insulin or GLP-1 in either of the experimental groups. However, the reason for the lack of this effect could be attributed to a transient effect of eNOS Ser1177 phosphorylation in response to insulin as we observed that eNOS Ser1177 phosphorylation was increased by ∼30% after 20 min of insulin stimulation whereas the phosphorylation was similar to the basal level after 90 min in chow fed animals (Fig.6). Thus, the effect of insulin or insulin plus GLP-1 on eNOS Ser1177 phosphorylation may be lost at the 90 min time point in the main experiment.
GLP-1 receptors have been reported to be expressed in heart and vasculature of both humans and rodents, with a specific localization in vascular smooth muscle, endocardium and coronary endothelial cells (Wei & Mojsov, 1995; Bullock et al. 1996) and human skeletal muscle cell culture (Green et al. 2012). However, the GLP-1 receptor appears to be less abundant in intact skeletal muscle in humans (Green et al. 2012), dogs (Sandhu et al. 1999), and rats (Green et al. 2008) and its direct effect on skeletal muscle glucose uptake is not fully elucidated (Pyke & Knudsen, 2013). One group has reported effects of GLP-1 on muscle glucose uptake which was accompanied by an increased glycogen synthase activity in isolated incubated rat soleus muscle (Villanueva-Penacarrillo et al. 1994). Recently Chai et al. (2012) demonstrated GLP-1-stimulated changes in MVR, muscle 125I-insulin clearance and muscle glucose uptake expressed as arterio-venous difference in rats. However, in the present study an intravenous infusion of GLP-1 resulting in a supra-physiological GLP-1 plasma concentration did not increase skeletal muscle glucose uptake when GLP-1 was co-infused with saline despite an increase in MVR. This observation supports our previous findings in humans where a direct infusion of GLP-1 into the femoral artery also did not increase leg glucose uptake despite the occurrence of rapid changes in MVR (Sjøberg et al. 2014). Indeed, in the latter study the local infusion of GLP-1 of 1 and 2 pmol kg−1 min−1 resulted in a supra-physiological GLP-1 concentration of 200 and 400 pmol l−1, respectively. However, in the same study the plasma GLP-1 concentration was also measured in the contralateral leg, where a concentration of ∼100 pmol l−1 was obtained. Here we observed that the GLP-1-mediated increase in MVR was similar in both legs, showing that a physiological plasma GLP-1 concentration is sufficient to increase the MVR. Supra-physiological plasma GLP-1 concentrations have also been found in patients who have been through Roux-en-Y gastric bypass surgery. Here a meal-stimulated increase in endogenous GLP-1 concentration has been observed above 300 pmol l−1 both 3 and 12 months after surgery (Falkén et al. 2011). Furthermore, the non-infused contralateral leg was exposed to a physiological GLP-1 concentration of ∼100 pmol l−1 equivalent to post meal concentrations in healthy and diabetic subjects (Vilsbøll et al. 2003). In accordance with our observation in humans, there was no additive effect of GLP-1 to that of insulin alone on glucose uptake in skeletal muscle when GLP-1 was co-infused with insulin in chow fed animals. Similarly, in isolated rat soleus muscle incubated with GLP-1, insulin or insulin plus GLP-1 there was no glycogenic or glycolytic effect of GLP-1 (Furnsinn et al. 1995) or additive effect of GLP-1 to the effect of insulin on glucose transport (Hansen et al. 1998a). Furthermore, it was shown in type 2 diabetics that a local co-infusion of GLP-1 with insulin did not change the fractional forearm glucose extraction nor the glucose uptake compared to insulin infusion alone despite improved total forearm blood flow (Tesauro et al. 2012). In accordance with this, raising the systemic GLP-1 concentration during a 25 g intravenous glucose tolerance test has also been reported not to affect endogenous insulin action in humans (Toft-Nielson et al. 1996).
Indeed it has previously been demonstrated that insulin-mediated glucose uptake is associated with the increased MVR that occurs upon insulin stimulation in humans (Keske et al. 2009; Sjøberg et al. 2011) and in rats (Vincent et al. 2003; Sjøberg et al. 2011). Furthermore, insulin-mediated increases in MVR and glucose uptake are diminished in obese and type 2 diabetics (Clerk et al. 2007; Keske et al. 2009), and when changes in MVR are attenuated by either an intra-lipid infusion (Clerk et al. 2002; Liu et al. 2011) or an infusion of l-NAME (Vincent et al. 2003) there is a decrease in insulin-mediated glucose uptake.
In the present study, HF-induced attenuation of insulin-mediated changes in MVR was associated with a decreased muscle and epididymal fat glucose uptake in both HF interventions. Interestingly, when microvascular function was restored and MVR increased by the co-infusion of GLP-1 with insulin, whole body insulin sensitivity as well as both muscle and epididymal fat glucose uptake were normalized when animals were fed HF for 5 days but not after 8 weeks of HF. Together these findings indicate that the diet-induced insulin resistance initially affects glucose disposal in muscle by an attenuation of insulin-mediated changes in MVR and that the more prolonged deleterious effects of the high fat diet reside in the myocytes and adipocytes despite normal insulin signalling. While this manuscript was being prepared for publication, Chai et al. published that GLP-1 infusion in rats increased microvascular perfusion and was able to overcome acute lipid-induced insulin resistance of glucose disposal whereas the effect of GLP-1 was much smaller after the 4 week high fat diet (Chai et al. 2014). Thus, these data are in agreement with the results of the present study.
Our observation that the insulin signalling in skeletal muscle was maintained for up to 8 weeks of HF feeding despite a decrease in whole body insulin sensitivity and muscle 2-DG uptake is controversial. Interestingly, the decrease in Akt2 protein expression after the 8 week HF intervention appeared to be compensated by a hyperphosphorylation of both Akt Ser473 and Thr308, and insulin plus GLP-1 infusion had an additive effect to that of insulin alone on Akt phosphorylation on both sites, respectively (Fig.5). From studies in endothelial cells or β-cells it has been shown that GLP-1 increases Akt and eNOS phosphorylation, and subsequent NO production through PKA–PI3 kinase/Akt–eNOS signalling via a GLP-1 receptor-dependent mechanism (Erdogdu et al. 2010). However, the signalling events in skeletal muscle are still elusive.
Supporting our findings Premilovac et al. (2013) recently found attenuated insulin-mediated increases in MVR after 4 weeks of HF feeding, associated with a decreased muscle glucose uptake despite normal muscle insulin signalling in rats. This is further substantiated by studies where 4–5 weeks of HF feeding were shown to have no effect on insulin binding to the insulin receptor (IR) (Boyd et al. 1990; Okamoto et al. 1992), insulin-mediated autophosphorylation (Okamoto et al. 1992) and tyrosine kinase activity (Boyd et al. 1990) in spite of a decrease in whole body insulin sensitivity. In accordance with this, 8 week HF did not attenuate IR activity, IR or insulin receptor substrate 1 (IRS-1) phosphorylation in incubated muscles when compared to controls despite a decreased skeletal muscle 2-DG uptake (Hansen et al. 1998b). In the latter study both insulin-mediated and contraction-stimulated reductions in glucose uptake were attributed to a decrease in cell surface GLUT-4 protein (Hansen et al. 1998b). In the present study it cannot be excluded that the decreased muscle 2-DG uptake in the 5 day HF intervention was due to the reduction in GLUT-4 protein. When changes in MVR were restored by co-infusion of GLP-1 with insulin, however, muscle 2-DG uptake was normalized despite the reduced GLUT-4 protein expression. Furthermore, in spite of normal GLUT-4 protein expression in the 8 week HF intervention, the magnitude of muscle 2-DG uptake in response to insulin was reduced and similar to the 5 day intervention. Thus, GLUT-4 protein expression does not appear to be the limiting factor on glucose uptake in the present study.
Based on our observation that the more distal insulin signalling at the level of TBC1D4 phosphorylation and GSK-3α Ser21 phosphorylation are unaffected by HF feeding and that delivery of insulin and glucose is restored with GLP-1, it seems plausible that the decreased muscle glucose uptake is unrelated to the classical insulin signalling cascade within the skeletal muscle. Thus, the decreased muscle glucose uptake may be related to other factors within the muscle cell or the transport across the plasma membrane. In support of this it has recently been demonstrated that the ras-related C3 botulinum toxin substrate 1/p21-activated kinase (Rac1/PAK) pathway that is involved in insulin-mediated translocation of GLUT-4 within the cell is downregulated and the concomitant glucose uptake is reduced by intralipid infusion in healthy young males and after 14 weeks of a high fat diet in mice (Sylow et al. 2013).
In summary, our findings suggest that GLP-1 is a potent stimulus for microvascular recruitment in skeletal muscle both when animals consume a standard chow diet as well as a high fat diet (60 Energy-%) for up to 8 weeks where diet-induced insulin resistance was apparent. Thus, when GLP-1 was co-infused with insulin it had overt effects on whole body insulin sensitivity as well as insulin-mediated muscle glucose uptake after 5 days of HF, but not after 8 weeks of HF. Although the two HF intervention periods differ markedly, the magnitude of the GLP-1 response was maintained after 8 weeks of HF intervention. Inasmuch as GLP-1-increased microvascular recruitment provides an effective method to enhance nutrient delivery and expansion of the capillary network, we suggest that these microvascular changes are probably important for post meal glucose homeostasis. However, further studies are warranted to elucidate mechanisms and reasons as to why whole body insulin sensitivity and muscle glucose uptake is not restored despite a normalized microvascular function with GLP-1 after 8 weeks of HF.
In conclusion, the present study demonstrates that GLP-1 increases MVR in rat skeletal muscle but does not itself increase muscle glucose uptake. On the other hand, GLP-1 reversed early stages of high fat feeding-induced insulin resistance in vivo. Therefore the ability of GLP-1 to improve microvascular perfusion and counteract insulin resistance may be part of the reason for the effectiveness of GLP-1 analogue-based therapy in type 2 diabetes (Zander et al. 2002; Madsbad et al. 2004).
Acknowledgments
We acknowledge the skilled technical assistance of biomedical laboratory scientists Irene Bech Nielsen (Molecular Physiology Group, University of Copenhagen), Sofie Pilegaard Olesen and Lene Brus Albæk (Dept. of Biomedical Sciences, Panum Institute, Denmark), Eloise Bradley, MSc and Dino Premilovas, PhD (Menzies Research Institute Tasmania).
Glossary
- AI
acoustic intensity
- 2-DG
2-deoxy-glucose
- eNOS
endothelial nitric oxide synthase
- GIR
glucose infusion rate
- GLP-1
glucagon-like peptide-1
- GLUT-4
glucose transporter 4
- GSK-3
glycogen synthase kinase 3
- HF
high fat diet
- MVR
microvascular recruitment
- NO
nitric oxide
Additional information
Competing interests
None declared.
Author contributions
K.A.S., J.J.H., S.R. and B.K. designed the study, K.A.S., S.R., J.F.J. and B.K. carried out the experiments, K.A.S., J.J.H., S.R., J.F.J. and A.-M.L. contributed data, and K.A.S., S.R. and B.K. wrote the paper. All authors contributed to, and approved, the final version of the manuscript. Experiments were conducted at the Section of Molecular Physiology, August Krogh Centre, Department of Nutrition, Exercise and Sports, University of Copenhagen, Denmark and the Menzies Research Institute Tasmania, University of Tasmania, Hobart, Australia.
Funding
This study was supported by grants from The Danish Medical Research Council (FSS), The Lundbeck Research Foundation, The Novo-Nordisk Research Foundation Centre for Basic Metabolic Research and Food, Fitness and Pharma (UNIK) University of Copenhagen. S. Rattigan is supported by a NHMRC (Australia) Senior Research Fellowship. A.-M. Lundsgaard is funded by The Danish Diabetes Academy supported by the Novo Nordisk Foundation.
References
- Ban K, Noyan-Ashraf MH, Hoefer J, Bolz SS, Drucker DJ. Husain M. Cardioprotective and vasodilatory actions of glucagon-like peptide 1 receptor are mediated through both glucagon-like peptide 1 receptor-dependent and -independent pathways. Circulation. 2008;117:2340–2350. doi: 10.1161/CIRCULATIONAHA.107.739938. [DOI] [PubMed] [Google Scholar]
- Boyd JJ, Contreras I, Kern M, Tapscott EB, Downes DL, Frisell WR. Dohm GL. Effect of a high-fat-sucrose diet on in vivo insulin receptor kinase activation. Am J Physiol. 1990;259:E111–E116. doi: 10.1152/ajpendo.1990.259.1.E111. [DOI] [PubMed] [Google Scholar]
- Bullock BP, Heller RS. Habener JF. Tissue distribution of messenger ribonucleic acid encoding the rat glucagon-like peptide-1 receptor. Endocrinology. 1996;137:2968–2978. doi: 10.1210/endo.137.7.8770921. [DOI] [PubMed] [Google Scholar]
- Chai W, Dong Z, Wang N, Wang W, Tao L, Cao W. Liu Z. Glucagon-like peptide 1 recruits microvasculature and increases glucose use in muscle via a nitric oxide-dependent mechanism. Diabetes. 2012;61:888–896. doi: 10.2337/db11-1073. [DOI] [PMC free article] [PubMed] [Google Scholar]
- Chai W, Zhang X, Barrett EJ. Liu Z. Glucagon-like peptide 1 recruits muscle microvasculature and improves insulin's metabolic action in the presence of insulin resistance. Diabetes. 2014;63:2788–2799. doi: 10.2337/db13-1597. [DOI] [PMC free article] [PubMed] [Google Scholar]
- Clerk LH, Rattigan S. Clark MG. Lipid infusion impairs physiologic insulin-mediated capillary recruitment and muscle glucose uptake in vivo. Diabetes. 2002;51:1138–1145. doi: 10.2337/diabetes.51.4.1138. [DOI] [PubMed] [Google Scholar]
- Clerk LH, Vincent MA, Barrett EJ, Lankford MF. Lindner JR. Skeletal muscle capillary responses to insulin are abnormal in late-stage diabetes and are restored by angiogensin-converting enzyme inhibition. Am J Physiol Endocrinol Metab. 2007;293:E1804–E1809. doi: 10.1152/ajpendo.00498.2007. [DOI] [PubMed] [Google Scholar]
- D'Alessio DA, Kahn SE, Leusner CR. Ensinck JW. Glucagon-like peptide 1 enhances glucose tolerance both by stimulation of insulin release and by increasing insulin-independent glucose disposal. J Clin Invest. 1994;93:2263–2266. doi: 10.1172/JCI117225. [DOI] [PMC free article] [PubMed] [Google Scholar]
- Ding L. Zhang J. Glucagon-like peptide-1 activates endothelial nitric oxide synthase in human umbilical vein endothelial cells. Acta Pharmacol Sin. 2012;33:75–81. doi: 10.1038/aps.2011.149. [DOI] [PMC free article] [PubMed] [Google Scholar]
- Erdogdu O, Nathanson D, Sjöholm A, Nyström T. Zhang Q. Exendin-4 stimulates proliferation of human coronary artery endothelial cells through eNOS-, PKA- and PI3K/Akt-dependent pathways and requires GLP-1 receptor. Mol Cell Endocrinol. 2010;325:26–35. doi: 10.1016/j.mce.2010.04.022. [DOI] [PubMed] [Google Scholar]
- Falkén Y, Hellström PM, Holst JJ. Näslund E. Changes in glucose homeostasis after Roux-en-Y gastric bypass surgery for obesity at day three, two months, and one year after surgery: role of gut peptides. J Clin Endocrinol Metab. 2011;96:2227–2235. doi: 10.1210/jc.2010-2876. [DOI] [PubMed] [Google Scholar]
- Furnsinn C, Ebner K. Waldhausl W. Failure of GLP-1(7-36)amide to affect glycogenesis in rat skeletal muscle. Diabetologia. 1995;38:864–867. doi: 10.1007/s001250050365. [DOI] [PubMed] [Google Scholar]
- Golpon HA, Puechner A, Welte T, Wichert PV. Feddersen CO. Vasorelaxant effect of glucagon-like peptide-(7-36)amide and amylin on the pulmonary circulation of the rat. Regul Pept. 2001;102:81–86. doi: 10.1016/s0167-0115(01)00300-7. [DOI] [PubMed] [Google Scholar]
- Gonzalez N, Acitores A, Sancho V, Valverde I. Villanueva-Penacarrillo ML. Effect of GLP-1 on glucose transport and its cell signalling in human myocytes. Regul Pept. 2005;126:203–211. doi: 10.1016/j.regpep.2004.10.002. [DOI] [PubMed] [Google Scholar]
- Green BD, Hand KV, Dougan JE, McDonnell BM, Cassidy RS. Grieve DJ. GLP-1 and related peptides cause concentration-dependent relaxation of rat aorta through a pathway involving KATP and cAMP. Arch Biochem Biophys. 2008;478:136–142. doi: 10.1016/j.abb.2008.08.001. [DOI] [PubMed] [Google Scholar]
- Green CJ, Henriksen TI, Pedersen BK. Solomon TP. Glucagon like peptide-1-induced glucose metabolism in differentiated human muscle satellite cells is attenuated by hyperglycemia. PLoS One. 2012;7:e44284. doi: 10.1371/journal.pone.0044284. [DOI] [PMC free article] [PubMed] [Google Scholar]
- Gutniak M, Orskov C, Holst JJ, Ahren B. Efendic S. Antidiabetogenic effect of glucagon-like peptide-1 (7-36)amide in normal subjects and patients with diabetes mellitus. N Engl J Med. 1992;326:1316–1322. doi: 10.1056/NEJM199205143262003. [DOI] [PubMed] [Google Scholar]
- Hansen BF, Jensen P, Nepper-Christensen E. Skjølstrup B. Effects of glucagon-like peptide-1 (7-36)amide on insulin stimulated rat skeletal muscle glucose transport. Acta Diabetol. 1998a;35:101–103. doi: 10.1007/s005920050112. [DOI] [PubMed] [Google Scholar]
- Hansen L, Hartmann B, Mineo H. Holst JJ. Glucagon-like peptide-1 secretion is influenced by perfusate glucose concentration and by a feedback mechanism involving somatostatin in isolated perfused porcine ileum. Regul Pept. 2004;118:11–18. doi: 10.1016/j.regpep.2003.10.021. [DOI] [PubMed] [Google Scholar]
- Hansen PA, Han DH, Marshall BA, Nolte LA, Chen MM, Mueckler M. Holloszy JO. A high fat diet impairs stimulation of glucose transport in muscle. Functional evaluation of potential mechanisms. J Biol Chem. 1998b;273:26157–26163. doi: 10.1074/jbc.273.40.26157. [DOI] [PubMed] [Google Scholar]
- Holst JJ. The physiology of glucagon-like peptide 1. Physiol Rev. 2007;87:1409–1439. doi: 10.1152/physrev.00034.2006. [DOI] [PubMed] [Google Scholar]
- James DE, Jenkins AB. Kraegen EW. Heterogeneity of insulin action in individual muscles in vivo: euglycemic clamp studies in rats. Am J Physiol. 1985;248:E567–E574. doi: 10.1152/ajpendo.1985.248.5.E567. [DOI] [PubMed] [Google Scholar]
- Jeppesen J, Mogensen M, Prats C, Sahlin K, Madsen K. Kiens B. FAT/CD36 is localized in sarcolemma and in vesicle-like structures in subsarcolemma regions but not in mitochondria. J Lipid Res. 2010;51:1504–1512. doi: 10.1194/jlr.M003756. [DOI] [PMC free article] [PubMed] [Google Scholar]
- Keske MA, Clerk LH, Price WJ, Jahn LA. Barrett EJ. Obesity blunts microvascular recruitment in human forearm muscle after a mixed meal. Diabetes Care. 2009;32:1672–1677. doi: 10.2337/dc09-0206. [DOI] [PMC free article] [PubMed] [Google Scholar]
- Kim JA, Koh KK. Quon MJ. The union of vascular and metabolic actions of insulin in sickness and in health. Arterioscler Thromb Vasc Biol. 2005;25:889–891. doi: 10.1161/01.ATV.0000164044.42910.6b. [DOI] [PubMed] [Google Scholar]
- Kim JA, Montagnani M, Koh KK. Quon MJ. Reciprocal relationships between insulin resistance and endothelial dysfunction: molecular and pathophysiological mechanisms. Circulation. 2006;113:1888–1904. doi: 10.1161/CIRCULATIONAHA.105.563213. [DOI] [PubMed] [Google Scholar]
- Kjems LL, Holst JJ, Vølund A. Madsbad S. The influence of GLP-1 on glucose-stimulated insulin secretion: effects on β-cell sensitivity in type 2 and nondiabetic subjects. Diabetes. 2003;52:380–386. doi: 10.2337/diabetes.52.2.380. [DOI] [PubMed] [Google Scholar]
- Laughlin MH. Armstrong RB. Rat muscle blood flows as a function of time during prolonged slow treadmill exercise. Am J Physiol. 1983;244:H814–H824. doi: 10.1152/ajpheart.1983.244.6.H814. [DOI] [PubMed] [Google Scholar]
- Liu J, Jahn LA, Fowler DE, Barrett EJ, Cao W. Liu Z. Free fatty acids induce insulin resistance in both cardiac and skeletal muscle microvasculature in humans. J Clin Endocrinol Metab. 2011;96:438–446. doi: 10.1210/jc.2010-1174. [DOI] [PMC free article] [PubMed] [Google Scholar]
- Liu Z, Liu J, Jahn LA, Fowler DE. Barrett EJ. Infusing lipid raises plasma free fatty acids and induces insulin resistance in muscle microvasculature. J Clin Endocrinol Metab. 2009;94:3543–3549. doi: 10.1210/jc.2009-0027. [DOI] [PMC free article] [PubMed] [Google Scholar]
- Madsbad S, Schmitz O, Ranstam J, Jakobsen G. Matthews DR. Improved glycemic control with no weight increase in patients with type 2 diabetes after once-daily treatment with the long-acting glucagon-like peptide 1 analog liraglutide (NN2211): a 12-week, double-blind, randomized, controlled trial. Diabetes Care. 2004;27:1335–1342. doi: 10.2337/diacare.27.6.1335. [DOI] [PubMed] [Google Scholar]
- Merry TL, Dywer RM, Bradley EA, Rattigan S. McConell GK. Local hindlimb antioxidant infusion does not affect muscle glucose uptake during in situ contractions in rat. J Appl Physiol (1985) 2010;108:1275–1283. doi: 10.1152/japplphysiol.01335.2009. [DOI] [PubMed] [Google Scholar]
- Nyström T, Gonon AT, Sjöholm A. Pernow J. Glucagon-like peptide-1 relaxes rat conduit arteries via an endothelium-independent mechanism. Regul Pept. 2005;125:173–177. doi: 10.1016/j.regpep.2004.08.024. [DOI] [PubMed] [Google Scholar]
- Okamoto M, Okamoto M, Kono S, Inoue G, Hayashi T, Kosaki A, Maeda I, Kubota M, Kuzuya H. Imura H. Effects of a high-fat diet on insulin receptor kinase and the glucose transporter in rats. J Nutr Biochem. 1992;3:241–250. [Google Scholar]
- Orskov C, Rabenhøj L, Wettergren A, Kofod H. Holst JJ. Tissue and plasma concentrations of amidated and glycine-extended glucagon-like peptide I in humans. Diabetes. 1994;43:535–539. doi: 10.2337/diab.43.4.535. [DOI] [PubMed] [Google Scholar]
- Premilovac D, Bradley EA, Ng HL, Richards SM, Rattigan S. Keske MA. Muscle insulin resistance resulting from impaired microvascular insulin sensitivity in Sprague Dawley rats. Cardiovasc Res. 2013;98:28–36. doi: 10.1093/cvr/cvt015. [DOI] [PubMed] [Google Scholar]
- Pyke C. Knudsen LB. The glucagon-like peptide-1 receptor–or not? Endocrinology. 2013;154:4–8. doi: 10.1210/en.2012-2124. [DOI] [PubMed] [Google Scholar]
- Sandhu H, Wiesenthal SR, MacDonald PE, McCall RH, Tchipashvili V, Rashid S, Satkunarajah M, Irwin DM, Shi ZQ, Brubaker PL, Wheeler MB, Vranic M, Efendic S. Giacca A. Glucagon-like peptide 1 increases insulin sensitivity in depancreatized dogs. Diabetes. 1999;48:1045–1053. doi: 10.2337/diabetes.48.5.1045. [DOI] [PubMed] [Google Scholar]
- Sjøberg KA, Holst JJ, Rattigan S, Richter EA. Kiens B. GLP-1 increases microvascular recruitment but not glucose uptake in human and rat skeletal muscle. Am J Physiol Endocrinol Metab. 2014;306:E355–E362. doi: 10.1152/ajpendo.00283.2013. [DOI] [PMC free article] [PubMed] [Google Scholar]
- Sjøberg KA, Rattigan S, Hiscock N, Richter EA. Kiens B. A new method to study changes in microvascular blood volume in muscle and adipose tissue: real-time imaging in humans and rat. Am J Physiol Heart Circ Physiol. 2011;301:H450–H458. doi: 10.1152/ajpheart.01174.2010. [DOI] [PubMed] [Google Scholar]
- Sylow L, Jensen TE, Kleinert M, Højlund K, Kiens B, Wojtaszewski J, Prats C, Schjerling P. Richter EA. Rac1 signaling is required for insulin-stimulated glucose uptake and is dysregulated in insulin-resistant murine and human skeletal muscle. Diabetes. 2013;62:1865–1875. doi: 10.2337/db12-1148. [DOI] [PMC free article] [PubMed] [Google Scholar]
- Tesauro M, Schinzari F, Adamo A, Rovella V, Martini F, Mores N, Barini A, Pitocco D, Ghirlanda G, Lauro D, Campia U. Cardillo C. Effects of GLP-1 on forearm vasodilator function and glucose disposal during hyperinsulinemia in the metabolic syndrome. Diabetes Care. 2012;36:683–689. doi: 10.2337/dc12-0763. [DOI] [PMC free article] [PubMed] [Google Scholar]
- Toft-Nielsen MB, Damholt MB, Madsbad S, Hilsted LM, Hughes TE, Michelsen BK. Holst JJ. Determinants of the impaired secretion of glucagon-like peptide-1 in type 2 diabetic patients. J Clin Endocrinol Metab. 2001;86:3717–3723. doi: 10.1210/jcem.86.8.7750. [DOI] [PubMed] [Google Scholar]
- Toft-Nielson M, Madsbad S. Holst JJ. The effect of glucagon-like peptide I (GLP-I) on glucose elimination in healthy subjects depends on the pancreatic glucoregulatory hormones. Diabetes. 1996;45:552–556. doi: 10.2337/diab.45.5.552. [DOI] [PubMed] [Google Scholar]
- Villanueva-Penacarrillo ML, Alcantara AI, Clemente F, Delgado E. Valverde I. Potent glycogenic effect of GLP-1(7-36)amide in rat skeletal muscle. Diabetologia. 1994;37:1163–1166. doi: 10.1007/BF00418382. [DOI] [PubMed] [Google Scholar]
- Vilsbøll T, Krarup T, Deacon CF, Madsbad S. Holst JJ. Reduced postprandial concentrations of intact biologically active glucagon-like peptide 1 in type 2 diabetic patients. Diabetes. 2001;50:609–613. doi: 10.2337/diabetes.50.3.609. [DOI] [PubMed] [Google Scholar]
- Vilsbøll T, Krarup T, Sonne J, Madsbad S, Vølund A, Juul AG. Holst JJ. Incretin secretion in relation to meal size and body weight in healthy subjects and people with type 1 and type 2 diabetes mellitus. J Clin Endocrinol Metab. 2003;88:2706–2713. doi: 10.1210/jc.2002-021873. [DOI] [PubMed] [Google Scholar]
- Vincent MA, Barrett EJ, Lindner JR, Clark MG. Rattigan S. Inhibiting NOS blocks microvascular recruitment and blunts muscle glucose uptake in response to insulin. Am J Physiol Endocrinol Metab. 2003;285:E123–E129. doi: 10.1152/ajpendo.00021.2003. [DOI] [PubMed] [Google Scholar]
- Wallis MG, Wheatley CM, Rattigan S, Barrett EJ, Clark AD. Clark MG. Insulin-mediated hemodynamic changes are impaired in muscle of Zucker obese rats. Diabetes. 2002;51:3492–3498. doi: 10.2337/diabetes.51.12.3492. [DOI] [PubMed] [Google Scholar]
- Wei K, Jayaweera AR, Firoozan S, Linka A, Skyba DM. Kaul S. Quantification of myocardial blood flow with ultrasound-induced destruction of microbubbles administered as a constant venous infusion. Circulation. 1998;97:473–483. doi: 10.1161/01.cir.97.5.473. [DOI] [PubMed] [Google Scholar]
- Wei Y. Mojsov S. Tissue-specific expression of the human receptor for glucagon-like peptide-I: brain, heart and pancreatic forms have the same deduced amino acid sequences. FEBS Lett. 1995;358:219–224. doi: 10.1016/0014-5793(94)01430-9. [DOI] [PubMed] [Google Scholar]
- Zander M, Madsbad S, Madsen JL. Holst JJ. Effect of 6-week course of glucagon-like peptide 1 on glycaemic control, insulin sensitivity, and β-cell function in type 2 diabetes: a parallel-group study. Lancet. 2002;359:824–830. doi: 10.1016/S0140-6736(02)07952-7. [DOI] [PubMed] [Google Scholar]