Abstract
Background
Standardized uptake values (SUVs) of fluorine-18 fluorodeoxyglucose PET (18F-FDG PET) are used widely to differentiate residual or recurrent high-grade gliomas from post-treatment changes in patients with brain tumors. The aim of this study is to assess the accuracy of SUV corrected by blood glucose level (SUVgluc) compared with various quantitative methods in this role.
Materials and methods
In 55 patients with dynamic 18F-FDG PET scans, there were 97 glioma lesions: glioblastoma (n=60), grade III gliomas (n=22), grade III or IV gliomas (n=6), grade I/II (n=7), and prebiopsy lesions (n=2). The final actual diagnosis was made on the basis of pathology (n=33) and clinical outcome (n=64). Dynamic 18F-FDG PET scans were processed to generate parametric images of SUVgluc, SUVmax, and glucose metabolic rate (GMR). Lesion to cerebellum ratios (SUVRc) and contralateral white matter ratios (SUVRw) were also measured. The SUVgluc was calculated as SUVmax×blood glucose level/100.
Results
Using the thresholds of SUVmax>4.6, SUVRc>0.9, SUVRw>1.8, SUVgluc>4.3, and GMR>12.2 μmol/min/100 g to represent positivity for viable tumors, the accuracies were the same for the SUVgluc and SUVRw (80%) and were higher than the conventional SUVmax (72%). The area under the receiver operating characteristic curve for the SUVgluc (0.8933) was better than that for the SUVmax (0.8266) (P<0.01) and was similar to those of the GMR (0.8622), SUVRc (0.8606), and SUVRw (0.8981).
Conclusion
These results suggest that SUVgluc may aid in the differentiation of residual or recurrent high-grade tumor from post-treatment changes in patients with abnormal blood glucose levels. The simplicity of the SUVgluc avoids the complexity of kinetic analysis or the requirement of a reference tissue.
Keywords: fluorine-18 fluorodeoxyglucose, glucose-corrected standardized uptake value, high-grade glioma, PET
Introduction
High-grade glioma is the most common primary brain tumor in adults. Until recently, treatment options for patients with high-grade glioma were limited and mainly included surgery and radiation therapy. Previously, chemotherapy played a marginal role and was used as an adjuvant treatment or when there was recurrence 1. Recently, concurrent and adjuvant temozolomide therapy in combination with radiation therapy after surgery has been shown to improve the survival rates of patients with high-grade glioma 2. However, even after various multidisciplinary approaches, tumors frequently recur, presenting as new enhanced lesions and/or signal abnormalities in the T2-weighted images and diffusion-weighted images in conventional MRI 2,3. The detection of high-grade gliomas by serial MRI may be the current clinical standard of practice; however, differentiation between high-grade gliomas and post-treatment changes, such as radiation necrosis, or other treatment effects may be difficult as post-treatment-related changes may mimic high-grade tumors. This imaging pattern on MRI can result in challenging interpretations that impact clinical management decisions. To overcome this difficulty, fluorine-18 fluorodeoxyglucose (18F-FDG) PET imaging has been considered to be a modality that helps provide reliable pathophysiologic and diagnostic data in this clinical setting 4.
The accuracy of 18F-FDG PET using dynamic image acquisition and tracer kinetic modeling has been reported previously 5,6. The model divides 18F-FDG uptake into three compartments with flux rates characterized by kinetic parameters (k1, k2, k3, and k4). As 18F-FDG is a glucose analog, similar kinetic characteristics for endogenous glucose can be calculated. Tracer kinetic modeling with dynamic 18F-FDG PET imaging has been reported to be useful 7; however, it is technically difficult to perform as a routine clinical protocol.
In contrast, the standardized uptake value (SUV) is used widely for clinical PET imaging as it is a simpler method for obtaining a semiquantitative index of the amount of 18F-FDG uptake. However, previous research has raised some limitations on standardization of 18F-FDG uptake on PET images as the SUV can be affected by various factors such as body weight, body surface area, lean body mass, and blood glucose level 8. To improve the accuracy of the SUV in clinical use, a ratio of uptake to a standard reference tissue can potentially improve the diagnostic interpretation by canceling out perturbing factors common to the lesion and the reference site 9. As mentioned previously, increases in blood glucose levels result in decreased 18F-FDG uptake in normal and tumor tissues through competitive inhibition 10. Hence, an SUV correction, using the blood glucose level, may be a method to improve the accuracy of the SUV in the detection of residual or recurrent high-grade tumors.
The aim of this study is to assess the accuracies of: SUV corrected by blood glucose level (SUVgluc), the conventional SUVmax (normalized by body weight), the SUV ratios to the ipsilateral cerebellar cortex (SUVRc) and contralateral white matter (SUVRw), and glucose metabolic rate (GMR) in differentiating the presence of high-grade glioma from post-treatment changes in the monitoring of patients with brain tumors.
Materials and methods
Patients
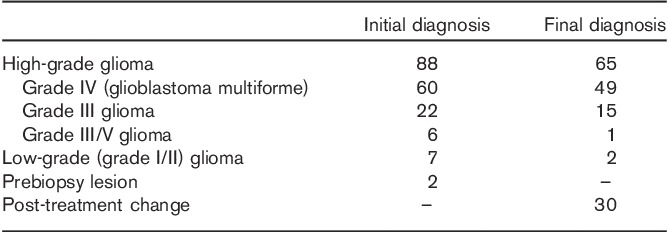
The review and analysis of the data in this study are retrospective in brain tumor patients who consented to an Institutional Review Board-approved protocol for imaging and data collection. Between February 2010 and December 2012, 230 18F-FDG PET brain scans were performed for further evaluation of patients with known brain tumors. Eighty-eight cases were excluded because they were nonglioma cases. A total of 42 cases were subsequently disqualified because of the lack of a concurrent MRI within a month’s interval of the PET, tumor in the contralateral white matter, tumor in the cerebellum, technically limited study because of patient motion artifact, or uncertainty in the final diagnosis (no subsequent tissue biopsy or insufficient follow-up MRI). We also excluded three cases where the patients were on metformin and also had high blood glucose levels (>170 mg/dl) (Table 1). The remaining 95 lesions were entered in this study and the initial diagnoses on the basis of tissue histology were 88 high-grade gliomas (grade III or IV), seven low-grade gliomas (grade I or II), and two unknown prebiopsy in two lesions (Table 2). The clinical indication for the 18F-FDG PET was for the metabolic evaluation of the patient’s brain lesion or lesions, that is detection of residual or recurrent high-grade primary brain tumor. After the PET scan, the patients (lesions) were assigned a final diagnosis (gold standard) on the basis of subsequent histological confirmation (biopsy or resection) or clinical follow-up (frequent MRI) if biopsy results were not available (Table 2). All patients underwent brain MRI with contrast enhancement within 1 month from the date of the 18F-FDG PET scan.
Table 1.
Enrollment summary
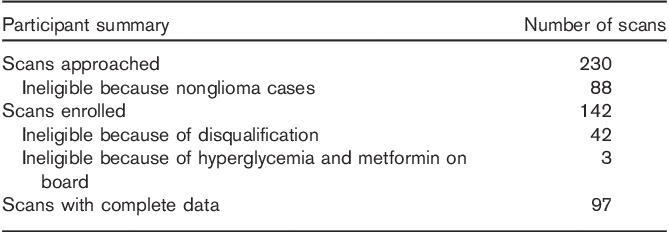
Table 2.
Diagnosis of brain lesions
The GMR and the various semiquantitative methods were compared with the ‘gold standard’. The lesion was categorized as a postoperative or post-therapy change if on follow-up MRI it decreased in size, showed a decrease in enhancement, or became stable for at least 3 months. Otherwise, the lesion was considered to be residual or a recurrent high-grade tumor. Most of the patients with a diagnosis of a high-grade tumor were under continuous chemotherapy and steroids.
18F-FDG PET imaging
In the 55 patients, 84 PET scans were performed on an ECAT EXACT HR+ (Siemens Medical, Washington DC, USA; 15.5 cm axial field of view, 56.2 cm transaxial field of view, 4.5 mm in-plane and axial resolution, 5×5×5 mm cross-slice resolution, 2.425 mm interslice distance) and five scans were performed on a Discovery VCT PET/CT (GE Medical Systems, Waukesha, Wisconsin, USA; 15.7 cm axial field of view, 70 cm transaxial field of view, 4.7×6.3×3.27 mm cross-slice resolution, 3.27 mm interslice distance). Both scanners were American College of Radiology certified to ensure accurate SUV analysis. All patients were instructed to fast for at least 6 h before their scan. Blood glucose levels were measured before the 18F-FDG injection. The patients were positioned in the scanner in a quiet dim room and kept in an unstimulated condition. A 10 min transmission scan obtained with external sources of 68Ge or a low-dose computed tomography (CT) was used for attenuation correction. Patients were injected with 18F-FDG 370 MBq (10 mCi±10%) intravenously and a 30-frame dynamic image acquisition for 60 min was simultaneously initiated: 12 frames at 10 s/frame, four frames at 30 s/frame, and 14 frames at 4 min/frame. The image data were reconstructed using the iterative ordered subset expectation maximization (OSEM) method [four iterations, 16 subsets, zoom=2.5, brain mode on, all pass (ramp) filter, kernel full-width at half-maximum size of 4.0 mm, axial filtering off, and scatter correction on] generating 128×128 image matrices (2.06×2.06 mm pixel size) for each time frame. For plasma radioactivity measurements, an arterialized venous blood sampling was obtained at 10 min after the 18F-FDG injection using a heated hand box from the University of Vermont. The blood samples were centrifuged and the plasma radioactivity was measured in a gamma well counter to correctly scale the image-derived input function that was obtained from the carotid vessels in the dynamic image data 11.
Parametric images of GMR were generated using the Patlak method applied to the 3–36 min scan interval, a single plasma glucose level, and the assumed lumped constant of 1. Parametric SUV images were generated by summing the last 30 min of the dynamic scan and normalized by the patient’s body weight. Parametric SUVgluc images were calculated by multiplying each parametric SUV image pixel by the blood glucose level/100. Both the GMR and the SUV images were coregistered to a recent (<1 month) brain contrast MRI using mutual information-based software written in IDL (ExelisVisual Information Solutions, Boulder, Colorado, USA).
Image analysis
All images were reviewed visually and further analyzed using the Agfa Impax software (Mortsel, Belgium) by board-certified nuclear medicine physicians and neuroradiologists. The lesion was identified on the MRI and a corresponding region of interest (ROI) was drawn manually on the coregistered transaxial parametric PET images (GMR, SUVmax). The maximum pixel value within the ROI of the lesion was recorded for GMR, SUVmax, and SUVgluc. The average SUV ROI values were used for the reference structures (ipsilateral cerebellum and contralateral white matter) that were used to calculate the ratios.
Statistical analysis
All data were expressed as mean±SD. Differences were analyzed using the paired t-test (two tailed) and considered to be significant at a P-value less than 0.05. To analyze the accuracy of detecting the presence or absence of high-grade tumors, the various quantitative methods were compared with the final true diagnosis on the basis of pathological results or clinical outcome. Appropriate threshold values for each method were selected arbitrarily on the basis of an equal balance in sensitivity and specificity. To avoid the effects of the selected threshold values, the diagnostic accuracies were compared using receiver operating characteristic (ROC) analysis with ROCKIT (1.1B2; University of Chicago, Chicago, Illinois, USA).
Results
Histopathological analysis and patient follow-up
From the total of 97 lesions, 33 were subjected to biopsy or either partial, subtotal, or gross total resection within 6 months after 18F-FDG PET, which allowed the final diagnoses to be confirmed pathologically. The other 64 lesions were diagnosed clinically through follow-up with contrast-enhanced MRI images taken at intervals of several months.
In 18 lesions, the GMR was not available because of the absence of a dynamic brain acquisition, difficulties in blood draw, or lack of calibration between the well counter and the scanner. The SUVmax and SUVgluc were not available in one patient because of a lack of calibration between the dose calibrator and the scanner. The detailed final true diagnosis is presented in Table 2. Post-treatment changes included radiation injury and postsurgical changes.
Diagnostic value of GMR, SUV, SUVgluc, SUVRc, and SUVRw
Results from the final true diagnosis were compared with the quantitative and semiquantitative results from 18F-FDG PET imaging (Table 3). There was clear separation of the mean values of SUVmax, SUVRc, SUVRw, SUVgluc, and GMR between the presence of high-grade glioma and postoperative change or low-grade glioma (Fig. 1). All methods were statistically significant (P<0.01).
Table 3.
Characteristics of brain lesions
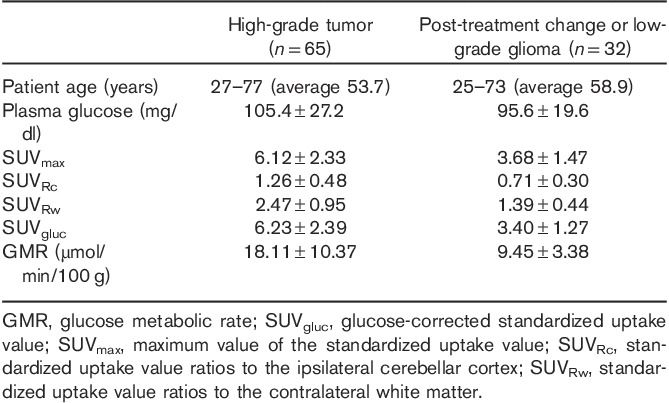
Fig. 1.
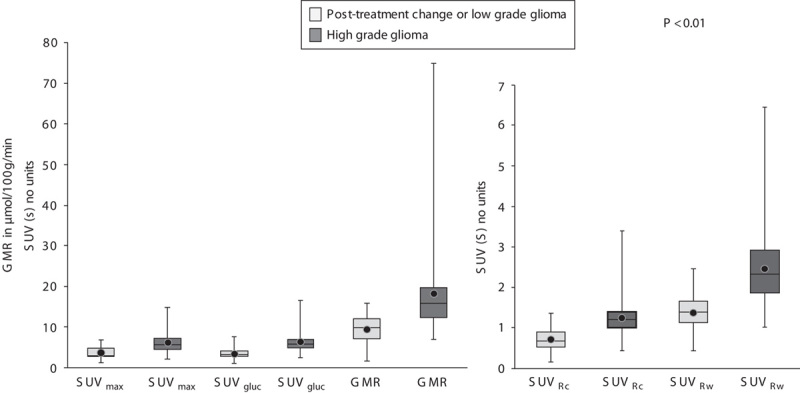
Box and whisker plots of SUVmax, SUVRc, SUVRw, SUVgluc, and GMR for post-treatment change and low-grade glioma and for high-grade glioma. The difference in the mean values between two categories was significant for all the methods tested. 18F-FDG, fluorine-18 fluorodeoxyglucose; GMR, glucose metabolic rate; ROC, receiver operating characteristic curve; SUVgluc, glucose-corrected standardized uptake value; SUVmax, maximum value of the standardized uptake value; SUVRc, standardized uptake value ratios to the ipsilateral cerebellar cortex; SUVRw, standardized uptake value ratios to the contralateral white matter.
The results of the ROC analysis (Fig. 2) showed that the SUVgluc was a more reliable method than the conventional SUVmax method for distinguishing high-grade gliomas from post-treatment changes and low-grade gliomas (P=0.0029). However, the SUVgluc was not significantly different from the SUVRc, SUVRw, or GMR. Using a threshold of 4.3 for the SUVgluc, the sensitivity was 80% (52/65), specificity was 81% (25/31), and accuracy was 80% (77/96) (Table 4).
Fig. 2.
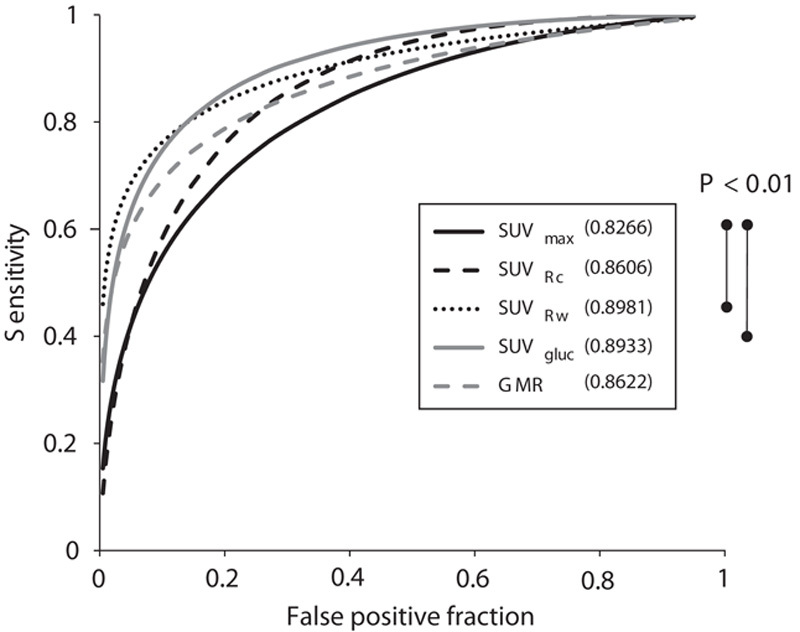
The ROC curves of SUVmax, SUVRc, SUVRw, SUVgluc, and GMR. SUVRw, and SUVgluc have better areas under the curve (0.8981 and 0.8933, respectively) than the conventional SUVmax method (P<0.01) for distinguishing high-grade glioma from post-treatment change and low-grade glioma. The comparison between the other methods was not statistically significant. For abbreviations, see Fig. 1 legend.
Table 4.
Receiver operating curve analysis for predicting viable high-grade gliomas

There were 13 false-negative lesions for the SUVgluc where the high-grade gliomas had SUVgluc of equal to or less than 4.3, but were positive on the basis of pathology (n=4) and clinical outcome (n=9). The pathological or clinical diagnoses were glioblastoma multiforme (GBM) (n=10) and anaplastic astrocytoma (n=3). In 10 of the 13 lesions, the conventional SUVmax was also false negative. The blood glucose in this group was between 71 and 190 mg/dl.
There were six patients with false-positive lesions using the SUVgluc where the SUVgluc was greater than the 4.3 threshold but the lesions were negative for high-grade glioma on the basis of pathological confirmation (n=1) and clinical follow-up (n=5). Four out of six patients had a history of surgery or radiation therapy within 2 months before the PET scan. Five out of six patients also had a false-positive conventional SUVmax. The blood glucose level in this group was between 82 and 121 mg/dl.
On the ROC curve analysis (Fig. 2), the area under curve for SUVgluc, SUVRc, SUVRw, and GMR were 0.8933, 0.8606, 0.8981, and 0.8622, respectively. The conventional SUVmax had the lowest area under the ROC curve of 0.8266. The sensitivity, specificity, and accuracy are shown in Table 4.
The parametric images of GMR visually showed more noise compared with the SUV images. This is expected as the GMR values are derived from the Patlak graphical method. SUV and SUVgluc parametric images were relatively less noisy as they are simply rescaled summed images and only differ in their intensity scaling factor. A patient with high-grade glioma correctly identified by a parametric SUVgluc and GMR image, but incorrectly identified as post-treatment change by SUVmax is shown in Fig. 3. A patient with post-treatment changes correctly identified by a parametric SUVgluc and GMR image, but incorrectly identified as high-grade tumor by SUVmax is shown in Fig. 4.
Fig. 3.
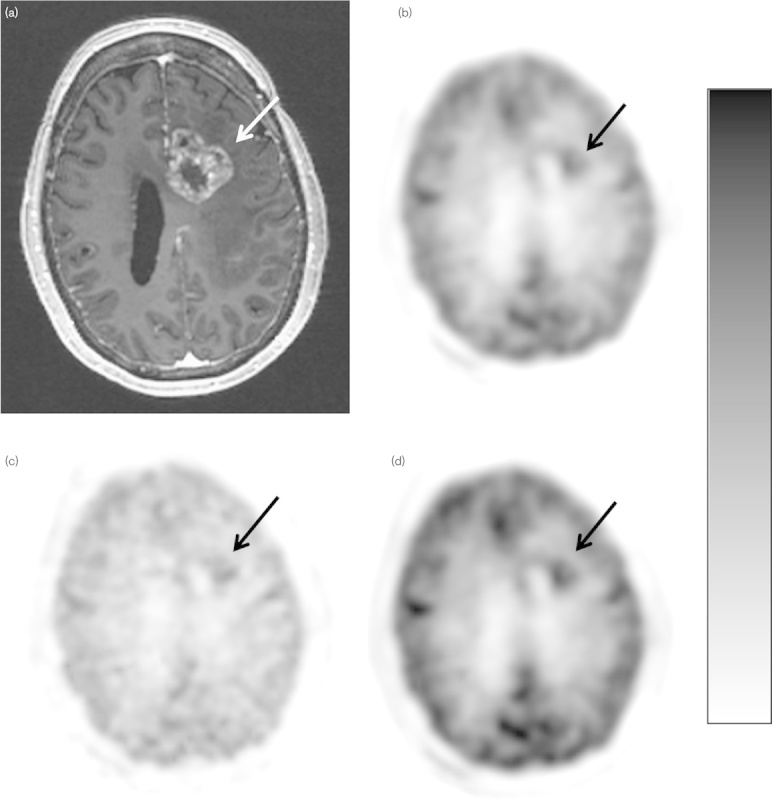
Scanning images of a 55-year-old woman with possible recurrent glioblastoma, status postgross total resection, and chemoradiation. (a) Postcontrast axial T1-weighted MR image shows enhancement in the left frontal lobe (arrow). (b) SUVmax axial 18F-FDG PET image with lesion uptake=3.91 (arrow). (c) GMR parametric axial 18F-FDG PET image shows focal uptake [15.35 µmol glucose/min/100 g (arrow)]. (d) Axial SUVgluc 18F-FDG PET image, measured uptake value=5.74 (arrow). For abbreviations, see Fig. 1 legend.
Fig. 4.
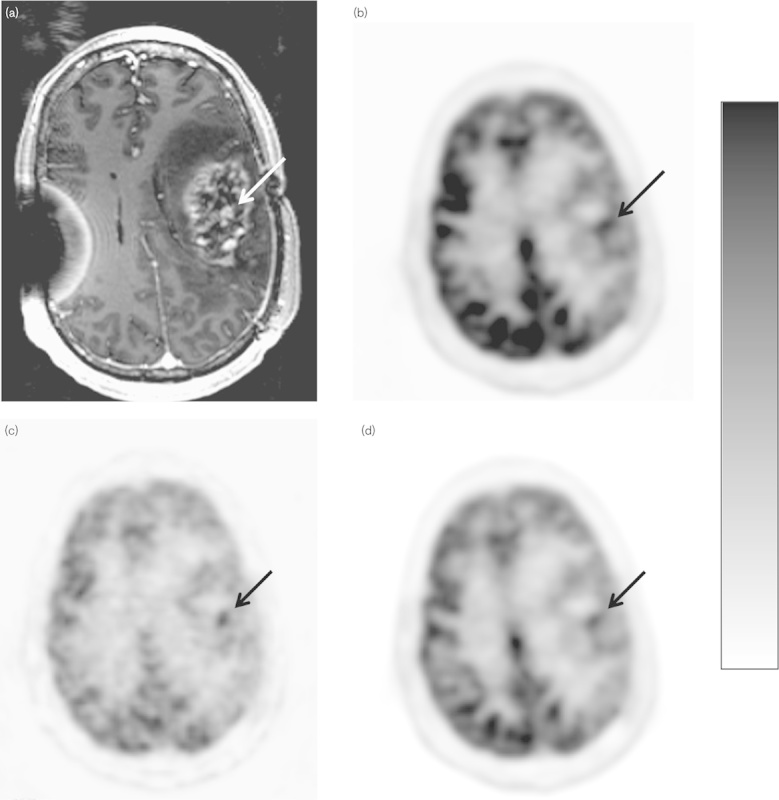
Scanning images of a 43-year-old man with high-grade glioma, status postgross total resection and chemoradiation. (a) Postcontrast axial T1-weighted MR image shows enhancement in the left frontoparietal area (arrow). (b) SUVmax axial 18F-FDG PET parametric image, lesion uptake=6.54 (arrow). (c) GMR parametric axial 18F-FDG PET image shows focal uptake [10.21 µmol glucose/min/100 g (arrow)]. (d) Axial SUVgluc 18F-FDG PET image, measured uptake value=4.25 (arrow). For abbreviations, see Fig. 1 legend.
Discussion
Differentiation of high-grade tumors from post-treatment changes can be challenging because of the similar appearance of contrast enhancement on MRI. Postsurgical changes, postradiation changes, and pseudoprogression after chemotherapy can appear similar to residual or recurrent high-grade gliomas. Therefore, standard MRI cannot accurately distinguish between these two entities 12. There are advanced MRI techniques, such as proton MR spectroscopy (1H-MRS) and perfusion MRI, which show promise in distinguishing recurrent glioma from treatment effect 13–15. However, 1H-MRS has limited value in detecting small tumors and in evaluating lesions adjacent to scalp, ventricles, calcified structures, surgical clips, and hemorrhage. Limitations of perfusion MRI include the possible underestimation of tumor perfusion because of contrast leakage through an impaired blood–brain barrier 16. 18F-FDG PET and more recently 18F-FDG PET/CT have been used to help distinguish these lesions.
The fundamental principle that there is increased metabolism in malignant cells compared with normal or benign tissues can also be applied in gliomas. Another theoretical advantage for PET is that alterations in tumor cell metabolism may show earlier changes compared with anatomic changes in size when a tumor responds to therapy. In addition, some therapeutic agents are cytostatic rather than cytoreductive, making post-treatment evaluation challenging when only morphologic imaging modalities are used.
Formal quantitative 18F-FDG imaging such as the GMR method in this study has previously been reported to be useful 7. One proposed explanation is that malignant cells have a higher concentration of hexokinase, resulting in a higher rate of glycolysis compared with normal tissues and benign lesions 17. Goldman et al. 18 reported that the GMR correlates with the histopathological malignancy grade in brain tumors. In accordance with their observation, we obtained similar results. However, the technical requirements for a quantitative study are complex and time consuming and not feasible for routine clinical imaging. As an alternative to the calculation of the GMR, the SUVmax is used widely as a simple metric of 18F-FDG uptake. However, our results of ROC analysis showed that the area under curve of the SUVmax was lower than the other methods that we applied to the brain lesions. To overcome the limitations of the SUVmax, many alternative semiquantitative methods have been reported in the evaluation of brain gliomas with 18F-FDG PET 4,18–22.
A variety of biologic and technical factors can affect the SUV measurements. Some factors, such as blood glucose level and muscular activity, can be controlled at the time of tracer administration. However, most are impossible to define in any individual case. Comparison of uptake with a standard reference tissue, if available, can potentially improve the diagnostic performance of a method by canceling out perturbing factors common to the lesion and the reference tissue 9. In our study, we chose the ipsilateral cerebellar cortex and contralateral white matter as reference tissues because they have a relatively stable metabolism. Our results showed that the SUVRc method had a ROC area under the curve similar to that of the GMR method.
We corrected the SUV with the patients’ blood glucose level as another method for compensation for variations and effect of blood glucose on 18F-FDG uptake, similar to the underlying calculation of the GMR from the Patlak method. Our results show that the SUVmax has the lowest diagnostic accuracy among the various methods and the SUVgluc and the SUVRw show the highest accuracies. These results are similar to those of the previous studies differentiating malignant brain lesions from benign lesions 23. Although there are several previous publications discussing the effects of abnormal blood glucose levels on tumor and normal brain uptake 24, no previous publication has reported the application of the SUVgluc to differentiate residual or recurrent high-grade glioma from post-treatment change. This study shows that SUVgluc may be a reliable and simple method because the patient’s blood glucose level is usually available as it is measured as part of routine clinical protocols. Correction of the SUV by the blood glucose level is also mentioned in the EANM procedure guidelines for PET brain imaging 25; however, no specific correction methods or threshold SUVgluc values are presented. Moreover, the SUVgluc requires no additional reference ROI to be defined in its calculation and can be generated automatically as a parametric image.
Patients with gliomas are frequently treated with steroids to reduce brain edema; however, steroids can cause diabetes mellitus and increase blood glucose level, which can then affect the 18F-FDG uptake in the brain. In our study, four patients with false-negative SUVmax had high blood glucose level (>140 mg/dl), but were diagnosed successfully by the SUVgluc. However, antidiabetic drugs may cause hypoglycemia. There were three lesions with false-positive SUVmax in patients with hypoglycemia (<70 mg/dl); however, these lesions were diagnosed correctly by the SUVgluc.
Our study has several limitations. First, the patients’ true histological diagnosis at the time of each imaging study was rarely available. The time between 18F-FDG PET scan and biopsy or resection varied from several days to 6 months depending on the patients’ status and other imaging findings. Even if the patients undergo a biopsy or resection shortly after the PET scan, the exact anatomic location of the specimen may not correspond to the location of abnormal imaging findings. Second, without tissue biopsy, use of the clinical follow-up and MRI follow-up has its own limitations. We considered the lesion to represent post-treatment changes or residual low-grade glioma if it became smaller, had an interval decrease in enhancement, or was stable on MRI for at least 3 months. However, this MRI appearance may also be found in patients with tumor progression (pseudoresponse) following angiogenic therapy such as bevacizumab 26. In contrast, the typical MRI findings for tumor progression, such as interval increased enhancement and edema, can be seen in pseudoprogression, when there is actually no tumor progression. Pseudoprogression may be a result of multiple confounding factors that include radiation injury, temozolomide-based chemoradiation, and local glioma therapy. Repeat MRIs can be useful to diagnose pseudoprogression and pseudoresponse as very rapid changes are not typically seen in real tumor progression 27. Third, 13 patients in our study were administered metformin, which may affect 18F-FDG uptake such that it cannot be corrected by adjusting for their blood glucose level. Metformin is an oral antidiabetic drug in the biguanide class and used widely for the treatment of type 2 diabetes. It is also known for its antitumor effect on glioma 28 and could be used with temozolomide-based chemotherapy as an adjuvant treatment for high-grade gliomas 29. Tissue glucose utilization is believed to be enhanced by metformin. In-vivo and in-vitro studies have shown that metformin stimulates the insulin-induced glucose uptake into skeletal muscle and adipocytes in both diabetic individuals and animal models. It has also been shown that insulin-mediated visceral fat glucose uptake is enhanced by metformin monotherapy, which is believed to be related to enhancement in visceral fat insulin sensitivity. There have been recommendations to discontinue metformin at least 12 h before carrying out a PET study 30. We excluded three lesions in patients who were on metformin and had a high blood glucose level (>170 mg/dl) because metformin produces a dose-dependent increase in tumor glucose uptake 31 and the high blood glucose level causes the SUVgluc to be overcorrected.
Despite several limitations, the results in our study confirmed that SUVgluc is more reliable than the conventional SUV. This method saves the complexity of calculating the GMR or defining an additional reference region. The SUVgluc method may aid in the differentiation between residual or recurrent high-grade glioma and post-treatment changes.
Acknowledgements
This research was supported in part by the Wagner Torizuka Fellowship Program and Gifu Prefectural General Medical Center to A. Nozawa and by grants from National Institutes of Health (NIH3P30CA023100-25S8) and from UC San Diego Brain Cancer Research Funds to S. Kesari.
Conflicts of interest
There are no conflicts of interest.
References
- 1.Tezcan Y, Koc M. 3-D conformal radiotherapy with concomitant and adjuvant temozolomide for patients with glioblastoma multiforme and evaluation of prognostic factors. Radiol Oncol 2011; 45:213–219. [DOI] [PMC free article] [PubMed] [Google Scholar]
- 2.Kim YH, Oh SW, Lim YJ, Park CK, Lee SH, Kang KW, et al. Differentiating radiation necrosis from tumor recurrence in high-grade gliomas: assessing the efficacy of 18F-FDG PET, 11C-methionine PET and perfusion MRI. Clin Neurol Neurosurg 2010; 112:758–765. [DOI] [PubMed] [Google Scholar]
- 3.Stupp R, Mason WP, van den Bent MJ, Weller M, Fisher B, Taphoorn MJ, et al. European Organisation for Research and Treatment of Cancer Brain Tumor and Radiotherapy Groups; National Cancer Institute of Canada Clinical Trials Group. Radiotherapy plus concomitant and adjuvant temozolomide for glioblastoma. N Engl J Med 2005; 352:987–996. [DOI] [PubMed] [Google Scholar]
- 4.Kosaka N, Tsuchida T, Uematsu H, Kimura H, Okazawa H, Itoh H. 18F-FDG PET of common enhancing malignant brain tumors. Am J Roentgenol 2008; 190:W365–W369. [DOI] [PubMed] [Google Scholar]
- 5.Wu HM, Bergsneider M, Glenn TC, Yeh E, Hovda DA, Phelps ME, et al. Measurement of the global lumped constant for 2-deoxy-2-[18F]fluoro-d-glucose in normal human brain using [15O]water and 2-deoxy-2-[18F]fluoro-d-glucose positron emission tomography imaging. A method with validation based on multiple methodologies. Mol Imaging Biol 2003; 5:32–41. [DOI] [PubMed] [Google Scholar]
- 6.Phelps ME, Huang SC, Hoffman EJ, Selin C, Sokoloff L, Kuhl DE. Tomographic measurement of local cerebral glucose metabolic rate in humans with (F-18)2-fluoro-2-deoxy-d-glucose: validation of method. Ann Neurol 1979; 6:371–388. [DOI] [PubMed] [Google Scholar]
- 7.Kimura N, Yamamoto Y, Kameyama R, Hatakeyama T, Kawai N, Nishiyama Y. Diagnostic value of kinetic analysis using dynamic 18F-FDG-PET in patients with malignant primary brain tumor. Nucl Med Commun 2009; 30:602–609. [DOI] [PubMed] [Google Scholar]
- 8.Boellaard R. Standards for PET image acquisition and quantitative data analysis. J Nucl Med 2009; 50:11S–20S. [DOI] [PubMed] [Google Scholar]
- 9.Britz-Cunningham SH, Millstine JW, Gerbaudo VH, Britz-Cunningham SH, Millstine JW, Gerbaudo VH, et al. Improved discrimination of benign and malignant lesions on FDG PET/CT, using comparative activity ratios to brain, basal ganglia, or cerebellum. Clin Nucl Med 2008; 33:681–687. [DOI] [PubMed] [Google Scholar]
- 10.Lee SM, Kim TS, Lee JW, Kim SK, Park SJ, Han SS. Improved prognostic value of standardized uptake value corrected for blood glucose level in pancreatic cancer using F-18 FDG PET. Clin Nucl Med 2011; 36:331–336. [DOI] [PubMed] [Google Scholar]
- 11.Schiepers C, Hoh C, Dahlbom M, Wu H, Phelps M. Factor analysis for delineation of organ structures, creation of input and output functions, and standardization of multi-center kinetic modeling. Proc SPIE 1999; 3661:1343–1350. [Google Scholar]
- 12.Yang I, Huh NG, Smith ZA, Han SJ, Parsa AT. Distinguishing glioma recurrence from treatment effect after radiochemotherapy and immunotherapy. Neurosurg Clin N Am 2010; 21:181–186. [DOI] [PubMed] [Google Scholar]
- 13.Hu LS, Baxter LC, Smith KA, Feuerstein BG, Karis JP, Eschbacher JM, et al. Relative cerebral blood volume values to differentiate high-grade glioma recurrence from posttreatment radiation effect: direct correlation between image-guided tissue histopathology and localized dynamic susceptibility-weighted contrast-enhanced perfusion MR imaging measurements. Am J Neuroradiol 2009; 30:552–558. [DOI] [PMC free article] [PubMed] [Google Scholar]
- 14.Barajas RF, Jr, Chang JS, Segal MR, Parsa AT, McDermott MW, Berger MS, Cha S. Differentiation of recurrent glioblastoma multiforme from radiation necrosis after external beam radiation therapy with dynamic susceptibility-weighted contrast-enhanced perfusion MR imaging. Radiology 2009; 253:486–496. [DOI] [PMC free article] [PubMed] [Google Scholar]
- 15.Bobek-Billewicz B, Stasik-Pres G, Majchrzak H, Zarudzki L. Differentiation between brain tumor recurrence and radiation injury using perfusion, diffusion-weighted imaging and MR spectroscopy. Folia Neuropathol 2010; 48:81–92. [PubMed] [Google Scholar]
- 16.Dhermain FG, Hau P, Lanfermann H, Jacobs AH, van den Bent MJ. Advanced MRI and PET imaging for assessment of treatment response in patients with gliomas. Lancet Neurol 2010; 9:906–920. [DOI] [PubMed] [Google Scholar]
- 17.Wu H, Dimitrakopoulou-Strauss A, Heichel TO, Lehner B, Bernd L, Ewerbeck V, et al. Quantitative evaluation of skeletal tumours with dynamic FDG PET: SUV in comparison to Patlak analysis. Eur J Nucl Med 2001; 28:704–710. [DOI] [PubMed] [Google Scholar]
- 18.Goldman S, Levivier M, Pirotte B, Brucher JM, Wikler D, Damhaut P, et al. Regional glucose metabolism and histopathology of gliomas. A study based on positron emission tomography-guided stereotactic biopsy. Cancer 1996; 78:1098–1106. [DOI] [PubMed] [Google Scholar]
- 19.Hustinx R, Smith RJ, Benard F, Bhatnagar A, Alavi A. Can the standardized uptake value characterize primary brain tumors on FDG-PET? Eur J Nucl Med 1999; 26:1501–1509. [DOI] [PubMed] [Google Scholar]
- 20.Delbeke D, Meyerowitz C, Lapidus RL, Maciunas RJ, Jennings MT, Moots PL, Kessler RM. Optimal cutoff levels of F-18 fluorodeoxyglucose uptake in the differentiation of low-grade from high-grade brain tumors with PET. Radiology 1995; 195:47–52. [DOI] [PubMed] [Google Scholar]
- 21.Barker FG, 2nd, Chang SM, Valk PE, Pounds TR, Prados MD. 18-Fluorodeoxyglucose uptake and survival of patients with suspected recurrent malignant glioma. Cancer 1997; 79:115–126. [PubMed] [Google Scholar]
- 22.Prieto E, Marti-Climent JM, Dominguez-Prado I, Garrastachu P, Díez-Valle R, Tejada S, et al. Voxel-based analysis of dual-time-point 18F-FDG PET images for brain tumor identification and delineation. J Nucl Med 2011; 52:865–872. [DOI] [PubMed] [Google Scholar]
- 23.Nozawa A, Rivandi AH, Kesari S, Hoh CK. Glucose corrected standardized uptake value (SUVgluc) in the evaluation of brain lesions with 18F-FDG PET. Eur J Nucl Med Mol Imaging 2013; 40:997–1004. [DOI] [PubMed] [Google Scholar]
- 24.Ishizu K, Nishizawa S, Yonekura Y, Sadato N, Magata Y, Tamaki N, et al. Effects of hyperglycemia on FDG uptake in human brain and glioma. J Nucl Med 1994; 35:1104–1109. [PubMed] [Google Scholar]
- 25.Varrone A, Asenbaum S, Borght T, Booij J, Nobili F, Någren K, et al. EANM procedure guidelines for PET brain imaging using [18F]FDG, version 2. Eur J Nucl Med Mol Imaging 2009; 36:2103–2110. [DOI] [PubMed] [Google Scholar]
- 26.Fink J, Born D, Chamberlain MC. Pseudoprogression: relevance with respect to treatment of high-grade gliomas. Curr Treat Options Oncol 2011; 12:240–252. [DOI] [PubMed] [Google Scholar]
- 27.Brandsma D, van den Bent MJ. Pseudoprogression and pseudoresponse in the treatment of gliomas. Curr Opin Neurol 2009; 22:633–638. [DOI] [PubMed] [Google Scholar]
- 28.Gao LB, Tian S, Gao HH, Xu YY. Metformin inhibits glioma cell U251 invasion by downregulation of fibulin-3. Neuroreport 2013; 24:504–508. [DOI] [PubMed] [Google Scholar]
- 29.Soritau O, Tomuleasa C, Aldea M, Petrushev B, Susman S, Gheban D, et al. Metformin plus temozolomide-based chemotherapy as adjuvant treatment for WHO grade III and IV malignant gliomas. J BUON 2011; 16:282–289. [PubMed] [Google Scholar]
- 30.Bahar Dasgeb ES. Alteration of FDG uptake associated with metformin Pitfall and opportunity. J Nucl Med 2007; 48 (Suppl 2):184P. [Google Scholar]
- 31.Habibollahi P, van den Berg NS, Kuruppu D, Loda M, Mahmood U. Metformin – an adjunct antineoplastic therapy – divergently modulates tumor metabolism and proliferation, interfering with early response prediction by 18F-FDG PET imaging. J Nucl Med 2013; 54:252–258. [DOI] [PMC free article] [PubMed] [Google Scholar]


