

Abstract
DNA methylation changes occur in animal models of calorie restriction, simulating human dieting, and in human subjects undergoing behavioral weight loss interventions. This suggests that obese individuals may possess unique epigenetic patterns that may vary with weight loss. Here, we examine whether methylation patterns in leukocytes differ in individuals who lost sufficient weight to go from obese to normal weight (successful weight loss maintainers; SWLM) vs currently obese (OB) or normal weight (NW) individuals.
This study examined peripheral blood mononuclear cell (PBMC) methylation patterns in NW (n=16, current/lifetime BMI 18.5-24.9) and OB individuals (n=16, current BMI≥30), and SWLM (n=16, current BMI 18.5-24.9, lifetime maximum BMI ≥30, average weight loss 57.4 lbs) using an Illumina Infinium HumanMethylation450 BeadArray. No leukocyte population-adjusted epigenome-wide analyses were significant; however, potentially differentially methylated loci across groups were observed in RYR1 (p=1.54E-6), MPZL3 (p=4.70E-6), and TUBA3C (p=4.78E-6). In 32 obesity-related candidate genes, differential methylation patterns were found in BDNF (gene-wide p=0.00018). In RYR1, TUBA3C and BDNF, SWLM differed from OB but not NW.
In this preliminary investigation, leukocyte SWLM DNA methylation patterns more closely resembled NW than OB individuals in three gene regions. These results suggest that PBMC methylation is associated with weight status.
Keywords: epigenetics, methylation, obesity, weight loss, weight maintenance
INTRODUCTION
Epigenetic mechanisms (1) have been increasingly implicated in the development of obesity, and animal and human research suggests that DNA methylation is associated with weight loss (2). In this pilot study, we contribute to this literature by determining whether individuals from the National Weight Control Registry (NWCR) (3), who have been highly successful in weight loss and maintenance, resemble currently obese or normal weight individuals in their methylation patterns. We consider methylation in peripheral blood mononuclear cells (PMBCs) and control for possible confounding by differences in cellular composition (4).
SUBJECTS AND METHODS
Subjects
Participants were 48 men and women (ages 25 – 55) in three groups differing by weight history but matched on age, race, and gender. Full eligibility requirements and recruitment procedures are described by Phelan et al. (5). Briefly, eligibility criteria for successful weight loss maintainers (SWLM; n=16) included history of obesity (BMI ≥ 30) and current normal weight (BMI 18.5-24.9; maintained for ≥ 3 years). SWLM had lost on average 57.4 lbs and maintained this loss for an average of 9 years. Normal weight (NW) participants had BMIs of 18.5-25 and no history of being overweight/obese (BMI ≥25). Obese (OB) participants had BMIs≥30. All participants were weight stable for ≥2 years. The Miriam Hospital Institutional Review Board approved the study (Providence, Rhode Island).
DNA extraction/bisulfite modification
Genomic DNA was isolated from 20-190 μl buffy coat samples using the QIAmp DNA Blood Mini Kit (Qiagen, Inc., Alameda, CA, USA, 51104). Samples with low concentration were concentrated using the Genomic DNA Clean & Concentrator™ Kit (Zymo Research, Irvine, CA, USA, D4010). Samples were bisulfite converted via EZ DNA Methylation™ Kit (Zymo Research, D5001).
Methylation profiling
Bisulfite-converted DNA was processed at the University of California San Francisco Institute for Genetics Genomics Core using the Infinium HumanMethylation450 BeadArray (6). Illumina BeadChips were scanned with iScan (Illumina, San Diego, CA, USA). Methylation β values were calculated from intensity of methylated (M) and unmethylated (U) alleles, where the ratio of fluorescent signals β = Max(M,0)/[Max(M,0) + Max(U,0) + 100] and β ranged from 0 (no methylation) to 1 (complete methylation). Poor-performing loci, X- and Y-linked loci and loci <100 base pairs (bp) of a known single-nucleotide polymorphism (SNP) were removed, resulting in data for 384 477 autosomal, non-SNP-associated loci.
Leukocyte adjustment
As leukocyte subpopulations possess distinct methylation patterns (4), differences in PBMC leukocyte populations are potential confounders in methylation analyses. Relative proportion of granulocytes, CD8- and CD4-T cell, monocytes, B-cells, and natural killer (NK)-cells were characterized in each sample using cell-type-specific differentially methylated regions (DMRs) (4).Subsequent analyses adjusted for these leukocyte subpopulations
Statistical analysis
Methylation array data were normalized using ComBat (7). Potential logit-transformed methylation associations across groups (NW, OB, SWLM) were investigated in locus-by-locus analyses with permutation-based omnibus tests for epigenome-wide significance, which fit individual regression models to each of 384 477 loci and calculated regression coefficients for associations between methylation and group. Type I error was controlled for by an assessment of false discovery rate (8). Methylation analyses of loci in candidate gene regions previously associated with obesity were also performed (9) via gene-set analysis methodology (10).
RESULTS
By design, groups differed significantly in current and lifetime maximum BMI. Average current BMI for NW was 21.9 kg/m2 (sd=1.8); OB, 34.5 (sd=3.7); SWLM, 23.8 (sd=1.6) (p<0.001; NW vs OB, p=3.07×10⁻¹³; NW vs SWLM, p=0.0090; OB vs SWLM, p=4.63×10⁻¹²). Lifetime maximum BMI for NW was 23.1 (sd=2.0); OB, 35.6 (3.6); SWLM, 33. (3.1) (p<0.001; NW vs OB, p=9.35×10⁻¹³; NW vs SWLM, p=5.54×10⁻¹²; OB vs SWLM, p=0.039). Age, race and sex did not differ across groups (see Supplemental Table S1).
Methylation at leukocyte-associated loci did not differ significantly across groups (granulocyte p = 0.99, CD8-T cell p = 0.20, CD4-T cell p = 0.23, monocyte p = 0.62, B-cell p = 0.37 and NK-cell p = 0.37; Supplemental Figure S1. Figure 1 presents a Manhattan plot illustrating probability of differences in leukocyte-adjusted methylation across groups at 384 477 loci. Although the lowest q-value following false discovery rate adjustment was 0.54, the three top loci by p-value are located within plausible biological candidate genes RYR1, MPZL3 and TUBA3C (highlighted in Figure 1).
Figure 1.
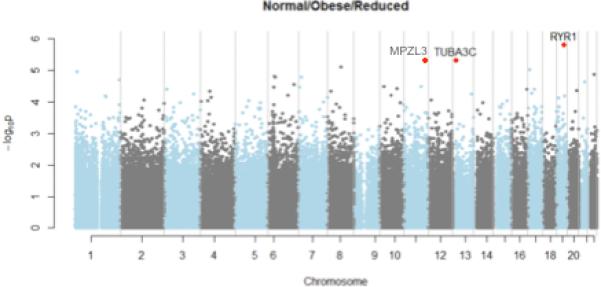
Manhattan plot for differences in methylation status across groups of NW, OB, and SWLM participants at 384 477 autosomal, non-single-nucleotide polymorphism (SNP)-associated CpG loci. Red dots indicate the top three CpG loci by p-value, which were located in the RYR1 region on chromosome 19, in the MPZL3 region on chromosome 11, and in the TUBA3C region on chromosome 13.
Supplemental Table S2 shows the top 20 loci by leukocyte-adjusted p-value. Supplemental Figures S2, S3 and S4 show –log(p)-values and percent methylation by group for RYR1, MPZL3 and TUBA3C, respectively. Three gene-body RYR1 loci were differentially methylated in OB individuals (Figure 2A-C) compared to NW and SWLM, who did not differ from one another. At one MPZL3 promoter locus <1500 bp from the transcription start site (TSS) (cg19069882, p=4.70E-06), distinct methylation patterns between groups were also observed (Figure 2D). Additionally, one TUBA3C locus <1500 bp from the TSS (cg22274414, p=4.78E-06; Supplemental Figure S4 and Figure 2E) differed in OB individuals from other groups.
Figure 2.
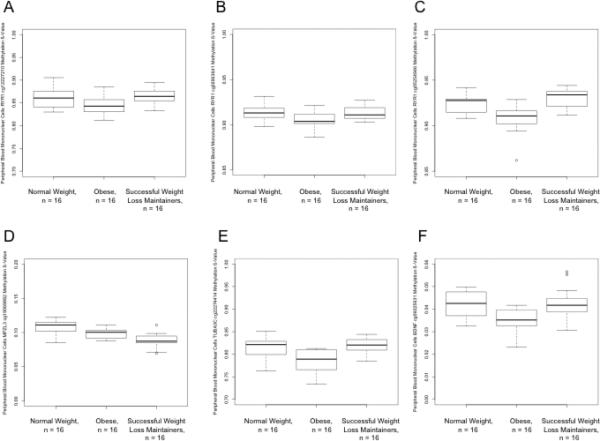
Differences in PBMC methylation status by group (NW, OB, and SWLM) at A) RYR1 cg12227210 (p=0.0075; for OB vs SWLM, p=9.61×10⁻⁴; NW vs SWLM, p=0.44; NW vs OB, p=0.026); B) RYR1 cg26963641 (p=0.012; for OB vs SWLM, p=0.079; NW vs SWLM, p=0.86; NW vs OB, p=0.016); C) RYR1 cg05254946 (p=1.54 ×10⁻⁶; for OB vs SWLM, p=8.76×10⁻⁶; NW vs SWLM, p=0.11; NW vs OB, p=3.30 ×10⁻⁵); D) MPZL3 cg19069882 (p=4.70 ×10⁻⁶; for OB vs SWLM, p=5.58 ×10⁻³; NW vs SWLM, p=2.75 ×10⁻⁵; NW vs OB, p=0.03); E) TUBA3C cg22274414 (p=4.78 ×10⁻⁶; for OB vs SWLM, p=1.79 ×10⁻⁵; NW vs SWLM, p=0.30; NW vs OB, p=1.32 ×10⁻⁴); and F) BDNF cg06025631 (p=6.11×10⁻⁴; for OB vs SWLM, p=0.0029; NW vs SWLM, p=0.47; NW vs OB, p=0.0015).
In leukocyte-adjusted analyses of loci in 32 obesity-related candidate genes (9), significant associations were found between BDNF gene-wide methylation and group (Supplemental Figure S5; p=5.3E-5, significance passing Bonferroni threshold of α=0.05/32, or p<0.0016, accounting for 32 genes). BDNF hypomethylation was observed in OB versus NW and SWLM individuals (epigenome-wide, False Discovery Rate (FDR)-adjusted q-value=0.84) (Figure 2F).
DISCUSSION
We observed differential methylation patterns in PBMCs across NW, OB, and SWLM groups in several genes, suggesting that current BMI may be more strongly associated with methylation than obesity history. NW individuals and SWLM displayed similar PBMC methylation patterns relative to OB individuals in RYR1, TUBA3C and BDNF. Distinct methylation patterns were observed for all groups in MPZL3. These results contribute to literature suggesting that methylation may be associated with weight status (2).
The ryanodine receptor-1, or RYR1, gene encodes a calcium release channel protein found in the sarcoplasmic reticulum expressed in skeletal muscle, and is associated with exercise and caloric restriction in obese rats (11). OB individuals showed reduced methylation at three loci.
The alpha 3c tubulin, or TUBA3C, gene is a tubulin superfamily member, which encodes a major protein component of microtubules in many cell types; a TUBA3C BMISNP interaction is associated with insulin resistance (12). Here, OB individuals showed lower methylation at cg22274414 in the promoter region of this gene, suggesting a potential role in gene expression.
Brain-derived neurotrophic factor, or BDNF, encodes an abundant neurotrophin (9). BDNF SNPs are associated with BMI (9); exercise is associated with BDNF epigenetic changes in rats (13). We observed BDNF hypomethylation in OB versus NW and SWLM individuals. Loci with greatest p-value differences across groups were associated with the TSS of BDNF's transcript variants (variants 3, 2/7/8, 9, 5, 10/11/17/18, 12, 4/13/14, and 6), suggesting a potential role in BDNF transcription and/or expression.
The MPZL3, or myelin protein zero-like 3, gene encodes a predicted type I transmembrane cell-cell adhesion protein linked, in mice, to body weight, energy expenditure, and insulin sensitivity (14). Here, NW individuals had the highest levels of MPZL3 methylation, OB individuals were hypomethylated, and SWLM individuals were most hypomethylated.
In an important innovation, we controlled for potential confounding by major PBMC leukocyte subpopulations. Though we accounted for several major immune cell types, methods have not yet been developed to quantify the relative proportion of activated immune cells, macrophages and dendritic cells, which may relate to obesity. Additional strengths of this study include use of NWCR subjects and matching of subjects on age, race, gender and categories of current and lifetime weight. Our study is limited by small sample size and tissue specificity. Future studies will benefit from confirmation of these results in larger sample sizes, analyses of potential gene expression changes, determination of cross-tissue specificity or correspondence to adipose and skeletal muscle, and investigation of immune implications, as innate immunity is the primary function of PBMCs, and RYR1 is associated with dendritic and T cell activation (15), TUBA3C with lymphocyte migration (16), and BDNF with mitogen-activation in lymphocytes (17).
In summary, we observed potential differences in PBMC methylation between SWLM, NW and OB individuals at RYR1, MPZL3, TUBA3C and BDNF loci. These findings suggest a relationship between obesity, weight and methylation. Future studies should investigate within-subject, weight-loss-associated methylation changes and examine cross-tissue correspondence and immunologic relevance of these results.
Supplementary Material
ACKNOWLEDGMENTS AND FUNDING
This research was funded by the National Institute of Diabetes and Digestive and Kidney Diseases (grant DK066787 to Jeanne McCaffery) and the National Heart, Lung, and Blood Institute (grant T32HL076134-04 to Jennifer Maccani). Dr. Maccani is now at the Penn State College of Medicine Tobacco Center of Regulatory Science (TCORS) and is funded by grant P50-DA-036107-01 from the National Institutes of Health.
ABBREVIATIONS
- SNP
single nucleotide polymorphism
- PBMCs
peripheral blood mononuclear cells
- BMI
body mass index
- EWAS
epigenome-wide association study
- TSS
transcription start site
- NK
natural killer
- NW
cell normal weight
- NWCR
National Weight Control Registry
- OB
obese
- SWLM
successful weight loss maintainer
Footnotes
CONFLICTS OF INTEREST: The authors have no conflicts of interest to disclose.
Supplemental information is available at the International Journal of Obesity's website.
REFERENCES
- 1.Bird A. Perceptions of epigenetics. Nature. 2007;447(7143):396–8. doi: 10.1038/nature05913. Epub 2007/05/25. [DOI] [PubMed] [Google Scholar]
- 2.Barres R, Kirchner H, Rasmussen M, Yan J, Kantor FR, Krook A, et al. Weight loss after gastric bypass surgery in human obesity remodels promoter methylation. Cell Reports. 2013;3(4):1020–7. doi: 10.1016/j.celrep.2013.03.018. Epub 2013/04/16. [DOI] [PubMed] [Google Scholar]
- 3.Wing RR, Phelan S. Long-term weight loss maintenance. The American Journal of Clinical Nutrition. 2005;82(1 Suppl):222S–5S. doi: 10.1093/ajcn/82.1.222S. Epub 2005/07/09. [DOI] [PubMed] [Google Scholar]
- 4.Houseman EA, Accomando WP, Koestler DC, Christensen BC, Marsit CJ, Nelson HH, et al. DNA methylation arrays as surrogate measures of cell mixture distribution. BMC Bioinformatics. 2012;13:86. doi: 10.1186/1471-2105-13-86. Epub 2012/05/10. [DOI] [PMC free article] [PubMed] [Google Scholar]
- 5.Phelan S, Hassenstab J, McCaffery JM, Sweet L, Raynor HA, Cohen RA, et al. Cognitive interference from food cues in weight loss maintainers, normal weight, and obese individuals. Obesity (Silver Spring) 2011;19(1):69–73. doi: 10.1038/oby.2010.138. Epub 2010/06/12. [DOI] [PMC free article] [PubMed] [Google Scholar]
- 6.Illumina Illumina HumanMethylation450 BeadChip Kit. 2013 [updated 2013; cited 2013 2013 Mar 7]; Available from: http://www.illumina.com/products/methylation_450_beadchip_kits.ilmn.
- 7.Johnson WE, Li C, Rabinovic A. Adjusting batch effects in microarray expression data using empirical Bayes methods. Biostatistics. 2007;8(1):118–27. doi: 10.1093/biostatistics/kxj037. Epub 2006/04/25. [DOI] [PubMed] [Google Scholar]
- 8.Benjamini Y, Hochberg Y. Controlling the false discovery rate: a practical and powerful approach to multiple testing. Journal of the Royal Statistical Society, Series B (Methodological) 1995;57(1):12. [Google Scholar]
- 9.Speliotes EK, Willer CJ, Berndt SI, Monda KL, Thorleifsson G, Jackson AU, et al. Association analyses of 249,796 individuals reveal 18 new loci associated with body mass index. Nature Genetics. 2010;42(11):937–48. doi: 10.1038/ng.686. Epub 2010/10/12. [DOI] [PMC free article] [PubMed] [Google Scholar]
- 10.Huang YT, Lin X. Gene set analysis using variance component tests. BMC Bioinformatics. 2013;14:210. doi: 10.1186/1471-2105-14-210. Epub 2013/06/29. [DOI] [PMC free article] [PubMed] [Google Scholar]
- 11.Paulino EC, Ferreira JC, Bechara LR, Tsutsui JM, Mathias W, Jr., Lima FB, et al. Exercise training and caloric restriction prevent reduction in cardiac Ca2+-handling protein profile in obese rats. Hypertension. 2010;56(4):629–35. doi: 10.1161/HYPERTENSIONAHA.110.156141. Epub 2010/07/21. [DOI] [PubMed] [Google Scholar]
- 12.Mikelsaar R, Nelis M, Kurg A, Zilina O, Korrovits P, Ratsep R, et al. Balanced reciprocal translocation t(5;13)(q33;q12) and 9q31.1 microduplication in a man suffering from infertility and pollinosis. Journal of Applied Genetics. 2012;53(1):93–7. doi: 10.1007/s13353-011-0078-5. Epub 2011/11/30. [DOI] [PubMed] [Google Scholar]
- 13.Gomez-Pinilla F, Zhuang Y, Feng J, Ying Z, Fan G. Exercise impacts brain-derived neurotrophic factor plasticity by engaging mechanisms of epigenetic regulation. The European Journal of Neuroscience. 2011;33(3):383–90. doi: 10.1111/j.1460-9568.2010.07508.x. Epub 2011/01/05. [DOI] [PMC free article] [PubMed] [Google Scholar]
- 14.Czyzyk TA, Andrews JL, Coskun T, Wade MR, Hawkins ED, Lockwood JF, et al. Genetic ablation of myelin protein zero-like 3 in mice increases energy expenditure, improves glycemic control, and reduces hepatic lipid synthesis. American Journal of Physiology Endocrinology and Metabolism. 2013;305(2):E282–92. doi: 10.1152/ajpendo.00228.2013. Epub 2013/05/30. [DOI] [PubMed] [Google Scholar]
- 15.Smith AG, Sheridan PA, Tseng RJ, Sheridan JF, Beck MA. Selective impairment in dendritic cell function and altered antigen-specific CD8+ T-cell responses in diet-induced obese mice infected with influenza virus. Immunology. 2009;126(2):268–79. doi: 10.1111/j.1365-2567.2008.02895.x. Epub 2008/08/30. [DOI] [PMC free article] [PubMed] [Google Scholar]
- 16.Morlino G, Barreiro O, Baixauli F, Robles-Valero J, González-Granado JM, Villa-Bellosta R, et al. Miro-1 links mitochondria and microtubule Dynein motors to control lymphocyte migration and polarity. Molecular and Cellular Biology. 2014;34(8):1412–26. doi: 10.1128/MCB.01177-13. Epub 2014 Feb 3. [DOI] [PMC free article] [PubMed] [Google Scholar]
- 17.Barouch R, Appel E, Kazimirsky G, Braun A, Renz H, Brodie C. Differential regulation of neurotrophin expression by mitogens and neurotransmitters in mouse lymphocytes. Journal of Neuroimmunology. 2000;103(2):112–21. doi: 10.1016/s0165-5728(99)00233-7. Epub 2000/03/04. [DOI] [PubMed] [Google Scholar]
Associated Data
This section collects any data citations, data availability statements, or supplementary materials included in this article.