

Abstract
BACKGROUND
Obesity is one of the leading causes of preventable death worldwide. Circadian rhythms are known to control both sleep timing and energy homeostasis, and disruptions in circadian rhythms have been linked with metabolic dysfunction and obesity-associated disease. In previous research, social jetlag, a measure of chronic circadian disruption caused by the discrepancy between our internal versus social clocks, was associated with elevated self-reported body mass index, possibly indicative of a more generalized association with obesity and metabolic dysfunction.
METHODS
We studied participants from the population-representative Dunedin Longitudinal Study (N = 1037) to determine whether social jetlag was associated with clinically assessed measurements of metabolic phenotypes and disease indicators for obesity-related disease, specifically, indicators of inflammation and diabetes.
RESULTS
Our analysis was restricted to N = 815 non-shift workers in our cohort. Among these participants, we found that social jetlag was associated with numerous clinically assessed measures of metabolic dysfunction and obesity. We distinguished between obese individuals who were metabolically healthy versus unhealthy, and found higher social jetlag levels in metabolically unhealthy obese individuals. Among metabolically unhealthy obese individuals, social jetlag was additionally associated with elevated glycated hemoglobin and an indicator of inflammation.
CONCLUSIONS
The findings are consistent with the possibility that ‘living against our internal clock’ may contribute to metabolic dysfunction and its consequences. Further research aimed at understanding that the physiology and social features of social jetlag may inform obesity prevention and have ramifications for policies and practices that contribute to increased social jetlag, such as work schedules and daylight savings time.
INTRODUCTION
Obesity is one of the biggest public health concerns faced by industrialized societies.1–3 Many factors affect the risk for obesity, including sleep duration.4–8 Circadian output rhythms, including sleep-wake timing, are modified through signals from the internal circadian clock that is in turn synchronized to external environmental cues.9 The circadian clock is also known to regulate energy metabolism,10 and disruption of circadian rhythms has been shown to alter obesity and metabolic-associated phenotypes in mice and humans.11–15
Social jetlag is a measure of the discrepancy in sleep timing between our work days and free days.16,17 Social jetlag was so named due to the similarity in the time discrepancy for many individuals between work and free days to that of travel-induced jetlag caused by taking a flight to the west on Friday evening and a return flight on Monday morning. Unlike travel-induced jetlag, social jetlag occurs chronically throughout an individual’s working life. As travel-induced jetlag results in a misaligned circadian system that in turn causes temporary problems with metabolism, it is likely for social jetlag to have chronic consequences for metabolism, due to the manifestations of a misaligned circadian system. Recently, individuals who have more social jetlag, and thus a greater discrepancy between their internal and social clocks, were found to also have higher self-reported body mass index scores (BMI) in a large European sample (N > 65 000).14 This association persisted after controlling for sleep duration and sleep timing (chronotype).
If social jetlag is not only associated with BMI, but more generally with other measures of obesity and metabolic dysfunction as well as with the health consequences of obesity, then this would be consistent with the hypothesis that our internal clocks being at odds with our external schedules may partially underlie the increased obesity seen in recent decades. This would be in line with a number of studies suggesting that sleep disruptions, including short sleep duration and sleep debt, may be a contributing factor to obesity.18,19
We studied participants in the population-representative Dunedin Longitudinal Study in order to further explore the link between social jetlag and metabolic dysfunction in three ways. First, although our sample is smaller than the original discovery sample, it has the advantage of containing a number of clinically assessed measurements of metabolic phenotypes: BMI, fat mass, waist circumference, obesity and the metabolic syndrome. We were additionally able to control not only for additional sleep measures, but also for lifestyle and demographic factors such as smoking and socioeconomic status (SES). Second, obesity is typically associated with metabolic dysfunction and increased inflammation, which have, in turn, been hypothesized to underlie an increased risk for cardiovascular disease and diabetes seen in obese individuals.20–23 In order to investigate whether social jetlag is also associated with these consequences of obesity, we investigated whether social jetlag was associated with disease indicators for obesity-related disease, specifically, indicators of inflammation and diabetes. Third, recent obesity research has shown that there is a subset of obese individuals who are metabolically healthy.24 There is controversy about whether or not these metabolically healthy obese individuals are at increased risk of developing cardiovascular disease and dying from related disorders.24–26 We thus tested whether social jetlag is specifically associated with unhealthy obesity, defined as obese individuals who exhibit at least three risk factors for metabolic syndrome.
MATERIALS AND METHODS
Sample
Participants are members of the Dunedin Multidisciplinary Health and Development Study, a longitudinal investigation of health and behavior in a complete birth cohort. Study members (N = 1037; 91% of eligible births; 52% male) were all individuals born between April 1972 and March 1973 in Dunedin, New Zealand, who were eligible for the longitudinal study based on residence in the province at age 3 years and who participated in the first follow-up assessment at age 3 years. The cohort represents the full range of SES in the general population of New Zealand’s South Island and is primarily white.27 Assessments were carried out at birth and at ages 3, 5, 7, 9, 11, 13, 15, 18, 21, 26 and 32 years, and, most recently, 38 years, when 95% of the 1007 study members still alive took part. At each assessment wave, study members are brought to the Dunedin research unit for a full day of interviews and examinations. The Otago Ethics Committee approved each phase of the study and informed consent was obtained from all study members. We excluded all shift workers (n = 131), as the standard Munich Chronotype Questionnaire would only provide an estimate of their social jetlag for a single shift and thus may not give an accurate measurement of social jetlag for shift workers on variable shift schedules. Exclusion of shift workers is standard practice when using the Munich Chronotype Questionnaire.14,28
Sleep duration, chronotype and social jetlag measures
At age 38 years, the Munich Chronotype Questionnaire was used to assess social jetlag as well as sleep duration and chronotype.29 Social jetlag, the discrepancy between our internal timing and external timing, was measured by subtracting each participant’s midpoint of sleep on work days from their midpoint of sleep on free days (MSF). Sleep duration was calculated by averaging the sleep duration on work days and free days, assuming five work days and two free days a week as standard. Chronotype, the preference in sleep timing, was assessed using sleep-debt-corrected MSF (MSFsc) (see Ronneberg et al.17). A detailed protocol for calculating the complete set of Munich Chronotype Questionnaire variables can be found elsewhere.14 Social jetlag was significantly correlated with chronotype (r = 0.40, P < 0.01), but not with sleep duration (r = −0.04, P = 0.28). The mean social jetlag among participants in our cohort was 0.88 h, with a standard deviation of 0.96 (n = 815) (see Supplementary Figure 1). All analyses were conducted using the absolute value of social jetlag.
Obesity phenotypes at age 38 years
Measures of being overweight
Height was measured to the nearest millimeter using a portable Harpenden Stadiometer (Holtain, Crymych, UK). Weight was recorded to the nearest 0.1 kg using calibrated scales. Individuals were weighed in light clothing. BMI was computed as weight (kg)/height (m2). Obesity was defined as BMI ≥ 30. Of the participants, 23.4% (n = 192) were obese. Waist circumference (girth) was measured in centimeters. Fat mass was measured using a body composition analyser (Tanita BC 418, Tokyo, Japan) to assess bio-electrical impedance.
Metabolic syndrome
Metabolic syndrome was assessed from measurements of five biomarkers: (i) high waist circumference (≥ 88 cm for women, ≥ 102 cm for men), (ii) high blood pressure (≥ 130/85 mm Hg), (iii) low high-density lipoprotein (HDL) cholesterol (< 50 mg dl−1 for women, < 40 mg dl−1 for men), (iv) high glycated hemoglobin (≥ 5.7%) and (v) high triglycerides (≥ 200 mmol l−1). Biomarker assessments have been described in detail previously.30 Cohort members with high-risk values on three or more biomarkers were defined as having the metabolic syndrome.31 Of the participants, 15.9% met criteria for the metabolic syndrome.
Inflammation
Elevated systemic inflammation was assessed using high-sensitivity assays of C-reactive protein (hsCRP) in blood. HsCRP was measured on a Hitachi 917 analyzer (Roche Diagnostics GmbH, D-68298, Mannheim, Germany) using a particle-enhanced immunoturbidimetric assay. The Centers for Disease Control and Prevention (CDC)/American Heart Association (AHA) definition of high cardiovascular risk (hsCRP>3 mg l−1) was adopted to identify the risk group.32
Glycated hemoglobin
Glycated hemoglobin concentrations (expressed as a percentage of total hemoglobin) were measured by ion-exchange high-performance liquid chromatography (Variant II; Bio-Rad, Hercules, CA, USA) (coefficient of variation, 2.4%), a method certified by the US National Glycohemoglobin Standardization Program (http://www.missouri.edu/~diabetes/ngsp.html). The American Diabetes Association definition of ‘pre diabetes’ high glycated hemaglobin (≥ 5.7) was adopted to identify the risk group.33
Unhealthy obesity
We created a measure for obesity status with three levels: non-obese: BMIo30, healthy obese individuals: BMI ≥ 30, but no metabolic syndrome (see above), and unhealthy obese: BMI ≥ 30 and metabolic syndrome. Of the 186 obese individuals, 101 were healthy obese and 85 were unhealthy obese.
Potentially confounding variables
Current smoking was defined as smoking at least one cigarette daily for at least 1 month in the previous year (0 = non-smoker, 1 ≤ 10 per day, 2 = 10–19 per day and 3 = 20+ per day). Of the participants, 77.3% were non-smokers. Current smoking was included as a potential confounder because it is positively associated with social jetlag (in the Dunedin study, r = 0.24, P < 0.0001) and because smoking may keep weight low.34,35
Socioeconomic status
At age 38 years, study members were asked about their current or most recent occupation. The SES of the study members was measured on a six-point scale that assessed self-reported occupational status and allocates each occupation to 1 of 6 categories (1 = unskilled laborer, 6 = professional). Homemakers and those not working were prorated based on their educational status according to criteria included in the New Zealand Socioeconomic Index.36 SES was included as a covariate in the analyses because lower social status is linked to greater social jetlag (in the Dunedin Study, r = 0.17, P < 0.001) and because of the SES-health gradient.37
Analysis
We conducted linear regressions for continuous outcomes (BMI, fat mass and waist circumference) and logistic regressions for dichotomous outcomes (obesity and metabolic syndrome). Social jetlag was treated as a continuous variable in all analyses. In model 1, we controlled for social jetlag, sex, chronotype (MSFsc) and sleep duration. In model 2, we controlled for the model 1 covariants and additionally added a covariant for smoking. In model 3, we controlled for the model 2 covariants and additionally added a covariant for SES. For linear regression models, we assessed violations of linearity, normality and homoscedasticity, using visual inspection of histograms, residual-versus-fitted plots and Q-Q plots, as well as skewness and kurtosis statistics (P < 0.05). All assumptions were met. The variance inflation factor score for the covariants used only differed slightly across models and ranged between 1.04 and 1.35. As an example, the variance inflation factor scores for the covariants in model 3, with fat mass as the dependent variable, are as follows: sex (1.06), social jetlag (1.34), MSFsc (1.33), sleep duration (1.04), SES (1.18) and current smoking (1.20).
We used multinomial logistic regression to determine whether social jetlag was associated with metabolically unhealthy vs healthy obesity status. For the biomarkers of inflammation (hsCRP) and diabetes (glycated hemoglobin), we first conducted the analyses as stated above and then repeated them after excluding the remaining healthy obese individuals (n = 100).
Six individuals had extreme values of social jetlag (values> 5 h). To address these individuals, we conducted the above analyses both with these individuals removed and with these individuals recoded to a social jetlag score of 5 h. These two approaches yielded nearly identical results; we present the data with the recoded values.
Our study members are still relatively young (age 38 years), and only a few are taking diabetes medication (n = 4) or statins (n = 18). Study members were assessed for their use of medications with anti-inflammatory effect, including: systemic steroids, respiratory steroids, nonsteroidal anti-inflammatory drugs, prophylactic aspirin, anti-gout medications, anti-rheumatic medications and estrogens. Use of anti-inflammatory drugs was not related to social jetlag (r = 0.01, P = 0.68). In sensitivity analyses (via statistical control and via exclusion), we verified that medication use did not influence the statistical or substantive findings reported in this article.
All analyses were conducted using SPSS (IBM SPSS Statistics for Windows, Version 22.0. Armonk, NY, USA: IBM Corp).
RESULTS
Social jetlag was significantly associated with overweight phenotypes and phenotypes indexing metabolic dysfunction (see Figure 1), even after taking into account chronotype and sleep duration (see Table 1). Individuals with greater social jetlag scores had higher average BMIs (β = 0.10, s.e. = 0.2, P = 0.012) and more fat mass (β = 0.08, s.e. = 0.5, P = 0.031), were more likely to be obese (odds ratio (OR) = 1.2 (95% confidence interval (95% CI): 1.0–1.5), P = 0.045) and to meet criteria for the metabolic syndrome (OR = 1.3 (95% CI: 1.0–1.6), P = 0.031). There was also a trend for these individuals to have larger waist circumference (β = 0.07, s.e. = 5.1, P = 0.052). We thus found that greater social jetlag was generally associated with elevated measures of obesity and metabolic dysfunction.
Figure 1.
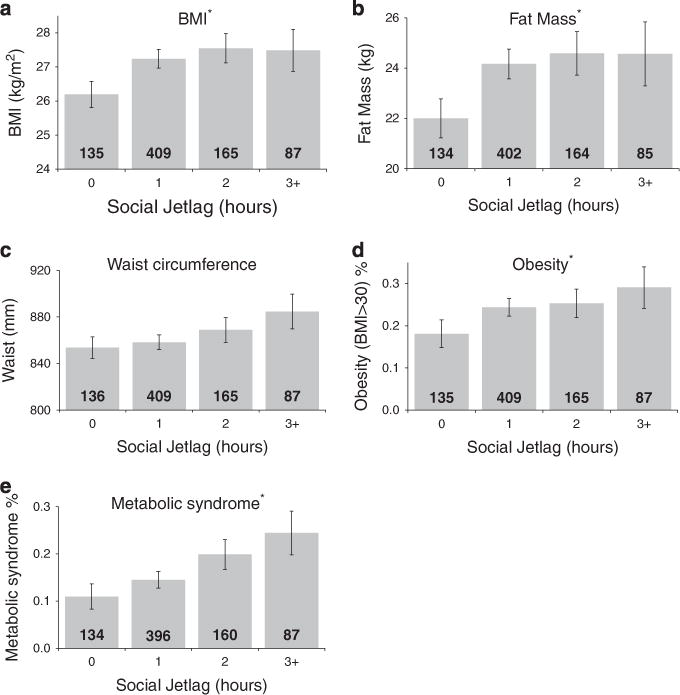
Social jetlag associated with metabolic measures. Social jetlag is significantly associated with: (a) body mass Index (kg m−2); (b) fat mass (kg); (d) obesity and (e) metabolic syndrome, but not with (c) waist circumference (mm). The bars represent the mean values or percent of specific measures organized into 1-h bins, with the number inside the bar representing N. The error bars represent s.e. *P-valueso0.05.
Table 1.
Social jetlag is associated with metabolic measures: BMI, fat mass, waist circumference, obesity and metabolic syndrome
| Predictor variable |
BMI
|
Fat mass
|
Waist circumference
|
Obesity
|
Metabolic syndrome
|
|||||
|---|---|---|---|---|---|---|---|---|---|---|
| β (s.e.) | P-value | β (s.e.) | P-value | β (s.e.) | P-value | OR (95% CI) | P-value | OR (95% CI) | P-value | |
| Sex | 0.07 (0.4) | 0.056 | −0.27 (0.8) | 0.000 | 0.39 (8.4) | 0.000 | 1.0 (0.7–1.3) | 0.806 | 2.1 (1.4–3.2) | 0.000 |
| Chronotype | −0.06 (0.2) | 0.166 | −0.03 (0.4) | 0.528 | −0.04 (4.3) | 0.289 | 0.9 (0.8–1.1) | 0.353 | 1.2 (1.0–1.4) | 0.121 |
| Sleep duration | −0.04 (0.2) | 0.333 | −0.02 (0.4) | 0.432 | −0.05 (4.3) | 0.123 | 0.9 (0.8–1.1) | 0.192 | 1.0 (0.8–1.2) | 0.679 |
| Social jetlag | 0.10 (0.2) | 0.012 | 0.08 (0.5) | 0.031 | 0.07 (5.1) | 0.052 | 1.2 (1.0–1.5) | 0.045 | 1.3 (1.0–1.6) | 0.031 |
Abbreviations: BMI, body mass index; CI, confidence interval; OR, odds ratio. We used linear regression models to test associations with continuous outcome measures of BMI, fat mass and waist circumference. The table shows the standardized coefficient (β), s.e. and P-value associated with each predictor variable. We used logistic regressions to test associations with binary outcome measures of obesity and the metabolic syndrome. The odds ratio for chronotype, sleep duration and social jetlag reflect the effect of a one-unit (s.d.) increase in the predictor variables. Significant P-values (P < 0.05) are shown in bold. Sex was coded as: female = 1, male = 2.
As tobacco smoking has a suppression effect on weight, we added current smoking levels to our statistical models, anticipating that doing so would strengthen the associations between social jetlag and these measures. Consistent with this expectation, in smoking-adjusted models the associations between social jetlag and overweight phenotypes and phenotypes indexing metabolic dysfunction increased in strength by 15–30% (summarized in Table 2). We thus found that the suppression effect of smoking on weight was likely masking the association between social jetlag and obesity.
Table 2.
Associations between social jetlag and weight and metabolic measures are increased by controlling for smoking and decreased by controlling for socioeconomic status (SES)
| Weight and metabolic measures |
Controlling for sex, chronotype and sleep duration
|
Controlling for smokinga
|
Controlling for smoking and SESb
|
|||
|---|---|---|---|---|---|---|
| β (s.e.) | P-value | β (s.e.) | P-value | β (s.e.) | P-value | |
| BMI | 0.10 (0.24) | 0.012 | 0.13 (0.24) | 0.002 | 0.12 (0.24) | 0.004 |
| Fat mass | 0.084 (0.48) | 0.031 | 0.11 (0.48) | 0.005 | 0.10 (0.48) | 0.009 |
| Waist circumference | 0.072 (5.2) | 0.052 | 0.09 (5.2) | 0.017 | 0.08 (5.2) | 0.034 |
| OR (95% CI) | P-value | OR (95% CI) | P-value | OR (95% CI) | P-value | |
|
| ||||||
| Obesity | 1.2 (1.0–1.5) | 0.045 | 1.3 (1.0–1.5) | 0.019 | 1.2 (1.0–1.5) | 0.035 |
| Metabolic syndrome | 1.3 (1.0–1.6) | 0.031 | 1.3 (1.0–1.6) | 0.043 | 1.2 (1.0–1.5) | 0.063 |
Abbreviations: BMI, body mass index; CI, confidence interval; OR, odds ratio. We used linear regression models to test associations between social jetlag and continuous outcome measures of BMI, fat mass and waist circumference; the table shows the standardized coefficient (β), s.e. and P-value for social jetlag as a predictor variable. We used logistic regressions to test associations between social jetlag and binary outcome measures of obesity and the metabolic syndrome; the table shows the OR, 95% confidence interval for the OR (95% CI) and P-values for social jetlag as a predictor variable. The OR associated with social jetlag reflects the effect of a one-unit (s.d.) increase in social jetlag. Significant P-values (P < 0.05) are shown in bold.
Individuals who smoked had lower BMI (r = −0.13, P < 0.001), less fat mass (r = −0.14, P < 0.001), smaller waist circumference (r = −0.09, P = 0.003) and lower risk for obesity (r = −0.08, P = 0.02). Smoking was not associated with risk for metabolic syndrome (r = 0.02, P = 0.51).
Lower SES status was significantly associated with higher BMI (r = −0.09, P = 0.009), greater waist circumference (r = −0.08, P = 0.02) and higher risk for obesity (r = −0.08, P = 0.03). Lower SES status was also marginally significantly associated with more fat mass (r = −0.06, P = 0.09), but not with risk for the metabolic syndrome (r = −0.05, P = 0.13).
SES is known to predict health outcomes, with people of lower SES generally having worse scores on indicators of health, such as obesity.38 In addition, as irregular working hours may be related to occupational status and can affect social jetlag, we added SES to the linear regression models. Overall, social class differences slightly attenuated the associations between social jetlag and both the overweight phenotypes and the phenotypes indexing metabolic dysfunction, although associations with BMI, fat mass, waist circumference and obesity remained significant (summarized in Table 2).
As social jetlag was significantly associated with metabolic measures, we investigated whether it was also associated with biomarkers of inflammation (hsCRP levels), and diabetes (glycated hemoglobin). Although both analyses suggested that individuals with higher social jetlag scores had marginally elevated levels of hsCRP and glycated hemoglobin, the association did not reach significance for hsCRP (OR = 1.2 (95% CI: 1.0–1.4), P = 0.12) and there was only a trend toward significance for glycated hemoglobin (OR = 1.1 (95% CI: 1.0–1.4), P = 0.073).
Recent obesity research has suggested that it is useful to distinguish between obese individuals who are metabolically healthy versus unhealthy.24,26 Using metabolic syndrome to differentiate between healthy and unhealthy obese individuals, we conducted a multinomial logistic regression to determine whether social jetlag was associated with obesity status. We found that individuals with higher social jetlag levels had an increased risk for being in the metabolically unhealthy obese group (OR = 1.4 (95% CI: 1.1–1.8), P = 0.008, summarized in Figure 2). High levels of social jetlag were not, however, associated with an increased risk for being in the metabolically healthy obese group (OR = 1.1 (95% CI: 0.8–1.4), P = 0.60).
Figure 2.
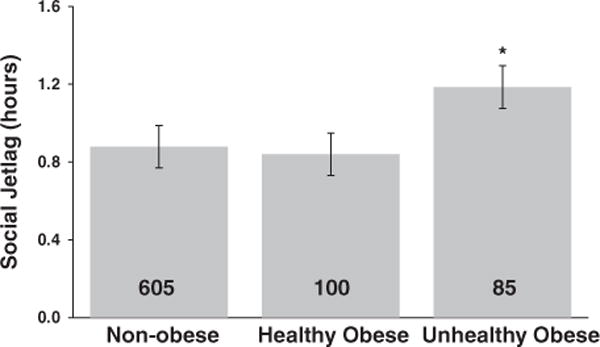
Social jetlag differs between metabolically healthy and unhealthy obese individuals. Social jetlag was associated with obesity status, such that there were higher social jetlag levels in metabolically unhealthy obese individuals compared with non-obese individuals. There were no significant differences between healthy obese individuals and either non-obese or unhealthy obese individuals. The bars represent social jetlag scores of non-obese, healthy obese and unhealthy obese individuals, with the number inside the bars representing N. The error bars represent s.e. *P-values < 0.05.
As healthy obese individuals may not have an increased risk of developing and dying from obesity-related disorders, possibly because they do not have high levels of inflammation and diabetes-related pathophysiology,24–26 they might be masking associations of social jetlag with biomarkers of inflammation and diabetes in the metabolically unhealthy obese. We thus excluded the healthy obese individuals and re-estimated the associations between social jetlag, hsCRP levels and glycated hemoglobin. Upon removing these individuals, we found that individuals with higher social jetlag scores were more likely to have clinically elevated levels of hsCRP (OR = 1.3 (95% CI: 1.0–1.6), P = 0.046) and glycated hemoglobin (OR = 1.3 (95% CI: 1.0–1.6), P = 0.018), although these associations became weaker once we controlled for smoking ((OR = 1.2 (95% CI: 1.0–1.5), P = 0.102) and (OR = 1.2 (95% CI: 1.0–1.6), P = 0.053), respectively) and SES ((OR = 1.2 (95% CI: 1.0–1.5), P = 0.092) and (OR = 1.2 (95% CI: 1.0–1.5), P = 0.112), respectively) (summarized in Figure 3 and Table 3).
Figure 3.
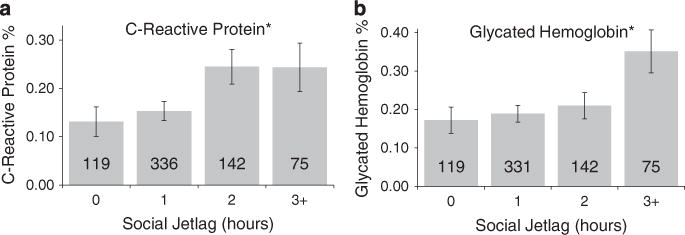
Social Jetlag associated with obesity-related biomarkers for inflammation and diabetes. Social jetlag was associated with the obesity-related disease indicators for (a) inflammation, C-reactive protein levels (CRP) and (b) diabetes, glycated hemoglobin (P-valueso0.05, see Table 3). The bars represent the mean percent of specific measures organized into 1-h bins, with the number inside the bars representing N. The error bars represent s.e. *P-values < 0.05.
Table 3.
Social jetlag is associated with obesity-related disease indicators for inflammation and diabetes
| Obesity-related disease indicators |
Controlling for sex, chronotype and sleep duration
|
Controlling for smokinga
|
Controlling for smoking and SESb
|
|||
|---|---|---|---|---|---|---|
| OR (95% CI) | P-value | OR (95% CI) | P-value | OR (95% CI) | P-value | |
| High-sensitivity C-reactive protein levels (hsCRP) | 1.3 (1.0–1.6) | 0.046 | 1.2 (1.0–1.5) | 0.102 | 1.2 (1.0–1.5) | 0.092 |
| Glycated hemoglobin | 1.3 (1.0–1.6) | 0.018 | 1.2 (1.0–1.6) | 0.053 | 1.2 (1.0–1.5) | 0.112 |
Abbreviations: CI, confidence interval; OR, odds ratio; SES, socioeconomic status. This table shows the OR, 95% confidence interval for the OR (95% CI) and P-value for social jetlag as a predictor in logistic regression models after excluding the healthy obese individuals (n = 100). The OR associated with social jetlag reflects the effect of a one-unit (s.d.) increase in social jetlag. Significant P-values (P < 0.05) are shown in bold.
Individuals who smoked were more likely to have high glycated hemoglobin levels (r = 0.11, P < 0.001), but not high hsCRP levels (r = 0.03, P = 0.33).
Lower SES status was related to high glycated hemoglobin levels (r = −0.10, P = 0.007), but not high hsCRP levels (r = −0.02, P = 0.58).
DISCUSSION
We successfully replicated the association of social jetlag with BMI in an independent cohort.14 We additionally found that social jetlag was associated with a number of clinically assessed metabolic measures, albeit modestly. Furthermore, we found that social jetlag was associated with disease indicators for obesity-related disorders, especially in ‘unhealthy obese’ participants. Taken together, these data show that social jetlag is more generally associated with both obesity and the metabolic consequences frequently found in obese individuals.
As social jetlag is a measure of the discrepancy between our internal clock and our external environment, it is possible that circadian disruption underlies these associations. A number of studies have shown that circadian disruption leads to similar metabolic consequences. Sleep restriction and circadian disruption caused decreases in resting metabolic rate, increased plasma glucose concentrations after eating and inadequate pancreatic insulin secretion.39 Chronic circadian disruption in mice led to metabolic disruption, weight gain, increased leptin and insulin levels.40,41 Furthermore, disruption of a circadian gene led to the disruption of hepatic lipid homeostasis in mice,42 whereas myeloid cell-specific disruption of Per1 and Per2 expression in mice exacerbated both diet-induced inflammation and insulin resistance.43 A recent study found that mistimed sleep disrupted the daily regulation of global gene expression in humans.44 As social jetlag disrupts sleep timing, it is thus possible that social jetlag has similar effects on gene expression. Taken together, these studies suggest that our findings may be explained by the circadian disruption caused when our internal clocks are at odds with our external schedules, possibly by affecting the timing of gene expression. In addition, it is also likely that social jetlag disrupts healthy habits (for example, diet) that may compromise health.
The nature of our observational design prevents us from making causal inferences. In addition, reverse causation could in theory apply, if poor health associated with obesity dictates lifestyle choices, such as occupation type, that increase social jetlag. In order to control for potential confounding effects, we added both smoking and SES to our statistical models, and found that afterward social jetlag was still significantly associated with most of the metabolic measures. Interestingly, controlling for smoking increased the strength of the association between social jetlag and the metabolic measures, which is in line with previous findings that nicotine acts as an appetite suppressant and smoking keeps weight low.34,35 As people with social jetlag have previously been shown to be more likely to smoke,16 it is important to consider this confound in any future replication studies, particularly as it may mask real associations of social jetlag and metabolic measures. Controlling for SES conversely decreased the strength of these associations, possibly because lower SES is associated with poor health, including obesity.38
Although the obesity epidemic has traditionally been thought to be caused primarily by changes in decreased levels of activity and food marketing, recent research has suggested that a number of alternative factors, including sleep debt and sleep duration, also have a role.18,19,40–42 This multi-determinant hypothesis for obesity is compatible with our findings. Moreover, as obesity phenotypes likely have multiple determinants, large effect sizes would not be expected for any single risk factor; it is thus not surprising that the effect sizes associated with social jetlag are relatively modest in size.
This is the first study to find that social jetlag is associated with biomarkers for diabetes and inflammation. Given the association of social jetlag with obesity, it is not surprising to find a similar association with inflammation, as inflammation has long been known to be associated with obesity.20 Although we cannot make causal inferences from our data, the fact that, on average, individuals with a social jetlag of 2 h had similarly increased CRP levels as those with even higher levels of social jetlag suggests that there may be a threshold value of social jetlag required for these associations. Interestingly, a similar threshold-like pattern was seen for both BMI and fat mass. It should be noted that the associations of social jetlag with these biomarkers became weaker or non-significant once we controlled for smoking and SES, suggesting that these factors may partially underlie these associations.
CONCLUSIONS
In conclusion, we found that greater social jetlag was associated with unfavorable metabolic symptoms and disease indicators for obesity-related disorders. The findings are compatible with evidence that circadian disruption causes unfavorable metabolic symptoms in animals and humans. These novel findings are consistent with the hypothesis that the conflict between our internal clocks and our external schedules in modern life may be a contributory factor in the recent obesity epidemic. Further research aimed at determining the physiological mechanisms underlying these associations may give insight into the management of obesity, possibly by altering factors that promote social jetlag and by aligning our internal clocks with our social clocks.
Supplementary Material
Acknowledgments
We would like to acknowledge Dr Celine Vetter for her advice on the Munich Chronotype questionnaire. We thank Phil Silva, Dunedin Study founder, data-collection staff and study members. The work was supported by the followings grants: US National Institute of Aging grant AG032282 and the UK Medical Research Council grant MR/K00381X. The Dunedin Multidisciplinary Health and Development Research Unit is supported by the New Zealand Health Research Council. SG-M is supported by a postdoctoral fellowship provided by the National Institute of Child Health and Human Development (T32-HD07376). MJP was supported by a Medical Research Council Core Grant (Nolan).
Footnotes
CONFLICT OF INTEREST
The authors declare no conflict of interest.
Supplementary Information accompanies this paper on International Journal of Obesity website (http://www.nature.com/ijo)
References
- 1.Barness LA, Opitz JM, Gilbert-Barness E. Obesity: genetic, molecular, and environmental aspects. Am J Med Genet. 2007;143A:3016–3034. doi: 10.1002/ajmg.a.32035. [DOI] [PubMed] [Google Scholar]
- 2.Allison DB, Fontaine KR, Manson JE, Stevens J, VanItallie TB. Annual deaths attributable to obesity in the United States. JAMA. 1999;282:1530–1538. doi: 10.1001/jama.282.16.1530. [DOI] [PubMed] [Google Scholar]
- 3.Mitchell NS, Catenacci VA, Wyatt HR, Hill JO. Obesity:overview of an epidemic. Psychiatr Clin North Am. 2011;34:717–732. doi: 10.1016/j.psc.2011.08.005. [DOI] [PMC free article] [PubMed] [Google Scholar]
- 4.Taheri S, Lin L, Austin D, Young T, Mignot E. Short sleep duration is associated with reduced leptin, elevated ghrelin, and increased body mass index. PLoS Med. 2004;1:e62. doi: 10.1371/journal.pmed.0010062. [DOI] [PMC free article] [PubMed] [Google Scholar]
- 5.Bjorvatn B, Sagen IM, Øyane N, Waage S, Fetveit A, Pallesen S, et al. The association between sleep duration, body mass index and metabolic measures in the Hordaland Health Study. J Sleep Res. 2007;16:66–76. doi: 10.1111/j.1365-2869.2007.00569.x. [DOI] [PubMed] [Google Scholar]
- 6.Lauderdale DS, Knutson KL, Rathouz PJ, Yan LL, Hulley SB, Liu K. Cross-sectional and longitudinal associations between objectively measured sleep duration and body mass index: the CARDIA Sleep Study. Am J Epidemiol. 2009;170:805–813. doi: 10.1093/aje/kwp230. [DOI] [PMC free article] [PubMed] [Google Scholar]
- 7.Watson NF, Buchwald D, Vitiello MV, Noonan C, Goldberg J. A twin study of sleep duration and body mass index. J Clin Sleep Med. 2010;6:11–17. [PMC free article] [PubMed] [Google Scholar]
- 8.Nielsen LS, Danielsen KV, Sørensen TI. Short sleep duration as a possible cause of obesity: critical analysis of the epidemiological evidence. Obes Rev. 2011;12:78–92. doi: 10.1111/j.1467-789X.2010.00724.x. [DOI] [PubMed] [Google Scholar]
- 9.Borbély AA. A two process model of sleep regulation. Hum Neurobiol. 1982;1:195–204. [PubMed] [Google Scholar]
- 10.Marcheva B, Ramsey KM, Buhr ED, Kobayashi Y, Su H, Ko CH, et al. Disruption of the clock components CLOCK and BMAL1 leads to hypoinsulinaemia and diabetes. Nature. 2010;466:627–631. doi: 10.1038/nature09253. [DOI] [PMC free article] [PubMed] [Google Scholar]
- 11.Bass J, Takahashi JS. Circadian integration of metabolism and energetics. Science. 2010;330:1349–1354. doi: 10.1126/science.1195027. [DOI] [PMC free article] [PubMed] [Google Scholar]
- 12.Green CB, Takahashi JS, Bass J. The meter of metabolism. Cell. 2008;134:728–742. doi: 10.1016/j.cell.2008.08.022. [DOI] [PMC free article] [PubMed] [Google Scholar]
- 13.Scheer FAJL, Hilton MF, Mantzoros CS, Shea SA. Adverse metabolic and cardiovascular consequences of circadian misalignment. Proc Natl Acad Sci USA. 2009;106:4453–4458. doi: 10.1073/pnas.0808180106. [DOI] [PMC free article] [PubMed] [Google Scholar]
- 14.Roenneberg T, Allebrandt KV, Merrow M, Vetter C. Social jetlag and obesity. Curr Biol. 2012;22:939–943. doi: 10.1016/j.cub.2012.03.038. [DOI] [PubMed] [Google Scholar]
- 15.Reutrakul S, Van Cauter E. Interactions between sleep, circadian function, and glucose metabolism: implications for risk and severity of diabetes. Ann N Y Acad Sci. 2014;1311:151–173. doi: 10.1111/nyas.12355. [DOI] [PubMed] [Google Scholar]
- 16.Wittmann M, Dinich J, Merrow M, Roenneberg T. Social jetlag: misalignment of biological and social time. Chronobiol Int. 2006;23:497–509. doi: 10.1080/07420520500545979. [DOI] [PubMed] [Google Scholar]
- 17.Roenneberg T, Kuehnle T, Juda M, Kantermann T, Allebrandt K, Gordijn M, et al. Epidemiology of the human circadian clock. Sleep Med Rev. 2007;11:429–438. doi: 10.1016/j.smrv.2007.07.005. [DOI] [PubMed] [Google Scholar]
- 18.Keith SW, Redden DT, Katzmarzyk PT, Boggiano MM, Hanlon EC, Benca RM, et al. Putative contributors to the secular increase in obesity: exploring the roads less traveled. Int J Obes. 2006;30:1585–1594. doi: 10.1038/sj.ijo.0803326. [DOI] [PubMed] [Google Scholar]
- 19.McAllister EJ, Dhurandhar NV, Keith SW, Aronne LJ, Barger J, Baskin M, et al. Ten putative contributors to the obesity epidemic. Crit Rev Food Sci Nutr. 2009;49:868–913. doi: 10.1080/10408390903372599. [DOI] [PMC free article] [PubMed] [Google Scholar]
- 20.Visser M, Bouterm LM, McQuillan GM, Wener MH, Harris TB. Elevated C-reactive protein levels in overweight and obese adults. JAMA. 1999;282:2131–2135. doi: 10.1001/jama.282.22.2131. [DOI] [PubMed] [Google Scholar]
- 21.Kip KE, Marroquin OC, Kelley DE, Johnson BD, Kelsey SF, Shaw LJ, et al. Clinical importance of obesity versus the metabolic syndrome in cardiovascular risk in women: a report from the Women’s Ischemia Syndrome Evaluation (WISE) study. Circulation. 2004;109:706–713. doi: 10.1161/01.CIR.0000115514.44135.A8. [DOI] [PubMed] [Google Scholar]
- 22.Gregor MF, Hotamisligil GS. Inflammatory mechanisms in obesity. Annu Rev Immunol. 2011;29:415–445. doi: 10.1146/annurev-immunol-031210-101322. [DOI] [PubMed] [Google Scholar]
- 23.Phillips CM, Perry IJ. Does inflammation determine metabolic health status in obese and nonobese adults? J Clin Endocrinol Metab. 2013;98:E1610–E1619. doi: 10.1210/jc.2013-2038. [DOI] [PubMed] [Google Scholar]
- 24.Blüher M. The distinction of metabolically ‘healthy’ from ‘unhealthy’ obese individuals. Curr Opin Lipidol. 2010;21:38–43. doi: 10.1097/MOL.0b013e3283346ccc. [DOI] [PubMed] [Google Scholar]
- 25.Hamer M, Stamatakis E. Metabolically healthy obesity and risk of all-cause and cardiovascular disease mortality. J Clin Endocrinol Metab. 2012;97:2482–2488. doi: 10.1210/jc.2011-3475. [DOI] [PMC free article] [PubMed] [Google Scholar]
- 26.Kramer CK, Zinman B, Retnakaran R. Are metabolically healthy overweight and obesity benign conditions?: a systematic review and meta-analysis. Ann Intern Med. 2013;159:758–769. doi: 10.7326/0003-4819-159-11-201312030-00008. [DOI] [PubMed] [Google Scholar]
- 27.Moffitt TE, Caspi A, Rutter M, Silva PA, editors. Sex Differences in Antisocial Behavior: Conduct Disorder, Delinquency, and Violence in the Dunedin Longitudinal Study. Cambridge University Press; Cambridge, UK: 2001. [Google Scholar]
- 28.Juda M, Vetter C, Roenneberg T. Chronotype modulates sleep duration, sleep quality, and social jet lag in shift-workers. J Biol Rhythms. 2013;28:141–151. doi: 10.1177/0748730412475042. [DOI] [PubMed] [Google Scholar]
- 29.Roenneberg T, Wirz-Justice A, Merrow M. Life between clocks: daily temporal patterns of human chronotypes. J Biol Rhythms. 2003;18:80–90. doi: 10.1177/0748730402239679. [DOI] [PubMed] [Google Scholar]
- 30.Belsky DW, Caspi A, Goldman-Mellor S, Meier MH, Poulton R, Moffitt TE. Is obesity associated with a decline in intelligence quotient during the first half of the life course? Am J Epidemiol. 2013;178:1461–1468. doi: 10.1093/aje/kwt135. [DOI] [PMC free article] [PubMed] [Google Scholar]
- 31.Alberti KG, Eckel RH, Grundy SM, Zimmet PZ, Cleeman JI, Donato KA, et al. Harmonizing the metabolic syndrome: a joint interim statement of the International Diabetes Federation Task Force on Epidemiology and Prevention; National Heart, Lung, and Blood Institute; American Heart Association; World Heart Federation; International Atherosclerosis Society; and International Association for the Study of Obesity. Circulation. 2009;120:1640–1645. doi: 10.1161/CIRCULATIONAHA.109.192644. [DOI] [PubMed] [Google Scholar]
- 32.Pearson TA, Mensah GA, Alexander RW, Anderson JL, Cannon RO, Criqui M, et al. Markers of inflammation and cardiovascular disease: application to clinical and public health practice: a statement for healthcare professionals from the Centers for Disease Control and Prevention and the American Heart Association. Circulation. 2003;107:499–511. doi: 10.1161/01.cir.0000052939.59093.45. [DOI] [PubMed] [Google Scholar]
- 33.American Diabetes Association Standards of medical care in diabetes—2012. Diabetes Care. 2012;35:S11–63. doi: 10.2337/dc12-s011. [DOI] [PMC free article] [PubMed] [Google Scholar]
- 34.Grunberg NE. Nicotine as a psychoactive drug: appetite regulation. Psychopharmacol Bull. 1986;22:875–881. [PubMed] [Google Scholar]
- 35.Jo YH, Talmage DA, Role LW. Nicotinic receptor-mediated effects on appetite and food intake. J Neurobiol. 2002;53:618–632. doi: 10.1002/neu.10147. [DOI] [PMC free article] [PubMed] [Google Scholar]
- 36.Milne B, Byun U, Lee A. New Zealand Socio-economic Index 2006 (NZSEI-06). An update and revision of the New Zealand Socio-economic Index of Occupational Status 2013. Available from www.stats.govt.nz.
- 37.Adler NE, Boyce T, Chesney MA, Cohen S, Folkman S, Kahn RL, et al. Socioeconomic status and health. The challenge of the gradient. Am Psychol. 1994;49:15–24. doi: 10.1037//0003-066x.49.1.15. [DOI] [PubMed] [Google Scholar]
- 38.McLaren L. Socioeconomic status and obesity. Epidemiol Rev. 2007;29:29–48. doi: 10.1093/epirev/mxm001. [DOI] [PubMed] [Google Scholar]
- 39.Buxton OM, Cain SW, O’Connor SP, Porter JH, Duffy JF, Wang W, et al. Adverse metabolic consequences in humans of prolonged sleep restriction combined with circadian disruption. Sci Transl Med. 2012;4:129ra43. doi: 10.1126/scitranslmed.3003200. [DOI] [PMC free article] [PubMed] [Google Scholar]
- 40.Karatsoreos IN, Bhagat S, Bloss EB, Morrison JH, McEwen BS. Disruption of circadian clocks has ramifications for metabolism, brain, and behavior. Proc Natl Acad Sci USA. 2011;108:1657–1662. doi: 10.1073/pnas.1018375108. [DOI] [PMC free article] [PubMed] [Google Scholar]
- 41.Barclay JL, Husse J, Bode B, Naujokat N, Meyer-Kovac J, Schmid SM, et al. Circadian desynchrony promotes metabolic disruption in a mouse model of shiftwork. PLoS One. 2012;7:e37150. doi: 10.1371/journal.pone.0037150. [DOI] [PMC free article] [PubMed] [Google Scholar]
- 42.Feng D, Liu T, Sun Z, Bugge A, Mullican SE, Alenghat T, et al. A circadian rhythm orchestrated by histone deacetylase 3 controls hepatic lipid metabolism. Science. 2011;331:1315–1319. doi: 10.1126/science.1198125. [DOI] [PMC free article] [PubMed] [Google Scholar]
- 43.Xu H, Li H, Woo SL, Kim SM, Shende VR, Neuendorff N, et al. Myeloid cell-specific disruption of period1 and period2 exacerbates diet-induced inflammation and insulin resistance. J Biol Chem. 2014;289:16374–16388. doi: 10.1074/jbc.M113.539601. [DOI] [PMC free article] [PubMed] [Google Scholar]
- 44.Archer SN, Laing EE, Möller-Levet CS, van der Veen DR, Bucca G, Lazar AS, et al. Mistimed sleep disrupts circadian regulation of the human transcriptome. Proc Natl Acad Sci USA. 2014;111:E682–E691. doi: 10.1073/pnas.1316335111. [DOI] [PMC free article] [PubMed] [Google Scholar]
Associated Data
This section collects any data citations, data availability statements, or supplementary materials included in this article.