Abstract
Recent studies indicate that the process of Ag presentation induces cytoskeleton-dependent mitochondrial redistribution to the immediate vicinity of the immunologic synapse (IS). This redistribution of mitochondria to the IS in T cells is necessary to maintain Ca2+ influx and Th cell activation. Recently, we demonstrated that n−3 polyunsaturated fatty acids (PUFAs) suppress the localization and activation of signaling proteins at the IS. Therefore, we hypothesized that n−3 PUFAs suppress CD4+ T cell mitochondrial translocation during the early stages of IS formation and downmodulate Ca2+-dependent Th cell activation. CD4+ cells derived from fat-1 mice, a transgenic model that synthesizes n−3 PUFA from n−6 PUFA, were cocultured with anti-CD3–expressing hybridoma cells (145-2C11) for 15 min at 37°C, and mitochondrial translocation to the IS was assessed by confocal microscopy. Fat-1 mice exhibited a significantly (p < 0.05) reduced percentage of T cells with mitochondria which translocated to the IS; fat-1 (30%) versus wild type control (82%). Regarding the effect on the mitochondrial-to-cytosolic Ca2+ ratio, wild type cells showed significant increases at the IS (71%) and total cell (60%) within 30 min of IS formation. In contrast, fat-1 CD4+ T cells remained at basal levels following the IS formation. A similar blunting of the mitochondrial-to-cytosolic Ca2+ ratio was observed in wild type cells that were coincubated with inhibitors of the mitochondrial uniporter, RU360 or calcium release-activated Ca2+ (CRAC) channels, BTP2. These observations provide evidence that n−3 PUFAs modulate Th cell activation by limiting mitochondrial translocation to the IS and reducing Ca2+entry.
T cell activation requires contact with APCs to bring the TCR and MHC–peptide complex together. In general, contact is defined by the size of the TCR and MHC–peptide complex which, at ~10–15 nm, requires extensive interdigitation of the plasma membrane of the T cell and APCs. T cells are typically activated via formation of a stable T cell–APC junction, referred to as an immunologic synapse (IS) (1–4).
When the TCR is activated by Ag presentation, mitochondria redistribute close to the site of the IS, where they promote influx of Ca2+ (5). The actin cytoskeleton-based recruitment of mitochondria in the vicinity of active synapses is required for Ca2+ influx through calcium release-activated calcium (CRAC) channels and activation of key downstream transcription factors such as NFAT. The translocation of the mitochondria to the IS is typically observed within 15 min after focal TCR cross-linking (5) with a sustained peak at ~30 min (6). Reduction in the T cell Ca2+ concentration close to the channel serves as a feedback inhibitory mechanism responsible for adjusting channel activity (5). Any agent that inhibits the movement of mitochondria to the IS and modulates intracellular Ca2+ homeostasis can prevent sustained IS formation, thereby suppressing T cell activation and function.
The literature supports the contention that dietary ω-3 polyunsaturated fatty acids (PUFAs), eicosapentaenoic acid (EPA; 20:5n−3) and docosahexaenoic acid (DHA, 22:6n−3) in particular, are important modulators of a host’s inflammatory and immune responses (7–9). These studies demonstrate that EPA and DHA reduce proinflammatory responses, in part, by diminishing T cell proliferative capacity in response to both mitogenic and antigenic stimulation (10). In previous studies from our laboratory, we demonstrated that n−3 PUFA modulate CD4+ T cell immune response via reduction in Th1 effector cell clonal expansion mediated, in part, by diminished IL-2 secretion and IL-2R α-chain mRNA transcription (11, 12). However, the molecular mechanisms by which n−3 PUFA suppress CD4+ T cell function are not fully understood. Recently, we demonstrated that n−3 PUFA are capable of suppressing the localization and activation of signaling proteins at the IS in mouse T cells (12, 13).
Mammals cannot produce n−3 PUFA from the major n−6 PUFA found in the diet because of a lack of Δ15-desaturase activity. Therefore, it is necessary to enrich the diet with EPA and/or DHA to assess their biologic properties in vivo. However, transgenic mice expressing the fat-1 gene encoding an n−3 fatty acid desaturase cloned from Caenorhabditis elegans can catalyze the conversion of n−6 PUFA to n−3 PUFA by introducing a double bond into fatty acyl chains (14). Therefore, the fat-1 mouse model facilitates the investigation of the biologic properties of n−3 PUFA in T cells without having to incorporate these fatty acids into the diet.
In this study, we investigated the effect of n−3 PUFA on T cell–APC interactions in fat-1 mice. Specifically, the effect of n−3 PUFA on the recruitment of mitochondria to the IS during the initial activation phase of T cells in contact with APCs and the consequent changes in Ca2+ signaling in T lymphocytes was investigated. We demonstrate for the first time that n−3 PUFA modulates the early Ca2+ mediated events following the interaction of T cells with APCs. These results are consistent with the ability of n−3 PUFA to inhibit downstream signaling and suppress T cell activation.
Materials and Methods
Materials
RPMI 1640 medium and sodium pyruvate were purchased from Cellgro (Manassas, VA). FBS was purchased from Irvine Scientific (Santa Ana, CA). DMEM 1× medium, Leibovitz medium, penicillin, streptomycin, and glutamax were purchased from Life Technologies (Carlsbad, CA). Fluo-4 AM, Rhod-2 AM, and MitoTracker Green FM were purchased from Molecular Probes (Eugene, OR). RU-360 and BTP2 were purchased from Calbiochem (San Diego, CA). Two-well Lab-Tek chambered cover glass slides were purchased from Nunc (Naperville, IL). Poly-L-lysine solution was purchased from Sigma-Aldrich (St. Louis, MO). Stock solutions of mitotracker green, Fluo-4 AM, Rhod-2 AM and BTP2 were prepared in DMSO and diluted with medium to 100 nM, 1.0 μM, 1.5 μM, and 10 μm, respectively (final concentration of the vehicle DMSO was maintained at 0.1–0.3% in culture). Stock solutions of RU-360 was prepared in degassed water and diluted with medium to a final concentration of 10 μM.
Cell culture
Hybridoma cells expressing hamster mAbs specific for either murine CD3 (clone 145-2C11) or an irrelevant Ag, DNP (clone UC8-1B9, anti-DNP hybridoma) were obtained from American Type Culture Collection (Manassas, VA). Cells were maintained in DMEM-1× with 10% FBS, 4 mM L-glutamine, 1 mM sodium pyruvate, nonessential amino acids, and 105 U/l penicillin and 100 mg/l streptomycin at 37°C and 5% CO2. In addition to the presence of CD3 engagement, both types of hybridoma also display significant surface levels of the costimulatory ligands B7 and ICAM-1, which are capable of engaging their counterparts on the T cell (15). This model has been extensively used to examine T cell–APC interaction (16).
Animals and CD4+ T cell isolation
Fat-1 transgenic mice were generated and backcrossed onto a C57BL/6 background as described previously (14, 17). All procedures followed guidelines approved by Public Health Service and the Institutional Animal Care and Use Committee at Texas A&M University. The colony of fat-1 mice used for this study was generated by breeding heterozygous mice. Mice were genotyped using tail DNA. To confirm the phenotype, total lipids were isolated from splenic T cells, and the fatty acid profile was characterized by gas chromatography as described previously (17, 18). Specific pathogen-free animals were maintained under barrier conditions and were fed a 10% safflower oil diet (n−6 PUFA rich, Research Diets, New Brunswick, NJ) ad libitum with a 12 h light/dark cycle. The diet contained 40 (g/100 g diet) sucrose, 20 casein, 15 corn starch, 0.3 DL-methionine, 3.5 AIN 76A salt mix, 1.0 AIN 76A mineral mix, 0.2 choline chloride, 5 fiber (cellulose), 10 safflower oil. CD4+ T cells from fat-1 or wild type mice were isolated from spleens by a magnetic microbead positive selection method (13).
CD4+ T cell mitochondria labeling using Mitotracker Green FM (mitochondrial localization probe)
Purified (>92.0% determined by flow cytometry) CD4+ T cells (2 × 10⁶ cells/ml) were labeled with Mitotracker Green FM (Molecular Probes, Eugene, OR) for 15 min at 37°C in RPMI 1640 (complete medium with 10% FBS). Mitotracker Green is a green-fluorescent mitochondrial stain that localizes in the mitochondria regardless of membrane potential (19). This probe is essentially nonfluorescent in aqueous solution, becoming fluorescent only when it accumulates in the lipid environment of the mitochondria.
CD4+ T cell mitochondria Ca2+ labeling using Rhod-2 AM (mitochondrial Ca2+ indicator)
Isolated CD4+ T cells (2 × 10⁶ cells/ml) were labeled with red fluorescent dye Rhod-2 AM for 30 min at 37°C. Cells were subsequently washed to remove cytosolic Rhod-2 and resuspended in serum-free Leibovitz medium. Mitotracker Green FM was used to confirm that Rhod-2 fluorescence corresponded to mitochondrial Ca2+ accumulation (19).
CD4+ T cell mitochondrial-to-cytosolic calcium labeling using Rhod-2 AM and Fluo-4 (cytosolic Ca2+ indicator)
Isolated CD4+ T cells (2 × 10⁶ cells/ml) were incubated with green fluorescent dye, Fluo-4, and red fluorescent dye Rhod-2 for 1 h at 37°C. Fluo-4 is a visible wavelength nonradiometric cytosolic Ca2+ indicator that exhibits a 40-fold increase in fluorescence intensity with Ca2+ binding (20). After 1 h incubation with the probe, cells were washed with Leibovitz medium and imaged. The ratio of the cytosolic-to-mitochondrial Ca2+ level was subsequently calculated. In addition, experiments were performed in cultures incubated with RU-360, an inhibitor of mitochondrial uniporter, for 30 min prior to the calcium labeling with Rhod-2 and Fluo-4, following which the mitochondrial-to-cytosolic Ca2+ ratio was determined. In separate experiments, cells were incubated with BTP2, a pharmacologic inhibitor of CRAC/Orai1 channel activity (21, 22), for 1 h prior to the calcium labeling with Rhod-2 and Fluo-4, after which the mitochondrial-to-cytosolic Ca2+ ratio was determined. The mitochondrial-to-cytosolic Ca2+ ratio represents the relative fluorescence intensities of Rhod-2 and Fluo-4.
CD4+ T cell activation and fluorescence microscopy
For mitogenic CD4+ T cell activation, an anti-CD3 expressing hybridoma (clone 145-2C11, ATCC) was used. Mitotracker/Rhod 2-labeled CD4+ T cells were coincubated with hybridoma cells at a 5:1 ratio. Cell mixtures were seeded onto poly-L-lysine precoated Lab-tek two-well chambered coverglass slides (2 × 10⁶ CD4+ T cells per chamber). Cell cocultures were incubated for 15 min at 37°C in 5% CO2. For quantification of Rhod-2 and Fluo-4 fluorescence, excitation wavelengths of 488 and 550 nm were used, and fluorescence emission was monitored at 530 and 590 nm, respectively. Ten to 15 areas with 20–25 cells per area and 4–8 wells per treatment were imaged with a 510 META NLO laser scanning microscope (Carl Zeiss Microimaging, Thornwood, NY) equipped with an argon laser and LSM software. Images were collected using a ×63 objective (1.3 numerical aperture). To validate IS formation, T cells were incubated with irrelevant DNP-specific Ab expressing hybridoma cells (clone UC8-1B9, anti-DNP hybridoma) as a negative control (13, 16).
Image processing and quantification of mitochondrial-to-cytosolic Ca2+
All images were acquired by confocal microscopy and were converted to an 8-bit/channel TIFF format, and the percentage of cells with mitochondrial translocation to the IS was determined. To assess mitochondria-to-cytosolic calcium at the synapse and whole cell, polygons were drawn to designate the IS and the contact whole cell area. The normalized Rhod-2 intensity, an indicator of mitochondrial calcium, and normalized Fluo-4 intensity, an indicator of cytosolic calcium, was calculated by using mean fluorescence intensity (MFI) according to the formula: (Rhod-2 MFI/Fluo-4 MFI at the synapse and contact whole cell). Calcium measurements were determined in individual cells for each experiment, and comparisons were made with same day controls, including inhibitors. Quantitative analysis of MFI was performed using Adobe Photoshop CS3 for Windows (Adobe Systems, San Jose, CA).
Statistical analysis
The effect of the independent variable (fat-1 versus wild type) was assessed using SPSS (Chicago, IL) 15.0 for Windows. Data are expressed as mean ± SE. More than three independent experiments were performed for each experimental condition. Differences between means were tested using t/F-type tests of contrast (two-tailed). Values of p < 0.05 were considered to be statistically significant.
Results
n−3 PUFAs inhibit mitochondrial translocation to the vicinity of the IS
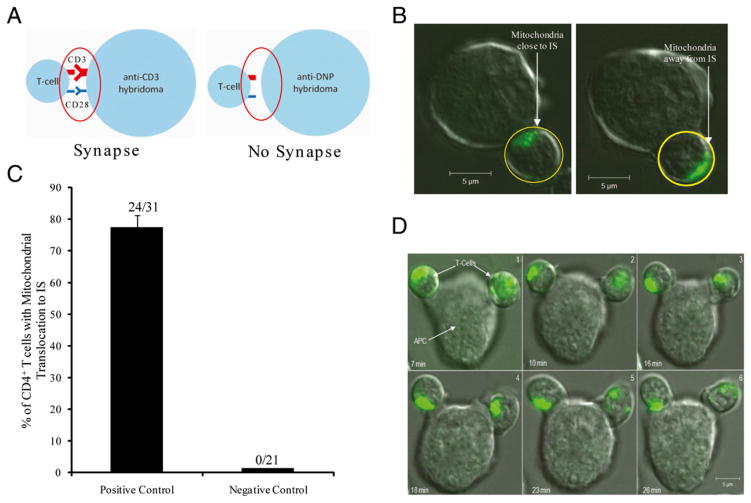
Both fat-1 transgenic and wild type control offspring were fed a 10% safflower diet enriched in n−6 PUFA throughout the duration of the study. To investigate the effect of endogenous n−3 PUFA on mitochondria translocation to the IS, Mitotracker green-labeled CD4+ T cells were cocultured with anti–CD-3 hybridoma cells at 37°C in 5% CO2 for 0–30 min. Images of conjugate CD4+ T cells and hybridoma cells were captured, whereas noncontact CD4+ T cells served as negative controls. The DNP-specific Ab expressing hybridoma was used as a negative control and failed to exhibit direct mitochondrial translocation to the immediate vicinity of the IS formation (Fig. 1A–C). Typically, >75% of wild type (control) CD4+ cells exhibited a directed movement of mitochondria to the IS by 15 min (Fig. 1C, 1D). In contrast, CD4+ T cells from fat-1 mice had a significantly (p < 0.05) reduced percentage of cells with mitochondria translocation to the IS (Fig. 2). Typically, mitochondria in T cells are localized preferentially in one area of the cell (5). This apparent polarized mitochondrial localization may be caused by the rather large nucleus in T cells, and explains why a localized mitochondrial distribution was observed (Fig. 1B).
FIGURE 1.
Focal stimulation of TCR activates mitochondrial translocation to the IS. A, Schematic of IS (positive control) formation (left) and noncontact (negative control) IS (right). B, Immunofluorescence images (original magnification ×63) from MitoTracker Green/AM loaded CD4+ T cells cocultured with (left) anti CD3 (positive control) and (right) anti-DNP (negative control) hybridoma. Scale bar, 5 μm. C, Summary image analysis of subplasma membrane localization of mitochondria in wild type CD4+ T cells after 15 min costimulation with anti-CD3 expressing hybridoma 145-2C11 (positive control) and irrelevant expressing Ab Hybridoma UC8-1B9 (negative control); mean ± SEM of n = 21–31 cells. D, Confocal fluorescence images (original magnification ×63) from a single Mitotracker Green/AM-loaded CD4+ T cell forming an IS with an APC. Image kinetics were measured from time 0 to 30 min following coincubation of Mitotracker-loaded (bright green) CD4+ T cells (from a wild type/control mouse) with APC (Hybridoma 145-2C11). Images in each panel represent the same coincubated cells (7–26 min). Green patching represents mitochondria location in the T cell. Scale bar, 5 μm.
FIGURE 2.
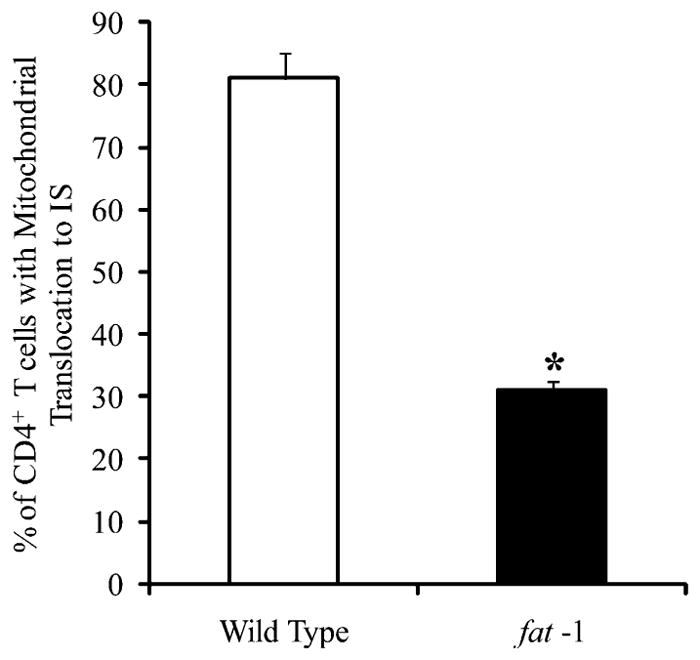
n−3 PUFA suppresses mitochondria translocation to the IS. Subplasma membrane localization of mitochondria to the IS was quantified in CD4+ T cells (n = 140 cells from five fat-1 mice) after a 15 min co-stimulation with Hybridoma 145-2C11 APCs. Percentage of cells exhibiting mitochondrial translocation, fat-1 versus wild type comparison. *p < 0.05.
In independent experiments in our laboratory, total lipid fatty acid compositional analyses of the fat-1 CD4+ T cell revealed an increase in n−3 PUFA, EPA (20:5n−3), docosapentaenoic acid (22:5n−3) and DHA (22:6n−3), and decrease in n−6 PUFA, arachidonic acid (20:4n−6), adrenic acid (22:4n−6), and docosapentaenoic acid (22:5n−6) (13). In addition, the ratio of n−6 to n−3 PUFA was significantly (p < 0.05) suppressed in fat-1 compared with wild type cells. This finding indicates that an appropriate activity of n−3 fatty acid desaturase was present and that T cells from fat-1 mice were enriched in n−3 PUFA. These data demonstrate that n−3 PUFA suppress mitochondrial localization to the IS.
n−3 PUFA reduce Ca2+ uptake by mitochondria at the IS
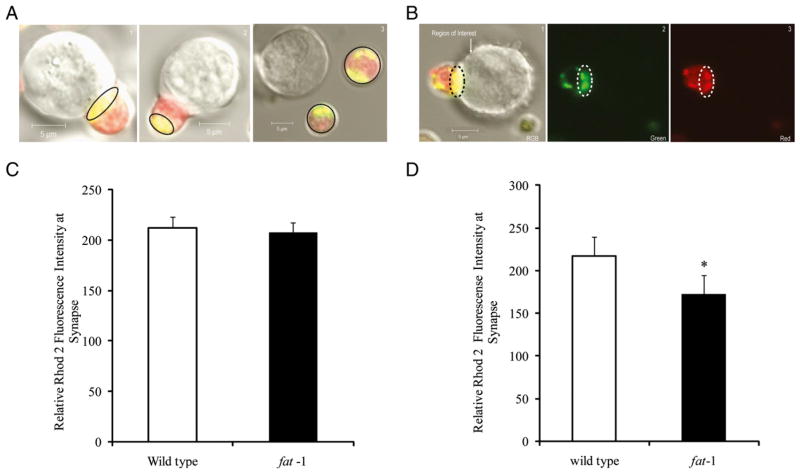
Mitochondrial modulation of CRAC channel activity is involved in mediating the translocation of mitochondria toward the IS at the plasma membrane. Translocation to the IS allows mitochondria to take up a large amount of extracellular Ca2+ directly beneath the mouth of the channels, thereby reducing channel inactivation (5). Therefore, we examined the effect of n−3 PUFA on mitochondrial Ca2+ levels using Mitotracker Green and Rhod-2 AM probes. In this double-labeling experiment, Rhod-2 at the synapse is an indicator of mitochondrial Ca2+ because of the much higher colocalization of both dyes. Fig. 3A shows representative images documenting differential intracellular localization of Ca2+ in mitochondria (yellow pixels). In addition, mitochondrial Ca2+ was measured within the region of interest near the IS (Fig. 3B). In cells exhibiting mitochondrial translocation to the IS, no significant differences in Ca2+ concentration between the wild type and fat-1 T cells was observed (Fig. 3C). In contrast, there was a significant reduction in Ca2+ levels (p <0.05) at the IS in fat-1 T cells when both translocated and nontranslocated mitochondria data were combined (Fig. 3D). These results indicate that T cell Ca2+ signaling at the IS is suppressed in CD4+ T cells enriched with n−3 PUFA. The higher intramitochondrial Ca2+ at the IS is probably caused by the intimate contact between mitochondria and the IS, which exposes mitochondria to higher micro-environments of Ca2+.
FIGURE 3.
Measurement of Ca2+ uptake at the IS. A, The region of interest where calcium signal is observed in confocal microscopy images (original magnification ×63) of Rhod-2 and Mitotracker-labeled cells: T cell with mitochondrial translocation to the IS (1); cell exhibiting a failure to translocate mitochondria to the IS (2); and T cell with no contact (3); therefore, no IS is formed. B, Representative confocal microscopy images (original magnification ×63) of Rhod-2 and Mitotracker-labeled cells RGB (1), green (2), red channels (3), respectively. ROIs at the T cell immune synapse were selected by drawing an oval or polygon as shown in dotted lines. Mean intensities from red and green channels were recorded to calculate Ca2+ values as described in the Materials and Methods. Scale bar, 5 μm. C, Effect of n−3 PUFA on mitochondrial Ca2+ at the IS only in cells with mitochondrial translocation to the IS. D, Comparison of mitochondrial Ca2+ measurements in CD4+ T cells in wild type (n = 26 cells from three mice) and fat-1 (n = 18 cells from three mice). *p < 0.05. ROI, region of interest.
n−3 PUFAs modulate intracellular calcium signaling by altering the mitochondrial-to-cytosolic Ca2+ ratio
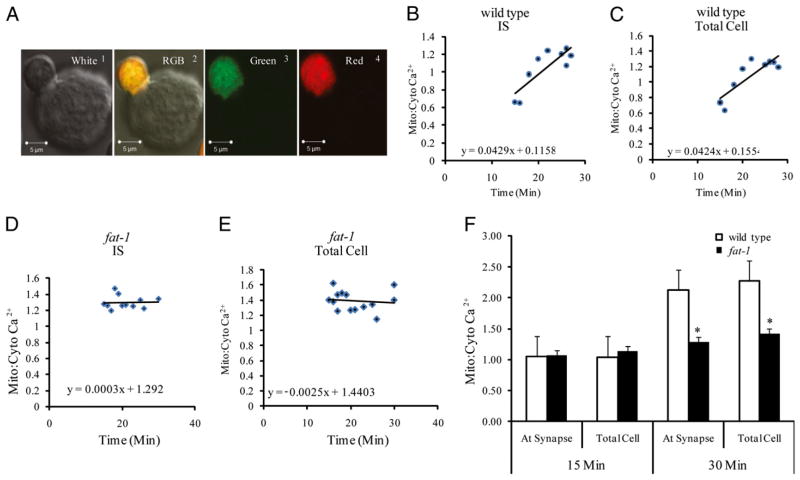
Because mitochondria are key organelles involved in the regulation of intracellular Ca2+ homeostasis, we measured the ratio of mitochondrial-to-cytosolic Ca2+ ratio in individual cells. Fluo-4, a visible wavelength nonratiometric cytosolic indicator, was loaded along with Rhod-2 AM to evaluate the mitochondrial-to-cytosolic Ca2+ ratio. The relative fluorescence intensities of Rhod-2 to Fluo-4 were measured to determine the mitochondrial-to-cytosolic ratio in living CD4+ T cells from fat-1 and wild type mice. Because IS formation, mitochondrial translocation, and Ca2+ influx peaks by ~30 min (23), mitochondrial-to-cytosolic ratio data were collected over a 15–30 min time interval. Fig. 4A shows representative images of Fluo-4 and Rhod-2 labeled cells. In wild type cells, an increasing trend of mitochondrial-to-cytosolic ratio is observed over time at both the IS and the whole cell (Fig. 4B, 4C). In contrast, mitochondrial-to-cytosolic ratio shows no change after the IS formation in the fat-1 cells, both at the IS and the whole cell (Fig. 4D, 4E). Comparison between the mitochondrial-to-cytosolic ratio of wild type and fat-1 cells at 15 min was not significant (p > 0.05) at both the IS and the whole cell level. In contrast, at 30 min, significant differences (p < 0.05) were observed in the mitochondrial-to-cytosolic ratio of wild type versus fat-1 cells at the IS and the whole cell (Fig. 4E). These data are consistent with an inhibitory effect of n−3 PUFA on the uptake of calcium by mitochondria after IS formation.
FIGURE 4.
Effect of n−3 PUFA on intracellular Ca2+. CD4+ T cells were coincubated with Fluo-4 AM (3 μM) and Rhod-2 AM (2.5 μM) for 30 min, and the mitochondrial-to-cytosolic Ca2+ ratio was determined. A, Representative confocal microscopy images (original magnification ×63) of Fluo-4 and Rhod-2 labeled cells white (1), RGB (2), green (3), red channels (4), respectively. B, Amplitude of intracellular Ca2+ response at the IS in wild type CD4+ T cells after coculture with Hybridoma 145-2C11 APCs. Data are from a representative experiment, 15–30 min after coculture; n = 5 independent experiments with 10–20 cells. C, Amplitude of total intracellular Ca2+ response in wild type CD4+ T cells. D, Amplitude of intracellular Ca2+ response at the IS in fat-1 CD4+ T cells. E, Amplitude of total intracellular Ca2+ response in fat-1 CD4+ T cells. F, Comparison of relative mitochondrial-to-cytosolic Ca2+ ratio at the IS versus total cell in CD4+ T cells from wild type (n = 116 cells from four mice) and fat-1 mice (n = 131 cells from five mice). Measurement at 15 min following the IS formation (left). Measurement at 30 min, the peak of response (right). *p < 0.05.
Effect of a mitochondrial uniporter inhibitor on intracellular Ca2+ levels
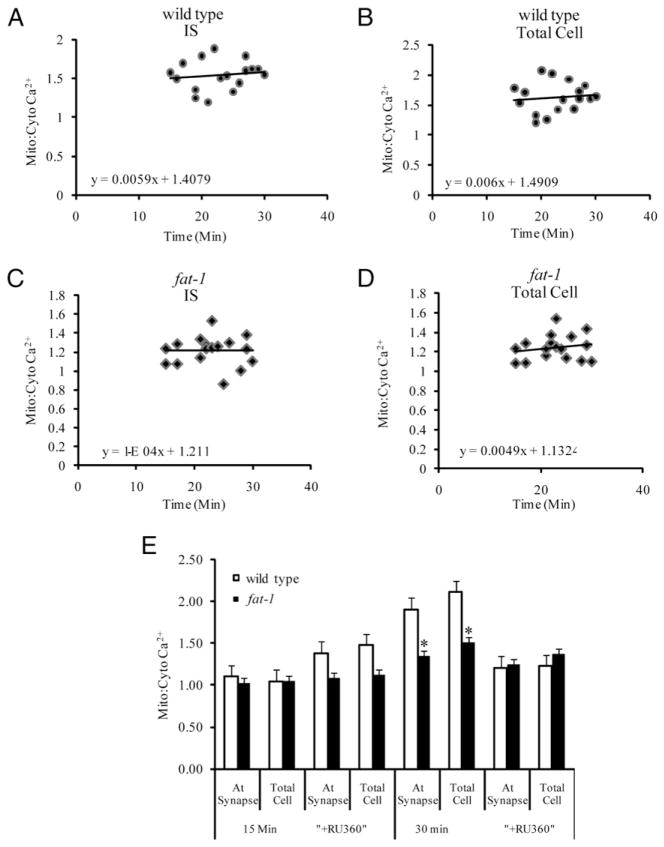
To investigate the role of the mitochondrial uniporter in Ca2+ uptake, cells were treated with RU-360, a mitochondrial Ca2+ uniporter inhibitor (24). Following IS formation, the mitochondrial-to-cytosolic ratio in both the wild type and fat-1 cells coincubated with RU360 showed no change at up to 30 min (Fig. 5A–D). Significant differences (p < 0.05) in the mitochondrial-to-cytosolic Ca2+ ratio were observed in wild type cells and fat-1 cells minus RU-360 both at IS and the whole cell at 30 min (Fig. 5E). These data are consistent with the role of mitochondrial uniporter activity in regulating intracellular Ca2+ following IS formation.
FIGURE 5.
Effect of mitochondrial uniporter inhibitor (RU-360) on intracellular Ca2+. CD4+ T cells from wild type and fat-1 mice were pre-incubated with RU-360 (10 μM) for 30 min, followed by washing and coincubation with Fluo-4 AM (3 μM) and Rhod-2 AM (2.5 μM) for 30 min, and the mitochondrial-to-cytosolic Ca2+ ratio was determined. A, Amplitude of intracellular Ca2+ response at the IS with RU-360 in wild type CD4+ T cells after 15 min coculture with Hybridoma 145-2C11 APCs. Data are from one representative experiment, 15–30 min after coculture; n = 2–3 independent experiments with 15–18 cells. B, Amplitude of total intracellular Ca2+ response with RU-360 in wild type CD4+ T cells after 15 min coculture with Hybridoma 145-2C11 APCs. C, Amplitude of intracellular Ca2+ response at the IS with RU-360 in fat-1 CD4+ T cells. D, Amplitude of total intracellular Ca2+ response with RU-360 in fat-1 CD4+ T cells. E, Comparison of relative mitochondrial-to-cytosolic Ca2+ ratio at the IS versus total cell in CD4+ T cells from wild type (n = 66 cells from two mice) and fat-1 (n = 92 cells from three mice). Measurement with and without RU-360 at 15 min following IS formation (left). Measurement with and without RU-360 at 30 min, the peak of response (right). *p < 0.05.
Effect of CRAC/ORAI1 channel blocker on intracellular Ca2+ levels
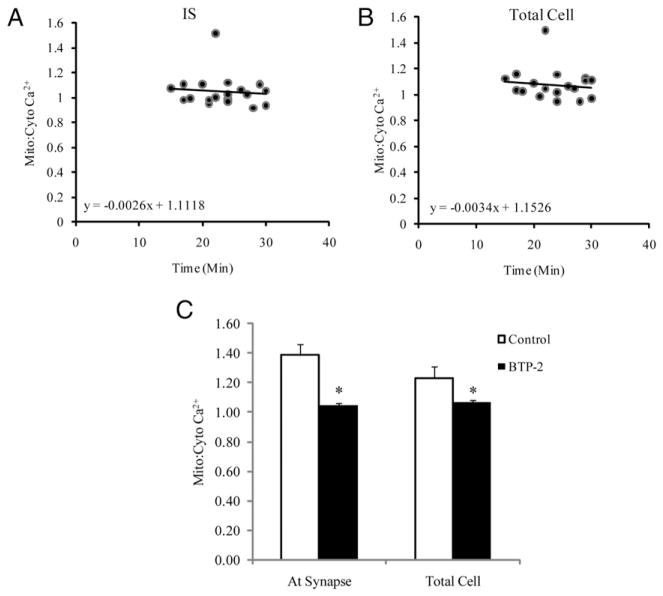
Because sustained Ca2+ influx across the plasma membrane though CRAC channels is required for T cell activation (25), the effects of BTP2, a CRAC/ORAI1 channel blocker, were evaluated in wild type CD4+ T cells. As shown in Fig. 6A–C, the mitochondrial-to-cytosolic ratio at the IS and in the whole cell did not show any increase over time. These data suggest that inactivation of CRAC/ORAI1 channels inhibits the influx of extracellular Ca2+, preventing the increase in mitochondrial-to-cytosolic Ca2+ ratio necessary for downstream effector pathway activation.
FIGURE 6.
Effect of CRAC/Orai1 channel blocker (BTP2) on intracellular Ca2+. CD4+ T cells of wild type mice were preincubated with BTP2 (10 μM) for 1 h, after which cells were washed and coincubated with Fluo-4 AM (3 μM) and Rhod-2 AM (2.5 μM) for 30 min, and the mitochondrial-to-cytosolic Ca2+ ratio was determined. A, Amplitude of intracellular Ca2+ response at the IS with BTP2 in wild type CD4+ T cells after a 15 min coculture with Hybridoma 145-2C11 APCs (n = 15–19 cells, 15–30 min following IS formation). B, Amplitude of total intracellular Ca2+ response with BTP2 in wild type CD4+ T cells. C, Comparison of relative mitochondrial-to-cytosolic Ca2+ ratio at the IS versus total cell in wild type CD4+ T cells (n = 35 cells). *p < 0.05.
Discussion
Autoimmune and/or chronic inflammatory diseases primarily involve an overactive immune response directed toward a particular tissue (26). Improper T cell regulation results in an imbalance between T cell activation and suppression, resulting in chronic inflammation. For example, hyperactivation of CD4+ T cells is associated with enhanced susceptibility to autoimmune disorders and chronic inflammation induced diseases (27). Many studies demonstrate that T cell activation is suppressed by n−3 PUFA/DHA, in part, by altering the physical properties of biologic membranes (10–13, 18, 28, 29). To further investigate the immunomodulatory effects of n−3 PUFA, we examined in vivo mitochondrial translocation and calcium homeostasis in T lymphocytes following IS formation. There is evidence that mitochondria translocate toward the IS in CD4+ and Jurkat T cell lines (5, 25, 30). Recently, the reorganization of mitochondria at the NK cell synapse has been documented (31).
To our knowledge, this is the first study to investigate the effects of n−3 PUFA on critical early Ca2+-mediated events of T cell activation. For this purpose, we used the fat-1 transgenic mouse model to test the hypothesis that n−3 PUFA inhibits mitochondrial translocation and, therefore, suppress sustained Ca2+ signaling necessary for T cell activation. The fat-1 transgenic mouse model was used because it is capable of converting n−6 PUFA to n−3 PUFA endogenously by introducing a cis-double bond into fatty acyl chains (14, 17). This model allows us to investigate the biologic properties of n−3 PUFA without having to incorporate the fatty acid in the diet.
Recent evidence indicates that upon initial contact between APCs and T cells, mitochondria are recruited to the immediate vicinity of the IS (5). This critical event is followed by a reduction in the local accumulation of Ca2+ so as to maintain the robust influx of Ca2+ across the plasma membrane through CRAC channels, resulting in the activation of key downstream transcription factors such as NFATs (5). We have previously demonstrated that incorporation of n−3 PUFA into cytofacial leaflet phospholipids alters the lateral composition of lipid rafts in the plasma membrane, thereby altering the IS microenvironment to impact thresholds for the activation of TCR-mediated cell signaling. Thus, n−3 PUFA-enriched CD4+ T cells exhibit a suppressed localization of important signaling proteins, such as F-actin, phospholipase C γ-1, and protein kincase C θ, into the IS as assessed by immunofluorescence labeling (13). Therefore, we hypothesized that n−3 PUFA would suppress CD4+ T cell mitochondrial translocation during the early stages of IS formation and downmodulate Ca2+-dependent signaling. Our data demonstrate that n−3 PUFA suppresses the activation of T cells, in part, by inhibiting mitochondrial translocation to the IS. Specifically, experiments showed that CD4+ T cells from fat-1 mice had a significantly reduced percentage of cells that exhibited mitochondrial translocation to the IS as compared with cells isolated from wild type mice.
The sustained activity of Ca2+ channels in the plasma membrane requires translocation of mitochondria to the plasma membrane (5). This is attributed to the fact that the decreased distance between mitochondria and the plasma membrane enables mitochondria to take up large amounts of extracellular Ca2+, thereby preventing Ca2+-dependent inactivation of CRAC channels, and sustaining Ca2+-dependent signaling. Because mitochondrial translocation was inhibited in T cells isolated from fat-1 transgenic mice, we further examined the effect of n−3 PUFA enrichment on intracellular Ca2+ homeostasis in T cells using a double excitation technique—that is, excitation at two wavelengths (488 and 550 nm) to determine increases in [Ca2+]i. This technique corrects for errors that are caused by the shift in the spectrum from one wavelength to another during increases in intracellular Ca2+ (20). As anticipated, the inhibition of mitochondrial translocation in fat-1 T cells was associated with a reduction in mitochondrial Ca2+ uptake near the IS. We also noted that the mitochondrial-to-cytosolic Ca2+ ratio remained unchanged in n−3 PUFA-enriched (fat-1) T cells following IS formation. In contrast, wild type cells showed an increasing trend with respect to the mitochondrial-to-cytosolic ratio Ca2+ over time at both the IS and the whole cell. These data are noteworthy because Ca2+ mediated regulation of CRAC channels in T cells enable sustained elevation of intracellular Ca2+, an obligate requirement to drive nuclear translocation of NFAT (32). Maintenance of nuclear localization of NFAT is a prerequisite for the expression of IL-2 and other T cell activation responses after exposure to Ag (33, 34). In the absence of mitochondrial translocation and, hence, mitochondrial Ca2+ uptake, the local accumulation of Ca2+ near the IS inactivates CRAC/ORAI1 channel quickly and reduces Ca2+ entry into the cell (5). Our results reaffirm the importance of mitochondrial translocation and demonstrate for the first time that n−3 PUFA are capable of decreasing mitochondrial Ca2+ uptake, thereby impairing a universal second messenger pathway important for T cell activation.
To address the integration and crosstalk between Ca2+ and other signaling pathways in our T cell model system, proof-of-principle experiments were also conducted using mitochondrial uniporter (RU-360) and CRAC/ORAI1 channel (BTP2) inhibitors. As anticipated, following IS formation, mitochondrial-to-cytosolic Ca2+ ratios in both wild type and fat-1 cells coincubated with RU-360 were similar. In contrast, in the absence of RU360, the ratio was elevated only in wild type cells. In complementary experiments, inactivation of the CRAC/ORAI1 channel prevented the synapse-induced increase in the mitochondrial-to-cytosolic Ca2+ ratio. These data corroborate the functional link between mitochondrial regulation of CRAC/ORAI1 and T cell activation. Our results stress the importance of mitochondria in regulating Ca2+ channel activity and signal transmission from the plasma membrane to the nucleus during the earliest stages of T cell activation. Therefore, the immunosuppressive effects of n−3 PUFA on T cell function can be attributed, in part, to modulation of mitochondria-dependent intracellular Ca2+ signaling.
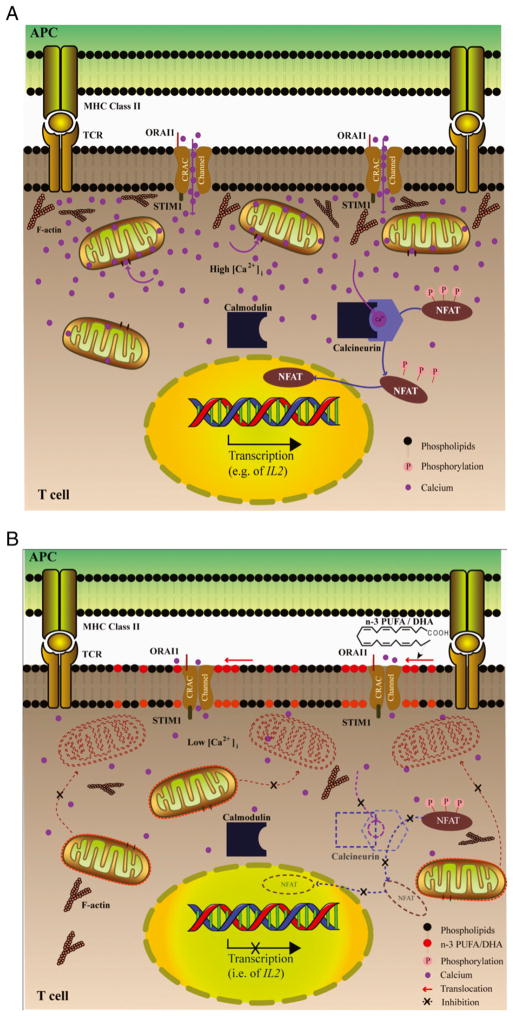
Although previous studies have examined the effects of diet in regard to immunosuppression (27, 35, 36), it is apparent that n−3 PUFA profoundly reduces the translocation of mitochondria to the immediate vicinity of the IS (Fig. 7). This, in turn, reduces Ca2+ uptake by mitochondria, diminishing the local cytosolic Ca2+ concentration, which limits Ca2+ influx through CRAC/ORAI1 channels. Ultimately, lower intracellular Ca2+ inactivates the phosphatase calcineurin and reduces the subsequent nuclear import and assembly of NFAT transcription complexes that are essential for T cell activation (3, 4, 34). Regarding mechanisms that modulate mitochondrial motility, there is evidence that n−3 PUFA can displace F-actin from the IS, where T cells and APCs form a conjunction (13, 28). This finding is noteworthy because mitochondria predominantly interact with the actin cytoskeleton and use actin tracks to coordinate the relative distance between the IS and mitochondria (5, 37, 38). Further work is needed to examine the effects of membrane lipid composition on T cell cytoskeletal tracks.
FIGURE 7.
Effect of n−3 PUFA on Ca2+-dependent T cell activation. A, Schematic model showing the role of mitochondria during T cell activation by Ag. Upon formation of the IS between an APC and Th cell, mitochondria translocate to the immediate vicinity of the IS. Once recruited to the IS, mitochondria reduce local Ca2+ accumulation, thereby sustaining Ca2+ influx through CRAC/ORAI1 channels. Increase in the intracellular calcium [Ca2+]i concentration leads to calcium and calmodulin binding to the calcium-calmodulin–dependent phosphatase, calcineurin. Calcineurin then dephosphorylates transcription factors (e.g., NFAT), which translocate to the nucleus and remain in a transcriptionally active state. B, The incorporation of n−3 PUFA into the fat-1 CD4+ T cell plasma membrane increases the formation of lipid rafts at the IS and also alters the composition of mitochondrial membrane. This results in the inhibition of mitochondrial translocation to the IS, thereby reducing Ca2+ uptake by mitochondria, limiting the cytosolic Ca2+ concentration, and blocking phosphatase activition of calcineurin. Collectively, these events reduce the dephosphorylation and nuclear translocation of NFAT and suppress the transcription of genes necessary for T cell activation.
We have shown that n−3 PUFA suppresses mitochondrial translocation to the IS and perturbs Ca2+ signaling, which is critical to T cell activation. These results provide a critical new paradigm in understanding the molecular mechanisms through which n−3 PUFA modulates T cell activation. Additional studies are needed to further elucidate the effect of dietary n−3 PUFA on T cell mitochondrial motility.
Acknowledgments
This work was supported by National Institutes of Health Grants DK 071707 and P30ES09106 and U.S. Department of Agriculture CSREES Special Grant Designing Foods for Health 2008-34402-17121. Confocal microscopy was performed in the College of Veterinary Medicine and Biochemical Sciences Image Analysis Laboratory, supported by funding from National Institutes of Health–National Center for Research Resources Shared Instrumentation Grant 1 S10 RR22532-01.
We thank Dr. J.X. Kang (Department of Medicine, Harvard University) for providing fat-1 breeder mice.
Abbreviations used in this paper
- CRAC
calcium release-activated calcium
- DHA
docosahexaenoic acid
- EPA
eicosapentaenoic acid
- IS
immunologic synapse
- MFI
mean fluorescence intensity
- PUFA
polyunsaturated fatty acid
- ROI
region of interest
Footnotes
Disclosures
The authors have no financial conflicts of interest.
References
- 1.Lewis RS. Calcium signaling mechanisms in T lymphocytes. Annu Rev Immunol. 2001;19:497–521. doi: 10.1146/annurev.immunol.19.1.497. [DOI] [PubMed] [Google Scholar]
- 2.Grafton G, Thwaite L. Calcium channels in lymphocytes. Immunology. 2001;104:119–126. doi: 10.1046/j.0019-2805.2001.01321.x. [DOI] [PMC free article] [PubMed] [Google Scholar]
- 3.Feske S, Giltnane J, Dolmetsch R, Staudt LM, Rao A. Gene regulation mediated by calcium signals in T lymphocytes. Nat Immunol. 2001;2:316–324. doi: 10.1038/86318. [DOI] [PubMed] [Google Scholar]
- 4.Niemeyer BA, Mery L, Zawar C, Suckow A, Monje F, Pardo LA, Stuhmer W, Flockerzi V, Hoth M. Ion channels in health and disease. 83rd Boehringer Ingelheim Fonds International Titisee Conference. EMBO Rep. 2001;2:568–573. doi: 10.1093/embo-reports/kve145. [DOI] [PMC free article] [PubMed] [Google Scholar]
- 5.Quintana A, Schwindling C, Wenning AS, Becherer U, Rettig J, Schwarz EC, Hoth M. T cell activation requires mitochondrial translocation to the immunological synapse. Proc Natl Acad Sci USA. 2007;104:14418–14423. doi: 10.1073/pnas.0703126104. [DOI] [PMC free article] [PubMed] [Google Scholar]
- 6.Glitsch MD, Bakowski D, Parekh AB. Store-operated Ca2+ entry depends on mitochondrial Ca2+ uptake. EMBO J. 2002;21:6744–6754. doi: 10.1093/emboj/cdf675. [DOI] [PMC free article] [PubMed] [Google Scholar]
- 7.Bouwens M, van de Rest O, Dellschaft N, Bromhaar MG, de Groot LC, Geleijnse JM, Müller M, Afman LA. Fish-oil supplementation induces antiinflammatory gene expression profiles in human blood mononuclear cells. Am J Clin Nutr. 2009;90:415–424. doi: 10.3945/ajcn.2009.27680. [DOI] [PubMed] [Google Scholar]
- 8.Chapkin RS, Kim W, Lupton JR, McMurray DN. Dietary docosahexaenoic acid and eicosapentaenoic acid: Emerging mediators of inflammation. Prostaglandins Leukot Essent Fatty Acids. 2009;81:187–191. doi: 10.1016/j.plefa.2009.05.010. [DOI] [PMC free article] [PubMed] [Google Scholar]
- 9.Jia Q, Lupton JR, Smith R, Weeks BR, Callaway E, Davidson LA, Kim W, Fan YY, Yang P, Newman RA, et al. Reduced colitis-associated colon cancer in Fat-1 (n−3 fatty acid desaturase) transgenic mice. Cancer Res. 2008;68:3985–3991. doi: 10.1158/0008-5472.CAN-07-6251. [DOI] [PMC free article] [PubMed] [Google Scholar]
- 10.Fowler KH, Chapkin RS, McMurray DN. Effects of purified dietary n−3 ethyl esters on murine T lymphocyte function. J Immunol. 1993;151:5186–5197. [PubMed] [Google Scholar]
- 11.Zhang P, Kim W, Zhou L, Wang N, Ly LH, McMurray DN, Chapkin RS. Dietary fish oil inhibits antigen-specific murine Th1 cell development by suppression of clonal expansion. J Nutr. 2006;136:2391–2398. doi: 10.1093/jn/136.9.2391. [DOI] [PubMed] [Google Scholar]
- 12.Fan YY, Ly LH, Barhoumi R, McMurray DN, Chapkin RS. Dietary docosahexaenoic acid suppresses T cell protein kinase C theta lipid raft recruitment and IL-2 production. J Immunol. 2004;173:6151–6160. doi: 10.4049/jimmunol.173.10.6151. [DOI] [PubMed] [Google Scholar]
- 13.Kim W, Fan YY, Barhoumi R, Smith R, McMurray DN, Chapkin RS. n−3 polyunsaturated fatty acids suppress the localization and activation of signaling proteins at the immunological synapse in murine CD4+ T cells by affecting lipid raft formation. J Immunol. 2008;181:6236–6243. doi: 10.4049/jimmunol.181.9.6236. [DOI] [PMC free article] [PubMed] [Google Scholar]
- 14.Kang JX, Wang J, Wu L, Kang ZB. Transgenic mice: fat-1 mice convert n−6 to n−3 fatty acids. Nature. 2004;427:504. doi: 10.1038/427504a. [DOI] [PubMed] [Google Scholar]
- 15.Eisenbraun MD, Tamir A, Miller RA. Altered composition of the immunological synapse in an anergic, age-dependent memory T cell subset. J Immunol. 2000;164:6105–6112. doi: 10.4049/jimmunol.164.12.6105. [DOI] [PubMed] [Google Scholar]
- 16.Lee WT, Pelletier WJ. Visualizing memory phenotype development after in vitro stimulation of CD4(+) T cells. Cell Immunol. 1998;188:1–11. doi: 10.1006/cimm.1998.1341. [DOI] [PubMed] [Google Scholar]
- 17.Fan YY, Kim W, Callaway E, Smith R, Jia Q, Zhou L, McMurray DN, Chapkin RS. fat-1 transgene expression prevents cell culture-induced loss of membrane n−3 fatty acids in activated CD4+ T-cells. Prostaglandins Leukot Essent Fatty Acids. 2008;79:209–214. doi: 10.1016/j.plefa.2008.09.017. [DOI] [PMC free article] [PubMed] [Google Scholar]
- 18.Fan YY, McMurray DN, Ly LH, Chapkin RS. Dietary (n−3) polyunsaturated fatty acids remodel mouse T-cell lipid rafts. J Nutr. 2003;133:1913–1920. doi: 10.1093/jn/133.6.1913. [DOI] [PubMed] [Google Scholar]
- 19.Boitier E, Rea R, Duchen MR. Mitochondria exert a negative feedback on the propagation of intracellular Ca2+ waves in rat cortical astrocytes. J Cell Biol. 1999;145:795–808. doi: 10.1083/jcb.145.4.795. [DOI] [PMC free article] [PubMed] [Google Scholar]
- 20.Gee KR, Brown KA, Chen WN, Bishop-Stewart J, Gray D, Johnson I. Chemical and physiological characterization of fluo-4 Ca(2+)-indicator dyes. Cell Calcium. 2000;27:97–106. doi: 10.1054/ceca.1999.0095. [DOI] [PubMed] [Google Scholar]
- 21.Takezawa R, Cheng H, Beck A, Ishikawa J, Launay P, Kubota H, Kinet JP, Fleig A, Yamada T, Penner R. A pyrazole derivative potently inhibits lymphocyte Ca2+ influx and cytokine production by facilitating TRPM4 channel activity. Mol Pharmacol. 2006;69:1413–1420. doi: 10.1124/mol.105.021154. [DOI] [PubMed] [Google Scholar]
- 22.Zitt C, Strauss B, Schwarz EC, Spaeth N, Rast G, Hatzelmann A, Hoth M. Potent inhibition of Ca2+ release-activated Ca2+ channels and T-lymphocyte activation by the pyrazole derivative BTP2. J Biol Chem. 2004;279:12427–12437. doi: 10.1074/jbc.M309297200. [DOI] [PubMed] [Google Scholar]
- 23.Liu H, Rhodes M, Wiest DL, Vignali DA. On the dynamics of TCR:CD3 complex cell surface expression and downmodulation. Immunity. 2000;13:665–675. doi: 10.1016/s1074-7613(00)00066-2. [DOI] [PubMed] [Google Scholar]
- 24.Kolar SS, Barhoumi R, Lupton JR, Chapkin RS. Docosahexaenoic acid and butyrate synergistically induce colonocyte apoptosis by enhancing mitochondrial Ca2+ accumulation. Cancer Res. 2007;67:5561–5568. doi: 10.1158/0008-5472.CAN-06-4716. [DOI] [PubMed] [Google Scholar]
- 25.Hoth M, Button DC, Lewis RS. Mitochondrial control of calcium-channel gating: a mechanism for sustained signaling and transcriptional activation in T lymphocytes. Proc Natl Acad Sci USA. 2000;97:10607–10612. doi: 10.1073/pnas.180143997. [DOI] [PMC free article] [PubMed] [Google Scholar]
- 26.Chapkin RS, McMurray DN, Lupton JR. Colon cancer, fatty acids and anti-inflammatory compounds. Curr Opin Gastroenterol. 2007;23:48–54. doi: 10.1097/MOG.0b013e32801145d7. [DOI] [PubMed] [Google Scholar]
- 27.Chapkin RS, Davidson LA, Ly L, Weeks BR, Lupton JR, McMurray DN. Immunomodulatory effects of (n−3) fatty acids: putative link to inflammation and colon cancer. J Nutr. 2007;137(1 Suppl):200S–204S. doi: 10.1093/jn/137.1.200S. [DOI] [PubMed] [Google Scholar]
- 28.Geyeregger R, Zeyda M, Zlabinger GJ, Waldhäusl W, Stulnig TM. Polyunsaturated fatty acids interfere with formation of the immunological synapse. J Leukoc Biol. 2005;77:680–688. doi: 10.1189/jlb.1104687. [DOI] [PubMed] [Google Scholar]
- 29.Soni SP, LoCascio DS, Liu Y, Williams JA, Bittman R, Stillwell W, Wassall SR. Docosahexaenoic acid enhances segregation of lipids between raft and nonraft domains: 2H-NMR study. Biophys J. 2008;95:203–214. doi: 10.1529/biophysj.107.123612. [DOI] [PMC free article] [PubMed] [Google Scholar]
- 30.Schwindling C, Quintana A, Krause E, Hoth M. Mitochondria positioning controls local calcium influx in T cells. J Immunol. 2010;184:184–190. doi: 10.4049/jimmunol.0902872. [DOI] [PubMed] [Google Scholar]
- 31.Abarca-Rojano E, Muñiz-Hernández S, Moreno-Altamirano MM, Mondragón-Flores R, Enriquez-Rincón F, Sánchez-García FJ. Re-organization of mitochondria at the NK cell immune synapse. Immunol Lett. 2009;122:18–25. doi: 10.1016/j.imlet.2008.10.008. [DOI] [PubMed] [Google Scholar]
- 32.Oh-hora M, Rao A. Calcium signaling in lymphocytes. Curr Opin Immunol. 2008;20:250–258. doi: 10.1016/j.coi.2008.04.004. [DOI] [PMC free article] [PubMed] [Google Scholar]
- 33.Crabtree GR, Clipstone NA. Signal transmission between the plasma membrane and nucleus of T lymphocytes. Annu Rev Biochem. 1994;63:1045–1083. doi: 10.1146/annurev.bi.63.070194.005145. [DOI] [PubMed] [Google Scholar]
- 34.Rao A, Luo C, Hogan PG. Transcription factors of the NFAT family: regulation and function. Annu Rev Immunol. 1997;15:707–747. doi: 10.1146/annurev.immunol.15.1.707. [DOI] [PubMed] [Google Scholar]
- 35.Calder PC. n−3 polyunsaturated fatty acids, inflammation, and inflammatory diseases. Am J Clin Nutr. 2006;83(Suppl 6):1505S–1519S. doi: 10.1093/ajcn/83.6.1505S. [DOI] [PubMed] [Google Scholar]
- 36.Belluzzi A, Boschi S, Brignola C, Munarini A, Cariani G, Miglio F. Polyunsaturated fatty acids and inflammatory bowel disease. Am J Clin Nutr. 2000;71(Suppl 1):339S–342S. doi: 10.1093/ajcn/71.1.339s. [DOI] [PubMed] [Google Scholar]
- 37.Jeyaraju DV, Cisbani G, Pellegrini L. Calcium regulation of mitochondria motility and morphology. Biochim Biophys Acta. 2009;1787:1363–1373. doi: 10.1016/j.bbabio.2008.12.005. [DOI] [PubMed] [Google Scholar]
- 38.Reis K, Fransson A, Aspenström P. The Miro GTPases: at the heart of the mitochondrial transport machinery. FEBS Lett. 2009;583:1391–1398. doi: 10.1016/j.febslet.2009.04.015. [DOI] [PubMed] [Google Scholar]


