Abstract
Context:
MicroRNAs (miRNAs) are small, noncoding RNAs that negatively regulate gene expression post-transcriptionally. Whether differently expressed miRNAs contribute to promoting granulosa cell proliferation in polycystic ovarian syndrome disease (PCOS) remains unknown.
Objective:
We explored whether certain miRNAs are involved in the ovarian dysfunction of PCOS and the mechanism of increased granulosa cells proliferation.
Patients and Cells:
miRNA expression was analyzed in excised ovarian cortexes from 16 women with PCOS and 8 non-PCOS. An immortalized human granulosa (KGN) cell was used for the mechanism study.
Main Outcome Measures:
Expressions of miRNAs in ovarian cortexes were measured using qRT-PCR and KGN granulosa cells were cultured for proliferation assays after overexpression or inhibition of miR-93 or after insulin treatment. Bioinformatics were used to identify the potential miRNA targets. Protein expression analysis, luciferase assays, and rescue assays were used to confirm the substrate of miR-93.
Results:
MiR-93 expression was higher in PCOS ovarian cortex and its identified target, CDKN1A, was downregulated. MiR-93 overexpression promoted cell proliferation and G1 to S transition. Knocking down CDKN1A promoted cell growth and cell cycle progression in granulosa cells, and CDKN1A re-introduction reversed the promotional role of miR-93. High concentrations of insulin induced upregulation of miR-93, stimulated KGN cells proliferation and reduced CDKN1A expression.
Conclusions:
miR-93 was increased in PCOS granulosa cells and targeted CDKN1A to promote proliferation and cell cycle progression. Insulin could upregulate the expression of miR-93 and stimulate cell proliferation. This might provide a new insight into the dysfunction of granulosa cells in PCOS.
Polycystic ovary syndrome (PCOS) is one of the most common endocrine abnormalities in women of reproductive age, affecting 7–9% of women in this age group (1). It is characterized by chronic anovulation, hyperandrogenemia, and polycystic ovaries in an ultrasound scan (2). PCOS is the prevalent cause of anovulatory infertility; however, the etiology of PCOS remains uncertain, even though there is increasing evidence for a genetic basis and environmental factors (3).
Throughout oocyte development, there is an interdependence between the oocyte and its surrounding granulosa cells, the support of which is essential to provide the oocyte with nutrients and growth regulators. Evidence suggests that dysfunction of granulosa cells may contribute to the abnormal folliculogenesis observed in PCOS (4). PCOS ovaries contain double the number of growing follicles at all stages of development (5), and more growing follicles associated with evidence of increased granulosa cell proliferation in the primate PCOS model (6). Granulosa cell proliferation is increased in the ovaries from anovulatory PCOS women compared with both normal and ovulatory PCO (7, 8). Taken together, granulosa cells have higher proliferation rates in PCOS ovaries, which are involved in the ovarian dysfunction; however, the mechanism remains unclear.
MicroRNAs (miRNAs) are a class of highly conserved, small RNA molecules of 20–23 nucleotides, which affect biological functions at the post-transcriptional level (9). Aberrant expression of miRNAs has been associated with several diseases, including cancer (10–12), metabolic disorders (13) and, very recently, PCOS (14–17). Several miRNAs play essential roles in accelerating cell proliferation in different cells and regulate the pathological and physiological pathways (18–20). Therefore, we aimed to determine whether different miRNAs expression in PCOS ovaries contributes to promoting granulosa cell proliferation in PCOS.
MiRNAs play roles in the maintenance of metabolism (15), steroidogenesis (21–23), and ovarian cancer (24–26), which might be associated with PCOS and associated disorders. In this study, we chose miR-93, miR-21, miR-107, miR-135a, and miR-506 mentioned above to explore whether they are involved in the ovarian dysfunction and determine the mechanism of increasing granulosa cells proliferation in PCOS ovaries.
Materials and Methods
Clinical samples
We recruited patients from the Sun Yat-Sen Memorial Hospital between 2010 and 2014. The local research ethics committee approved the study and all women gave their written informed consent before participation. We recruited 16 women with PCOS, who were undergoing laparoscopic investigation for infertility or ovarian drilling for ovulation induction. The diagnosis of PCOS was established according to the revised Rotterdam European Society of Human Reproduction and Embryology/American Society for Reproductive Medicine criteria (2003) (27). PCOS subjects should present at least two of the following criteria: oligo- and/or anovulation (ie, ≤ 8 menstrual periods in a year or menstrual cycles more than 35 days in length); clinical hyperandrogenism (ie, acne or modified Ferriman-Gallwey scores ≥ 5) and/or biochemical hyperandrogenism [ie, serum total testosterone (TT) ≥ 2.6 nmol/L, free testosterone (FT) ≥ 6.0 pg/mL, TT and FT normal values were determined by the clinical laboratory of the gynecology department at the Memorial Hospital of Sun Yat-Sen University], and polycystic ovaries (ie, the presence of ≥ 12 follicles in each ovary measuring 2–9 mm in diameter) after exclusion of other etiologies (eg, congenital adrenal hyperplasia, androgen-secreting tumors, and Cushing's syndrome). In the control group, we recruited 8 normally menstruating women who were undergoing laparoscopic sterilization, hysterectomy for benign conditions, and diagnostic laparoscopy for pelvic pain. The physical examinations were performed including height, weight, waist circumference, hip circumference, and modified Ferriman-Gallwey score (mFG). The BMI was calculated as body weight in kilograms divided by height in meters squared (kg/m2). Transvaginal ultrasonography was performed to evaluate the ovaries using a Toshiba Sonolayer SSA-220A (Toshiba) with a mechanical 6-MHz probe. Fasting insulin was measured using a chemiluminescence immunometric assay and commercial kit (Immulite 2000 Analyzer; CPC). Fasting glucose was measured using a glucose oxidase assay (Tosoh Corp.) taken after a 12 h overnight fast. TT was measured by the chemiluminescence immunoassays Access 2 (Beckman); FT, SHBG, and DHEAS were measured by Access 2 ELISAs (Beckman). We collected ovarian cortexes for miRNA expression analyses. Clinical and endocrine parameters in normo-ovulatory controls and patients with anovulatory PCOS are summarized in Supplemental Table 1. Here, we define hyperandrogensim, including clinical and biochemical hyperandrogenism as the following criteria: TT ≥ 2.6 nmol/L, FT ≥ 6.0 pg/mL or mFG ≥ 5 (28). We define insulin resistance according to our previous study: HOMA-IR ≥ 2.14 (29). The PCOS patients had higher fasting insulin, HOMA-IR, mFG, and TT than the control group. There were no differences, such as age and BMI.
Cell culture and induction with recombinant human (rh) insulin
A steroidogenic human granulosa-like tumor cell line, KGN, was kindly donated from Professor Huang Hefeng of the School of Zhe Jiang University. The KGN cells were undifferentiated and maintained the physiological characteristics of ovarian cells. The cells were cultured in DMEM/F12 medium (Sigma) supplemented with 10% fetal bovine serum (FBS; Hyclone Laboratories), 100 U/mL penicillin G and 0.1 mg/mL streptomycin sulfate (Invitrogen) in a humidified incubator at 37°C with 5% CO2. Cells were plated in 6-well plates at 2 × 10⁵ per well and treated with rh insulin at concentration of 0, 1, 10 100 ng/mL for 24 h to test the expression of miR-93 and treated with insulin for 48 h to test the expression of CDKN1A after starvation for 12 h.
Oligonucleotide and plasmid transfection
The miR-93 mimics, a nonspecific miR-control, miR-93 inhibitor, a nonspecific miRNA inhibitor control, and small-interfering RNAs (siRNAs) targeting human CDKN1A, were all purchased from Genepharma. The plasmid with CDKN1A expression was kindly donated by the laboratory of Sun Yat-Sen University Cancer Center (30). MiRNAs, oligonucleotide, and plasmid transfection were performed with Lipofectamine 2000 (Invitrogen) according to the manufacturer's instructions. The transfected cells were incubated at 37°C for 24 h or 48 h in a complete medium and harvested at the indicated time points.
RNA extraction, reverse transcription, and quantitative real-time PCR
Total RNA was extracted using TRIzol (Takara) according to the manufacturer's instructions. Five hundred ng of total RNA was reverse transcribed using a miRNA qRT-PCR kit (Takara). MiRNAs were quantified in triplicate using a SYBR green PCR master mix (Takara) and a LightCycler Real Time PCR system. Melting curve analyses confirmed that all primers were specific for their respective transcript. U6 small nuclear RNA (U6-snRNA) purchased from Takara was used as an internal control. The silencing effect on CDKN1A was evaluated using qRT-PCR, and GAPDH was used as an endogenous control. The sequences of the qRT-PCR primers for CDKN1A were validated previously (30) and synthesized by Invitrogen. The fold changes were calculated through relative quantification with 2−ΔΔCT. All of the reactions were performed in a 20 μL reaction volume in triplicate.
3-(4,5-dimethylthiazol-2-yl)-5-(3-carboxymethoxyphenyl)-2-(4-sulfophenyl)-2H-tetrazolium (MTS) assays
For cell proliferation assays, cells transfected with miRNAs or siRNAs for 24 h were reseeded in 96-well plates at 1500 cells/well in a final volume of 150 μL and incubated overnight. The effects of miR-93/ CDKN1A on cell growth and proliferation were determined, respectively, with an MTS assay, according to the manufacturer's instructions. For the insulin effect, cells were seeded in 96-well plates at 1500 cells/well in a final volume of 150 μL with different concentrations of insulin. The medium containing insulin was replaced daily with fresh medium containing the respective concentration of insulin, followed by an MTS assay.
Cell cycle analysis
For cell cycle analysis, we used flow cytometric analysis and 5-ethynyl-2′-deoxyuridine (EdU) assays. For flow cytometric analysis, cells transfected with miRNAs or siRNAs or treated with insulin were plated in 6-well plates at 2 × 10⁵ per well and incubated at 37°C for 48 h. The cells were then collected, washed with PBS, and fixed with cold 70% ethanol at 4°C overnight. The cell cycle distribution was analyzed using propidium iodide (PI) staining and flow cytometry. For EdU assay, cells (5000 cells per well) were cultured in triplicate in 96-well plates and transfected with 50 nM of miR-93 mimics or miR-93 inhibitor or CDKN1A siRNA for 48 h. The cells were then incubated with 50 nM of EdU for an additional 2 h at 37°C. Cells were fixed with 4% formaldehyde for 15 minutes at room temperature and treated with 0.5% Triton X-100 for 20 minutes at room temperature to permeabilize cells. After being washed with PBS three times, cells were incubated with 1 × Apollo reaction cocktail (100 μL/well) for 30 minutes. DNA was stained with 10 μg/mL of Hoechst 33 342 stain (100 μL/well) for 20 minutes and visualized with fluorescence microscopy. Three groups of confluent cells were randomly selected from each sample image. EdU-positive cells were obtained from the fluorescent image, and the relative positive ratio was calculated from the average of the three group values.
Western blot analysis
Protein lysates were resolved through 10% SDS-PAGE and electrophoretically transferred to a polyvinylidene difluoride (PVDF) membrane (Millipore). The membrane was probed with a rabbit monoclonal antibody against human CDKN1A (1:1000 dilution, Cell Signaling Technology) or GAPDH (Bioworld) as a protein loading control. Horseradish peroxidase-conjugated secondary antibodies (1:1000, Cell Signaling Technology), and an ImmobilonTM Western chemiluminescent ECL kit (Millipore) were used to detect bound antibodies. The intensity of the labeled proteins was visualized using Fuji (Japan) SUPER RX-N-C films.
Luciferase reporter assay
The 3′ UTR sequence of CDKN1A, containing the putative miR-93-binding site, was amplified by PCR and cloned into the psiCHECK2 vector (Promega), which was designated as a wild-type 3′ UTR (wt 3′ UTR). Mutagenesis was performed using Easy Mutagenesis System (TRANSGEN BIIOTECH), according to the manufacturer's instructions, resulting in mutated 3′ UTR (mut 3′ UTR). As there were two target sites in the CDKN1A 3′ UTR, we needed to perform the mutagenesis twice. The primers used to construct the luciferase reporters and mutations were CDKN1A wt (forward, AGCTGTTTAAACCCTCAAAGGCCCGCTCTACATCTT; reverse, AGCTGCGGCCGCGGGAGCCGAGAGAAAACAGTCCA) and CDKN1A mut (forward1, TTGAGAAGTAAACAGATGGGAGTATGAAGGGGCCTCA;reverse1, ATACTCCCATCTGTTTACTTCTCAAATGAAAAAGAATTCAGGTCTGAG; forward2, ATCCCTCCCCAGTTCATTGGAGTATGATTAGCAGCGG; reverse2, ATACTCCAATGAACTGGGGAGGGATGGGGTGGATGA). Wt or mut 3′ UTR vectors encoding Renilla luciferase were cotransfected with miR-93 mimics or negative control into HT-293T cells using Lipofectamine 2000 (Invitrogen). The luciferase activity was measured 48 h later using the Dual-Luciferase Reporter Assay System (Promega). The Renilla luciferase activity was normalized to firefly luciferase activity, and the ratios of Renilla/firefly values were presented. The experiments were performed independently in triplicate.
Statistical analysis
Statistical analyses were performed using SPSS 16.0 software (SPSS Inc.). The values were expressed as the mean ± standard deviation (SD) of three independent experiments, and the significance of the differences between two groups was calculated using a two-tailed Student's t test. χ2 tests were used to compare proportions. A one-way repeated-measures ANOVA with the Turkey method was used to determine miR-93 and CDKN1A expression in different doses of insulin. The relationship between CDKN1A and miR-93 expression was tested with two-tailed Pearson's correlation. P values < .05 were considered to be statistically significant.
Results
MiRNA expression in PCOS ovaries
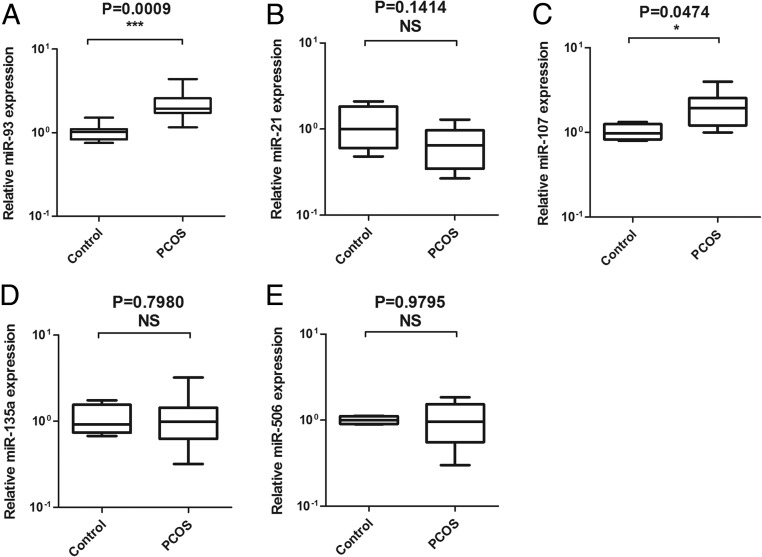
QRT-PCR was used to identify the expressions miR-93, miR-21, miR-107, miR-135a, and miR-506 in 16 PCOS ovaries, compared with the ovaries from 8 normal controls. The clinical features of the subjects were shown in Supplemental Table 1. PCOS women had significantly higher fasting insulin and testosterone than the age-matched control women. As illustrated in Figure 1A, the expression of miR-93 was significantly increased in PCOS ovaries compared with the control group (P = .009). Among them, miR-107 was also increased in the PCOS group (P = .0474). However, miR-21, miR-135a, and miR-506 showed no differences between the two groups. According to the target gene predicted by bioinformatics, we were more interested in miR-93 and chose miR-93 for further study.
Figure 1.
The expression of miR-93, miR-21, miR-107, miR-135a, and miR-506 in the cortex of the ovaries of 16 PCOS and 8 non-PCOS. MiR-93 (A) and Mir-107 (C) were higher, as expressed in the PCOS group. MiR-21 (B), miR-135a (D), and miR-506 (E) had no differences between the two groups.
MiR-93 regulated cell growth and proliferation in granulosa cells
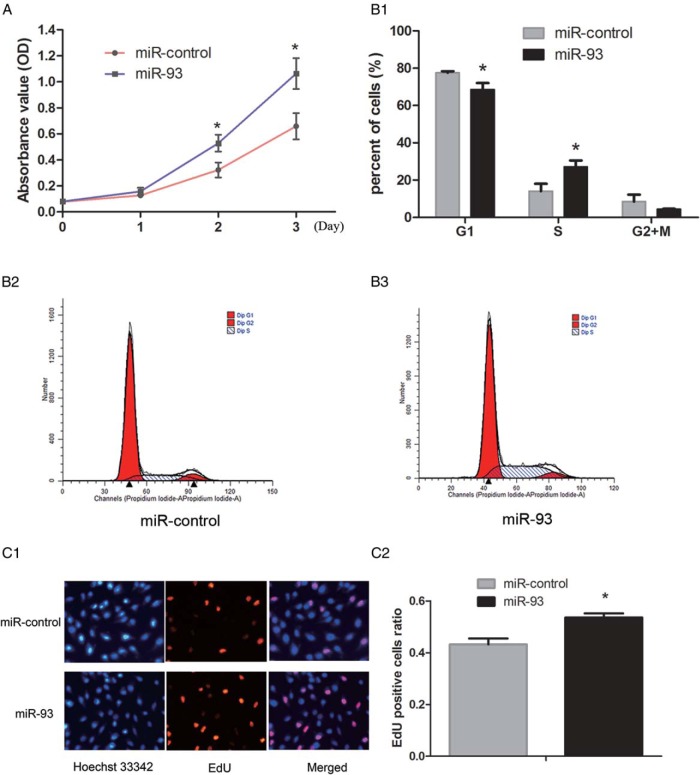
Having noted a significantly higher expression of miR-93 in the cortex of the ovaries from PCOS patients, we were interested to test the hypothesis that miR-93 might be associated with the growth and proliferation in granulosa cells. KGN cells, a human granulosa-like tumor cell line, were transiently transfected with miR-93 mimics or miR-control. The validation of miR-93 overexpression and inhibition through mimics and inhibitor was showed in Supplemental Figure 1. As illustrated in Figure 2A, the MTS assay revealed that miR-93 overexpression in KGN cells led to a promotion in proliferation (Figure 2A; P < .05). Moreover, the effect of miR-93 mimics on the cell cycle distribution was investigated using flow cytometry. Compared with miR-control at 48 h after transfection, cells transfected with miR-93 mimics displayed a decreased proportion of G1 phase cells and an increased proportion of S phase cells (Figure 2B; P < .05). The EdU assay showed that compared with the control cells, more EdU-labeled cells showed red fluorescence in the miR-93 overexpressed group (Figure 2C; P < .05). To better understand the effect of endogenous miR-93 on granulosa cells proliferation, we attempted to compare the cell growth, the distribution of cell cycle, and EdU assay of KGN cells before and after inhibition of miR-93. In contrast to the miR-93 mimics, the miR-93 inhibitor inhibited cell growth (Supplemental Figure 2A; P < .05), decreased the proportion of cells in the S phase (Supplemental Figure 2B; P < .05), but the number of EdU-positive cells showed no difference (Supplemental Figure 2C; P = .087).
Figure 2.
The effect of overexpression of miR-93 on the proliferation of granulosa cells. A, MTS assay revealed that miR-93 overexpression in KGN cells led to a promotion in proliferation. B, Flow cytometry assay displayed a decreased proportion of G1 phase cells and an increased proportion of S phase cells after overexpression of miR-93. C, The EdU assay showed that more EdU-positive cells in the miR-93 overexpressed group.
MiR-93 directly inhibited CDKN1A expression by targeting its 3′ untranslated region (UTR) in KGN cells
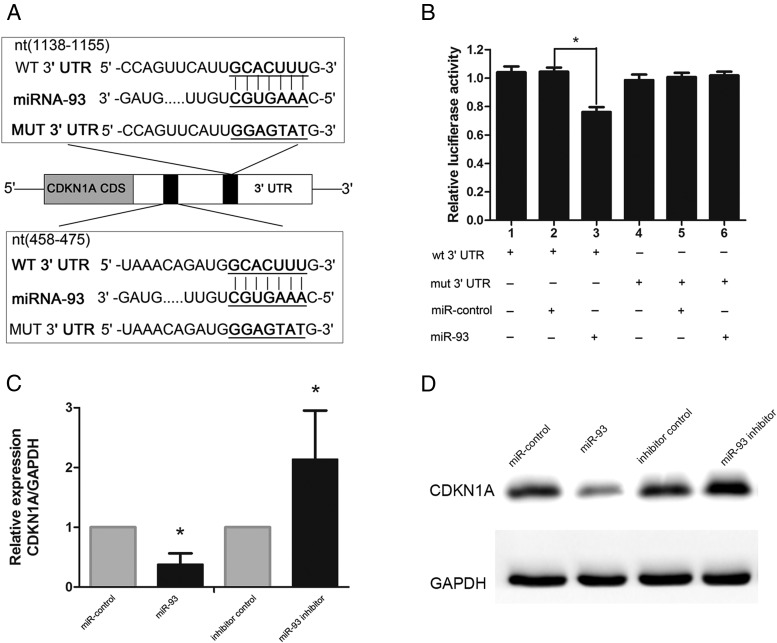
To determine the mechanism of growth promotion mediated by miR-93, we predicted its target gene. Bioinformatic prediction through starBase v2.0 was used to search for the direct mRNA targets of miR-93. Of all of the hypothetical targets of miR-93, CDKN1A, a cyclin-dependent kinase inhibitor, provoked our interest. To determine whether CDKN1A was a target gene of miR-93, we cloned the wild-type 3′ UTR of the putative miR-93 target (wt 3′ UTR) or a mutated sequence (mut 3′UTR) into a reporter plasmid downstream of the luciferase gene (Figure 3A). The results showed that miR-93 mimics attenuated the fluorescence of the wt 3′ UTR compared with the negative control (Figure 3B, lanes1, 2, and 3; P < .01), whereas mut 3′ UTR showed no response to miR-93 (Figure 3B, lanes 4, 5, and 6). To further confirm the potential role of miR-93 in the regulation of CDKN1A, we evaluated CDKN1A mRNA and protein expression levels in KGN cells in the presence of miR-93 mimics or the miR-93 inhibitor. As shown in Figure 3, C and D, overexpression of miR-93 via miR-93 mimics led to a notable decrease in CDKN1A mRNA and protein levels, whereas miR-93 inhibitor upregulated CDKN1A mRNA and protein levels compared with the negative control. These results indicated that CDKN1A is a direct target of miR-93 in granulosa cells.
Figure 3.
CDKN1A was a direct target of miR-93 in granulosa cells. A, Schematic diagram of the reporter constructs containing the predicted miR-93-binding site in the 3′ UTR of CDKN1A. B, Luciferase reporter assay of the relationship of miR-93 and CDKN1A. C, D, The overexpression of miR-93 led to a notable decrease in CDKN1A mRNA and protein levels.
Knockdown of CDKN1A promoted cell proliferation
To determine the functional contributions of CDKN1A to granulosa cell growth in vitro, we knocked down CDKN1A in KGN cells with specific siRNAs. Western blotting and qRT-PCR analysis confirmed that the CDKN1A specific siRNAs (Genepharma Co.) reduced CDKN1A protein and mRNA levels in KGN cells after 48 h post-transfection (Supplemental Figure 3A). Thereafter, an MTS assay was performed to evaluate the effect of si-CDKN1A on the proliferation on the granulosa cells. As expected, CDKN1A-specific siRNA transfected KGN cells displayed increased proliferation compared with the control (Supplemental Figure 3B). Moreover, flow cytometry analysis revealed that the percentage of S phase cells increased (Supplemental Figure 3C), and the EdU assay (Supplemental Figure 3D; P < .05) showed that more KGN cells were EdU positive when they were transfected with CDKN1A specific siRNA compared with the control group.
CDKN1A reintroduction reversed the stimulating proliferative role of miR-93
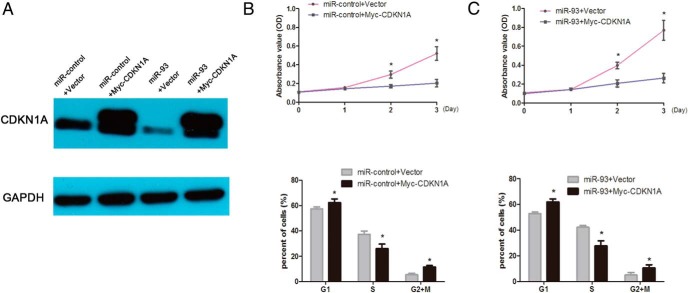
To further verify the functional connection between miR-93 and CDKN1A, KGN cells were transfected with CDKN1A expression plasmid (Myc-CDKN1A) in miR-93 mimic-transfected KGN cells. As shown in the Figure 4B, overexpression of CDKN1A inhibited KGN cells proliferation and miR-93 stimulated cell growth. However, CDKN1A reintroduction reversed the proliferative roles of miR-93 (Figure 4C), underlining the specific importance of the CDKN1A for miR-93's action in the cell proliferation.
Figure 4.
CDKN1A reintroduction reversed the stimulating proliferative role of miR-93. A, CDKN1A protein expression was determined by western blot in KGN cells. Cells were transfected with miR-93 mimics or miR-control together with plasmids for CDKN1A or empty vector. B, The MTS and flow cytometry assay displayed that overexpression of CDKN1A decreased the proliferation of cells and a decreased G1 to S transition. C, CDKN1A reintroduction decreased the proliferation of cells and reverse the role of miR-93.
CDKN1A expression was decreased in PCOS ovaries
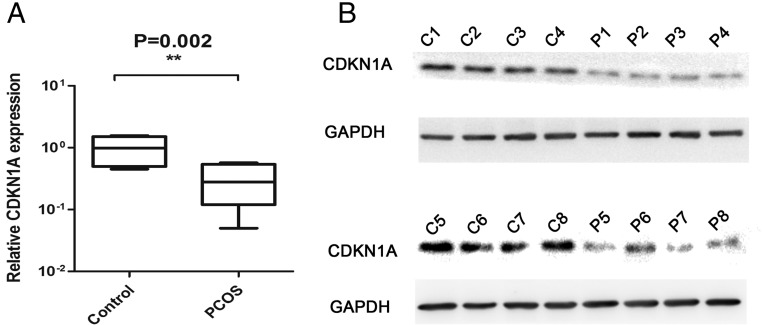
We had demonstrated that CDKN1A was the direct target of miR-93; therefore, we further tested the CDKN1A expression in the ovarian cortex. Comparing the RNA expression of CDKN1A in 16 PCOS patients and 8 controls, we observed the significant downregulated in PCOS group (Figure 5A). We then used 8 PCOS and 8 control ovarian cortexes for protein assay. As shown in Figure 5B, CDKN1A was decreased in PCOS group. Next, we determined the correlation between CDKN1A and miR-93 and found that miR-93 expression levels were inversely correlated with CDKN1A mRNA levels (Supplemental Figure 4, r = −0.6314; P < .001).
Figure 5.
The expression of CDKN1A in the cortex of ovaries. A, B, The expression of CDKN1A was significantly downregulated in the PCOS group.
Insulin induced upregulation of miR-93 expression and stimulated proliferation
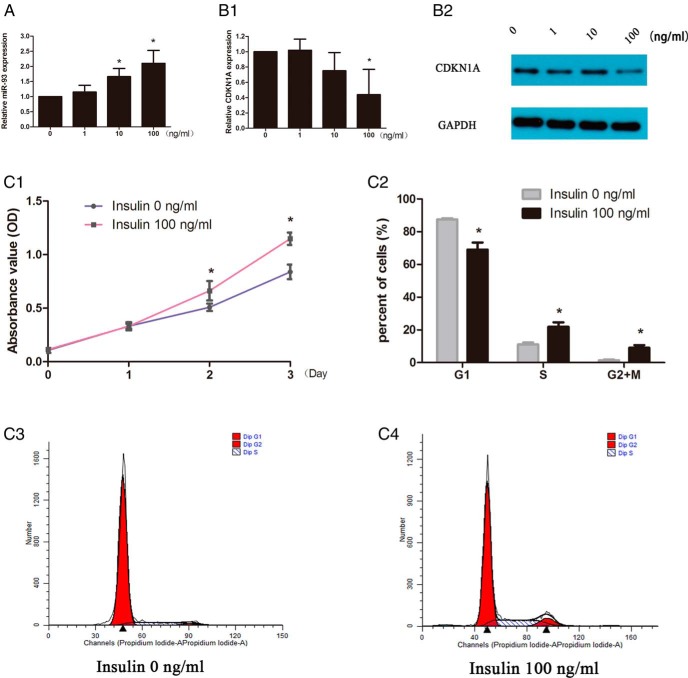
Hyperinsulinemia is one of the most common features of PCOS. We hypothesized that the differences in the expression of miR-93 in our study might be caused by high concentrations of insulin. We performed qRT-PCR using KGN cells to assess the expression of miR-93 on stimulation with insulin. QRT-PCR showed approximately 1.66-fold and 2.10-fold increase in levels of miR-93 with 10 and 100 ng/mL insulin for 24 h, respectively (Figure 6A). Furthermore, the expression of CDKN1A was downregulated after 100 ng/mL insulin treatment for 48 h (Figure 6B). Therefore, we chose the concentration of 100 ng/mL of insulin for proliferation study and found that high concentration insulin could stimulate KGN cells growth as was shown in Figure 6C.
Figure 6.
The effect of varying insulin in the culture medium on the expression of miR-93 and CDKN1A in granulosa cells. A, Insulin at concentration of 10 ng/mL or above could promote the expression of miR-93 in granulosa cells for 24 h. B, Insulin at a concentration of 100 ng/mL downregulated the expression of CDKN1A including mRNA and protein for 48 h. C, High concentration (100 ng/mL) of insulin promoted the proliferation of KGN cells.
Discussion
We have demonstrated, for the first time, that miR-93 is expressed at high levels in PCOS ovaries and promotes granulosa cells proliferation, which might account for the disordered folliculogenesis in PCOS. Our finding proved that in vitro overexpression of miR-93 could promote proliferation and G1 to S transition, and moreover, the effects were reversed when the endogenous miR-93 was inhibited. Even though miRNA-93 had been proved to be a tumor promoter (31–33), the functions of miR-93 in ovarian granulosa cells have not been characterized. In the current study, we established that miRNA-93 could be a granulosa cell proliferation promoter.
Bioinformatic predictions revealed that CDKN1A was a target of miR-93. Moreover, the dual-luciferase reporter assay indicated that miR-93 directly targeted the 3′ UTR of CDKN1A. As a result, introduction of miR-93 mimics in granulosa cells decreased the mRNA and protein levels of CDKN1A, whereas the inhibition of miR-93 increased the mRNA and protein levels of CDKN1A. Furthermore, knockdown of CDKN1A produced similar effects as an overexpression of miR-93, including increased cells at the S phase and promotion of proliferation. However, CDKN1A reintroduction reversed the function of miR-93. We further tested the expression of CDKN1A in the ovarian cortex and found that it was downregulated in the PCOS group. These results suggested that miR-93 and its target CDKN1A together regulated the proliferation of granulosa cells in PCOS ovaries.
Recently, CDKN1A was found to function as both a classical tumor suppressor and an oncogene (34). However, studies of CDKN1A in ovarian granulosa cells are rare and its function remains unclear. In different follicle stages, the expression of CDKN1A varies. A study pointed out that the expression of CDKN1A mRNA was significantly lower in granulosa cells from estrogen-active dominant follicles than estrogen-inactive dominant follicles and preovulatory follicles (35). By contrast, another study suggested that the expression of CDKN1A did not vary in granulosa and theca cells by the follicle stage (36). After ovulation triggering, CDKN1A was upregulated to decrease GC proliferation and promote final granulosa cell differentiation (37).Our finding was consist with these previous studies, in that inhibition of CDKN1A could promote GC proliferation.
The differences in the expression of miR-93 and cellular proliferation observed in our study may be due to the high concentrations of insulin that are characteristically found in PCOS. Our results indicated that high concentration of insulin could upregulate the expression of miR-93, downregulate CDKN1A, and stimulate the proliferation of KGN cells. As well as its known, insulin is involved in the regulation of ovarian function, and has been shown to stimulate proliferation and hormone production by ovarian granulosa cells in many species. One report demonstrated that insulin could stimulate cell proliferation in buffalo granulosa cells at concentrations of 50 ng/mL and above (38). A study by Chen et al had reported the overexpression of miR-93 in the adipose tissues of PCOS-IR patients with increased insulin (15). Metformin, an antidiabetic drug that effectively restores cyclicity and spontaneous ovulation in women with PCOS, increased the expression of CDKN1A in cultured bovine granulosa cells (39). All these results were consistent with our study that high concentration of insulin could upregulate miR-93 and promote cell proliferation through targeting CDKN1A in PCOS.
Conclusion
Our study revealed that the expression of miR-93 was increased in PCOS granulosa cells, and by targeting CDKN1A to promote the proliferation. We observed that insulin could upregulate the expression of miR-93 and promote proliferation. These observations provide a new insight into the dysfunction of granulosa cells in PCOS.
Acknowledgments
The authors would like to thank the Key Laboratory of Malignant Tumor Gene Regulation and Target Therapy of Guangdong Higher Education Institutes for providing the instruments for research.
This work was supported by grants provided by the National Natural Science Foundation of China (Grant No. 81 370 680), the specialized research fund for the doctoral program of Chinese Ministry of Education (Grant No. 20130171130009), the Natural Science Foundation of the Key Research Project of Guangdong Province (2013020012660), 2010 Key Project of Research of the National Ministry of Health (WGCH[2010]439).
Disclosure Summary: The authors have nothing to disclose.
Footnotes
- FBS
- fetal bovine serum
- FT
- free testosterone
- mFG
- modified Ferriman-Gallwey score
- miRNAs
- MicroRNAs
- PCOS
- polycystic ovary syndrome
- PVDF
- polyvinylidene difluoride
- rh
- recombinant human
- siRNAs
- small-interfering RNAs
- TT
- total testosterone
- UTR
- untranslated region.
References
- 1. Azziz R, Sanchez LA, Knochenhauer ES, et al. Androgen excess in women: experience with over 1000 consecutive patients. J Clin Endocrinol Metab. 2004;89:453–462. [DOI] [PubMed] [Google Scholar]
- 2. Azziz R, Carmina E, Dewailly D, et al. Positions statement: criteria for defining polycystic ovary syndrome as a predominantly hyperandrogenic syndrome: an Androgen Excess Society guideline. J Clin Endocrinol Metab. 2006;91:4237–4245. [DOI] [PubMed] [Google Scholar]
- 3. Franks S, McCarthy MI, Hardy K. Development of polycystic ovary syndrome: involvement of genetic and environmental factors. Int J Androl. 2006;29:278–285; discussion 286–290. [DOI] [PubMed] [Google Scholar]
- 4. Erickson GF, Magoffin DA, Garzo VG, Cheung AP, Chang RJ. Granulosa cells of polycystic ovaries: are they normal or abnormal? Hum Reprod. 1992;7:293–299. [DOI] [PubMed] [Google Scholar]
- 5. Hughesdon PE. Morphology and morphogenesis of the Stein-Leventhal ovary and of so-called “hyperthecosis”. Obstet Gynecol Surv. 1982;37:59–77. [DOI] [PubMed] [Google Scholar]
- 6. Vendola KA, Zhou J, Adesanya OO, Weil SJ, Bondy CA. Androgens stimulate early stages of follicular growth in the primate ovary. J Clin Invest. 1998;101:2622–2629. [DOI] [PMC free article] [PubMed] [Google Scholar]
- 7. Stubbs SA, Stark J, Dilworth SM, Franks S, Hardy K. Abnormal preantral folliculogenesis in polycystic ovaries is associated with increased granulosa cell division. J Clin Endocrinol Metab. 2007;92:4418–4426. [DOI] [PubMed] [Google Scholar]
- 8. Das M, Djahanbakhch O, Hacihanefioglu B, et al. Granulosa cell survival and proliferation are altered in polycystic ovary syndrome. J Clin Endocrinol Metab. 2008;93:881–887. [DOI] [PMC free article] [PubMed] [Google Scholar]
- 9. Ying SY, Chang DC, Miller JD, Lin SL. The microRNA: overview of the RNA gene that modulates gene functions. Methods Mol Biol. 2006;342:1–18. [DOI] [PubMed] [Google Scholar]
- 10. Voorhoeve PM, le Sage C, Schrier M, et al. A genetic screen implicates miRNA-372 and miRNA-373 as oncogenes in testicular germ cell tumors. Cell. 2006;124:1169–1181. [DOI] [PubMed] [Google Scholar]
- 11. Medina PP, Nolde M, Slack FJ. OncomiR addiction in an in vivo model of microRNA-21-induced pre-B-cell lymphoma. Nature. 2010;467:86–90. [DOI] [PubMed] [Google Scholar]
- 12. Rigoutsos I, Furnari F. Gene-expression forum: Decoy for microRNAs. Nature. 2010;465:1016–1017. [DOI] [PubMed] [Google Scholar]
- 13. Dehwah MA, Xu A, Huang Q. MicroRNAs and type 2 diabetes/obesity. J Genet Genomics. 2012;39:11–18. [DOI] [PubMed] [Google Scholar]
- 14. Sang Q, Yao Z, Wang H, et al. Identification of MicroRNAs in Human Follicular Fluid: Characterization of MicroRNAs That Govern Steroidogenesis in Vitro and Are Associated With Polycystic Ovary Syndrome in Vivo. J Clin Endocrinol Metab. 2013;98:3068–3079. [DOI] [PubMed] [Google Scholar]
- 15. Chen YH, Heneidi S, Lee JM, et al. miRNA-93 Inhibits GLUT4 and Is Overexpressed in Adipose Tissue of Polycystic Ovary Syndrome Patients and Women With Insulin Resistance. Diabetes. 2013;62:2278–2286. [DOI] [PMC free article] [PubMed] [Google Scholar]
- 16. Murri M, Insenser M, Fernández-Durán E, San-Millán JL, Escobar-Morreale HF. Effects of polycystic ovary syndrome (PCOS), sex hormones, and obesity on circulating miRNA-21, miRNA-27b, miRNA-103, and miRNA-155 expression. J Clin Endocrinol Metab. 2013;98:E1835–E1844. [DOI] [PubMed] [Google Scholar]
- 17. McCallie B, Schoolcraft WB, Katz-Jaffe MG. Aberration of blastocyst microRNA expression is associated with human infertility. Fertil Steril. 2010;93:2374–2382. [DOI] [PubMed] [Google Scholar]
- 18. Johnnidis JB, Harris MH, Wheeler RT, et al. Regulation of progenitor cell proliferation and granulocyte function by microRNA-223. Nature. 2008;451:1125–1129. [DOI] [PubMed] [Google Scholar]
- 19. Wang Y, Baskerville S, Shenoy A, Babiarz JE, Baehner L, Blelloch R. Embryonic stem cell-specific microRNAs regulate the G1-S transition and promote rapid proliferation. Nat Genet. 2008;40:1478–1483. [DOI] [PMC free article] [PubMed] [Google Scholar]
- 20. Chen JF, Mandel EM, Thomson JM, et al. The role of microRNA-1 and microRNA-133 in skeletal muscle proliferation and differentiation. Nat Genet. 2006;38:228–233. [DOI] [PMC free article] [PubMed] [Google Scholar]
- 21. Sirotkin AV, Ovcharenko D, Grossmann R, Lauková M, Mlyncek M. Identification of microRNAs controlling human ovarian cell steroidogenesis via a genome-scale screen. J Cell Physiol. 2009;219:415–420. [DOI] [PubMed] [Google Scholar]
- 22. Carletti MZ, Fiedler SD, Christenson LK. MicroRNA 21 blocks apoptosis in mouse periovulatory granulosa cells. Biol Reprod. 2010;83:286–295. [DOI] [PMC free article] [PubMed] [Google Scholar]
- 23. Ribas J, Ni X, Haffner M, et al. miR-21: an androgen receptor-regulated microRNA that promotes hormone-dependent and hormone-independent prostate cancer growth. Cancer Res. 2009;69:7165–7169. [DOI] [PMC free article] [PubMed] [Google Scholar]
- 24. Tang W, Jiang Y, Mu X, Xu L, Cheng W, Wang X. MiR-135a functions as a tumor suppressor in epithelial ovarian cancer and regulates HOXA10 expression. Cell Signal. 2014;26:1420–1426. [DOI] [PubMed] [Google Scholar]
- 25. Wang G, Wang Y, Feng W, et al. Transcription factor and microRNA regulation in androgen-dependent and -independent prostate cancer cells. BMC Genomics. 2008;9 Suppl 2:S22. [DOI] [PMC free article] [PubMed] [Google Scholar]
- 26. Liu G, Sun Y, Ji P, et al. MiR-506 suppresses proliferation and induces senescence by directly targeting the CDK4/6-FOXM1 axis in ovarian cancer. J Pathol. 2014;233:308–318. [DOI] [PMC free article] [PubMed] [Google Scholar]
- 27. Rotterdam ESHRE/ASRM-Sponsored PCOS Consensus Workshop Group. Revised 2003 consensus on diagnostic criteria and long-term health risks related to polycystic ovary syndrome. Fertil Steril. 2004;81(1):19–25. [DOI] [PubMed] [Google Scholar]
- 28. Zhao X, Ni R, Li L, et al. Defining hirsutism in Chinese women: a cross-sectional study. Fertil Steril. 2011;96:792–796. [DOI] [PubMed] [Google Scholar]
- 29. Chen X, Yang D, Li L, Feng S, Wang L. Abnormal glucose tolerance in Chinese women with polycystic ovary syndrome. Hum Reprod. 2006;21:2027–2032. [DOI] [PubMed] [Google Scholar]
- 30. Xu S, Feng Z, Zhang M, et al. hSSB1 binds and protects p21 from ubiquitin-mediated degradation and positively correlates with p21 in human hepatocellular carcinomas. Oncogene. 2011;30:2219–2229. [DOI] [PubMed] [Google Scholar]
- 31. Xu D, He XX, Chang Y, Sun SZ, Xu CR, Lin JS. Downregulation of MiR-93 expression reduces cell proliferation and clonogenicity of HepG2 cells. Hepatogastroenterology. 2012;59:2367–2373. [DOI] [PubMed] [Google Scholar]
- 32. Fang L, Deng Z, Shatseva T, et al. MicroRNA miR-93 promotes tumor growth and angiogenesis by targeting integrin-β8. Oncogene. 2011;30:806–821. [DOI] [PubMed] [Google Scholar]
- 33. Liu S, Patel SH, Ginestier C, et al. MicroRNA93 regulates proliferation and differentiation of normal and malignant breast stem cells. PLoS Genet. 2012;8:e1002751. [DOI] [PMC free article] [PubMed] [Google Scholar]
- 34. Warfel NA, El-Deiry WS. p21WAF1 and tumourigenesis: 20 years after. Curr Opin Oncol. 2013;25:52–58. [DOI] [PubMed] [Google Scholar]
- 35. Shimizu T, Hirai Y, Miyamoto A. Expression of cyclins and cyclin-dependent kinase inhibitors in granulosa cells from bovine ovary. Reprod Domest Anim. 2013;48:e65–e69. [DOI] [PubMed] [Google Scholar]
- 36. Bayrak A, Oktay K. The expression of cyclin-dependent kinase inhibitors p15, p16, p21, and p27 during ovarian follicle growth initiation in the mouse. Reprod Biol Endocrinol. 2003;1:41. [DOI] [PMC free article] [PubMed] [Google Scholar]
- 37. Wissing ML, Kristensen SG, Andersen CY, et al. Identification of new ovulation-related genes in humans by comparing the transcriptome of granulosa cells before and after ovulation triggering in the same controlled ovarian stimulation cycle. Hum Reprod. 2014;29:997–1010. [DOI] [PubMed] [Google Scholar]
- 38. Bhushan S, Palta P, Bansal N, Sharma V, Manik RS. Effect of insulin on the proliferation of and progesterone production by buffalo granulosa cells in vitro. Vet Rec. 2005;157:746–747. [DOI] [PubMed] [Google Scholar]
- 39. Tosca L, Ramé C, Chabrolle C, Tesseraud S, Dupont J. Metformin decreases IGF1-induced cell proliferation and protein synthesis through AMP-activated protein kinase in cultured bovine granulosa cells. Reproduction. 2010;139:409–418. [DOI] [PubMed] [Google Scholar]


