

Abstract
Homology modeling predicts protein structures using known structures of related proteins as templates. We developed MULTIDOMAIN ASSEMBLER (MDA) to address the special problems that arise when modeling proteins with large numbers of domains, such as fibronectin with 30 domains, as well as cases with hundreds of templates. These problems include how to spatially arrange nonoverlapping template structures, and how to get the best template coverage when some sequence regions have hundreds of available structures while other regions have a few distant homologs. MDA automates the tasks of template searching, visualization, and selection followed by multidomain model generation, and is part of the widely used molecular graphics package UCSF CHIMERA (University of California, San Francisco). We demonstrate applications and discuss MDA’s benefits and limitations.
Introduction
At least 75% of all proteins have a multidomain architecture, and while the number of newly discovered single-domain protein families has started leveling off, the number of newly discovered multidomain architectures continues to increase rapidly (1). Most multidomain proteins are too large or flexible to be structurally resolved in one piece. In many cases, structures of individual domains, which are the autonomous folding units of multidomain proteins, are also incomplete or unavailable. We found that 23% of all protein chains in the Protein Data Bank (PDB, accessed in October 2014) have a corresponding UniProt sequence that is more than twice as long. However, because nearly half of the sequences in the human proteome share an identity of 30% or higher with a sequence of known structure (2), homology models can be generated for many poorly characterized domains, and these domains can then be assembled into multidomain structures.
Many integrated homology modeling protocols are available, either as standalone programs, e.g., BIOASSEMBLY MODELER (3), or as web services, e.g., HHPRED (4), ITASSER (5), MODWEB (6), or PHYRE (7). These tools are optimized to find distant homologs of target sequences where a single template is usually big enough to cover the entire sequence. In contrast, we are interested in modeling sequences that are too long to be covered by a single template, having as many as hundreds or thousands of available templates. In this case, sequence-similarity search tools like BLAST (8) with limited filtering options may retrieve too many possible templates for one region of the target sequence, and none for another.
To address these difficulties, we have developed MULTIDOMAIN ASSEMBLER (MDA) as part of the molecular graphics package UCSF CHIMERA (9). The purpose of MDA is 1) to provide an intuitive three-dimensional overview of all available homologs and templates in a single three-dimensional viewer interface, and 2) to generate assembled models of multidomain proteins that can be used for visualization and hypothesis generation or that can serve as input for further computational modeling. MDA features novel filtering options for identifying a small set of templates that maximizes structural coverage of the target sequence. MDA displays template structures in a three-dimensional layout and thus allows for the immediate visualization of template binding partners, variation in conformations, gaps in structural coverage, and quality of the interdomain packing, which is useful for comparative analysis beyond the primary goal of multidomain modeling. In contrast to AIDA (10), MDA does not model the relative orientations of domains arising from different, nonoverlapping templates, but it arranges them to minimize steric collisions and the knots that can arise when modeling multidomain proteins.
Example systems
To illustrate how MDA works, we modeled three large multidomain proteins: fibronectin (Fn), Gag, and GagPol. Fn is present in the extracellular matrix and serves important roles in embryogenesis, wound healing, and cell adhesion in vertebrates (11). The Fn dimer consists of two long monomers, each with ∼30 modules (Fig. 1 A). There are various gaps in template coverage, and many interactions of adjacent domains are either unknown or known to be flexible, thus complicating the task of generating a reasonable model without clashes or knots.
Figure 1.

(A) Schematic structure of the 30 domains of fibronectin (Fn) with three domain types: Fn type I (FnI, circles), Fn type II (FnII, hexagons), and Fn type III (FnIII, rectangles). (Open) Domains in human Fn whose structures are not available in the PDB. (B) Schematic structure of HIV Gag and GagPol polyproteins. Gag and GagPol share the MA domain, the N-terminal and C-terminal CA domains (CAn and CAc), and the NC domain. The p6 domain of Gag differs from the p6 domain of GagPol, and GagPol has the additional domains Protease (PR), Reverse-Transcriptase (RT), and Integrase (Int). Structures of fragments of entire domains have been determined for several HIV strains. (C) Schematic overview of the MDA pipeline (dotted circles indicate selections made by MDA or the user at each step; see main text for details). To see this figure in color, go online.
The viral polyproteins Gag and GagPol govern the assembly of Human Immunodeficiency Virus (HIV) (12). Gag and GagPol are composed of multiple domains connected by flexible linkers (Fig. 1 B). Full-length models of Gag and GagPol could be used together with data on intermolecular interactions (13) to construct models of the entire immature virion, similar to what has been achieved for the mature form (14). While a wealth of structures is available for the Reverse-Transcriptase domain, other regions are covered poorly (including the disordered region p6) and structures in those areas are filtered out with a simple BLAST score cutoff. MDA is able to find small sets of covering templates without requiring manual processing of hundreds of templates.
Materials and Methods
MDA accepts a FASTA file (National Institutes of Health, Bethesda, MD; http://www.ncbi.nlm.nih.gov/BLAST/blastcgihelp.shtml) or UniProt accession number (15) as input for the sequence of a target multidomain protein. In a series of automated steps (Fig. 1 C), MDA submits this target sequence as the query in a BLAST search to find structures with similar sequences in the PDB (16), then filters the results with various options to limit the number of structures returned. To find the best structural coverage, MDA can limit the number of hits to a specified coverage depth. All hits are considered in order from highest to lowest sequence identity. A hit is kept if it covers at least n consecutive residues where each residue is covered by fewer than m already accepted (higher-identity) hits. The parameters n and m can be specified by the user. This provides a more complete coverage of the target sequence with structural templates than can usually be achieved with the BLAST winnowing parameter (17), which has not been optimized for template search. Besides specifying cutoffs for BLAST score and sequence identity with the target sequence, specific PDB structures can be explicitly included or excluded for additional control of template selection. If desired, all structures with a specific UniProt ID can be included, which ensures that all available structures of the target protein will be displayed. Furthermore, MDA can be configured to only allow one hit per PDB chain, i.e., discard hits with the same PDB ID and chain that align elsewhere to the target sequence. This option serves to highlight only the best sequence location for a given template.
The structures of the filtered hits are then loaded together into a single viewing window of UCSF CHIMERA (Fig. 2). MDA traverses the list of all structures sorted by their alignment position to the target sequence and partitions them into sets, with each set containing only structures that have an overlap of >10 residues. Within a set, structures are aligned to each other using least-squares fitting of the overlapping residues. Within a set, MDA stacks structures vertically, but this option can be disabled to optimize initial placement of templates for homology modeling (see below). Sets of structures are then arranged from left to right, with the two proximal termini of the two closest structures from different sets being placed at a horizontal distance x, which is calculated as follows: If the alignment of the two neighboring structures from different sets overlaps by a range of 0–10 residues, x is set to zero. If the sequence alignment of the two neighboring structures displays a gap of g residues (residues where no structure was found), we set x = 3.17 Å × g1/3, where we assume 0.73 mL/g for the partial specific volume of proteins (18) and an average weight of 110 Da per residue. This spatial arrangement of templates minimizes steric overlaps and knots in the output structures generated by MODELLER (20). To visualize gaps in structural coverage, a sphere with diameter x is drawn in the three-dimensional view.
Figure 2.

(A) Structural overview of Fn domain structures (templates) arranged from N to C with homologs stacked downward by filtered ranking. (Gray) Residues that aligned in BLAST; (black) residues that did not align; (red) residues that differ from the target sequence; and (blue) co-complexed chains. (Gray spheres) Gaps with no structural coverage (volumes proportional to missing residues). Image saved from CHIMERA with ambient-only lighting and silhouettes. (B) Eliminating all but the structures with highest percent identity per residue, allowing multiple hits per PDB, and manually removing a few redundant templates results in a different ensemble with 14 templates and smaller gaps. (C) A model of monomeric Fn produced by MDA using MODELLER and the templates shown in (B) (see Table S1 and Fig. S1 for a detailed protocol) can be compared with experimental data or serve as an input structure for subsequent computational modeling approaches. The overall length of the model measures 90 nm, and the distance between FnIII-7 and FnIII-15 measures 29 nm, which agrees with literature values (25). (D) The same model shown in surface representation and colored by electrostatic potential (red, −10 kcal/mol∗e; white, 0; blue, +10 kcal/mol∗e). To see this figure in color, go online.
Many structures will have residues that differ from the target sequence, contain (sub-) domains that did not align in BLAST, and include ligands and binding partners. MDA uses color to distinguish these different residue types. MDA offers several different coloring options, which can be customized via CHIMERA’s command line interface. Each structure rotates around its own center, allowing the user to inspect and compare multiple templates simultaneously.
Homology modeling relies on an accurate alignment of the target and template sequences. The sequence alignment from BLAST is automatically shown in CHIMERA’s built-in MultalignViewer (19), in which it can be adjusted, if necessary, before modeling. MDA also automatically sets up the MODELLER input script with appropriate parameters for calculating the homology model (20): MODELLER’s default parameters for model optimization and refinement are modified such that longer conjugate gradient and molecular-dynamics calculations are performed. This is important for larger systems because it minimizes the risk of clashes and knots in the loop regions. MODELLER automatically handles cases where more than one template is provided for the same sequence region (multiple templates can increase the quality of the output models in some cases (21)). To provide the user with a simple way to coarsely control domain arrangement, MDA accepts additional distance restraints for homology modeling. These restraints can stem from a variety of experimental data, including light microscopy, electron microscopy, or chemical cross-linking (22). Restraints can be applied to Cα-atoms of specified residues or the centers of mass of ranges of residues. MODELLER then runs either locally on the user’s computer or remotely via a web service and returns the results to CHIMERA, as described previously (23). Distances can thus be measured and verified immediately in CHIMERA’s three-dimensional viewer.
Templates spanning multiple domains provide structural information on the domain interfaces. In case of nonoverlapping templates, MDA’s interdomain packing is solely designed to avoid problems of clashes and knots in the homology modeling calculation, and thus MDA will not find new binding interfaces between domains (such interfaces are shown by the straight red lines in Fig. 1 C, which could also occur between non-sequence-contiguous domains). MDA’s visualization of the template arrangement shows which domain interfaces are intratemplate or intertemplate, and thus which domain interfaces are experimentally observed. The quality of the individual domains in the homology model are characterized by metrics provided by MODELLER’s standard assessment routines, e.g., DOPE (24), but these do not provide information about the quality of the interdomain packing and interactions.
Experienced CHIMERA users will only need the documentation page of MDA to get started (www.rbvi.ucsf.edu/chimera/docs/UsersGuide/midas/mda.html).
More details on download and documentation for novice users can be found in the Supporting Material.
Results
Example use case 1: fibronectin
Monomeric Fn has an archetypical multidomain architecture ideal for testing MDA. After submitting the 2296-amino-acid sequence of the plasma Fn monomer (Uniprot:P02751 isoform 8) to MDA, BLAST returns 501 unique PDB hits with a total of 1593 template structure alignments, where many structures align to multiple similar Fn domains. Adjusting filter options (to keep only the best hit for each PDB and setting the BLAST score cutoff to 190) narrows the results down to 30 structures (Fig. 2 A and Table S1 in the Supporting Material). This provides an initial overview of available structures with high sequence similarity to the target sequence. The visualization reveals that with these filtering criteria, no templates were found for several regions of the sequence, and some regions have been subject to more structure determination experiments than others (compare the N- and C-terminal regions, for example). It also reveals co-complexed chains (e.g., bacterial adhesins binding to N-terminal FnI modules) and residues that are mutated with respect to the target sequence.
MDA can further narrow the set of potential templates by keeping only the best hit for each residue of the target sequence (Fig. 2 B). Allowing MDA to align the same PDB structure at multiple positions reduces the size of the gaps as indicated by fewer and smaller spheres. After inspecting the sequence alignment and making a final selection of templates, MDA can invoke MODELLER to produce a homology model of the Fn monomer (Fig. 2 C and Fig. S1). Because MDA lays out the templates in linear form (Fig. 2 B), MODELLER returns a mostly linear arrangement of modules, which approximates the maximum length that an Fn monomer can attain without secondary structure unfolding. Even without further sampling of the conformational space to model domain interactions, we can compare this elongated structure with experimental data and color it by electrostatic potential ((25), Fig. 2, C and D, and the Supporting Material).
Example use case 2: Gag and GagPol
MDA run on the Gag sequence (UniProt:P12493) returns 384 BLAST hits that can be filtered before MODELLER generates a full-length Gag model (Fig. 3 A and Table S2). Additional data from electron microscopy studies of whole immature HIV virion structures or purified Gag can be incorporated as MODELLER distance restraints. A model generated with three experimentally derived domain-domain distance restraints (26) is shown in Fig. 3 B (see Table S3 for a detailed description of these restraints). Restraints can also be used in an exploratory fashion to test structural hypotheses. For example, GagPol (Uniprot:P12497) can be modeled using the restraints from electron microscopy (26) combined with two exploratory restraints to create the elongated structure shown in Fig. 3 C (see Tables S4 and S5 for details). Models obtained with different combinations of experimental and exploratory restraints can then serve as structural inputs for assembling models of entire immature virions using software such as CELLPACK (27). Such mesoscale models (Fig. 3 D) can provide insights into the molecular interactions that give rise to the emergent architecture of the virus (14), facilitate hypothesis generation on HIV maturation, and provide structural models for visualization and education (28,29).
Figure 3.
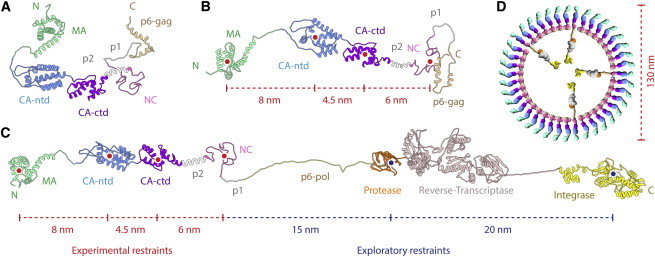
MDA output structures of Gag polyproteins with (A) no restraints, and (B) three distance restraints derived from electron microscopy data (26) (indicated with red dotted lines) applied at the geometric centers of domains (red dots). (C) An MDA output of GagPol with two exploratory restraints (shown as blue dotted lines) added, generates an elongated molecule while respecting bond lengths. The model visually reveals regions of interest such as the huge linker (56 amino acids), consisting of a structurally plausible trans-frame peptide, and p6-pol (believed to be disordered), connecting Gag and the protease and regions of concern such as the structurally unlikely straight sequence connecting Reverse-Transcriptase with Integrase. These restraints change the shape of the resulting model to coarsely approximate the linear arrangement found in the lattice of immature virions as visually hypothesized with the sketch in (D). To see this figure in color, go online.
Discussion
MDA provides a user-friendly pipeline (Fig. 1) for creating models of large multidomain proteins with hundreds of available templates, some of which are nonoverlapping. In example systems of human Fn (Fig. 2) and HIV Gag (Fig. 3), MDA showed adequate interactive performance (discussed in more detail in Table S6), but future improvements may include an option to use HHBLITS (30) as a faster alternative to BLAST. For both example systems, MDA generates output structures with a linear arrangement of domains. In fibrillar form, Fn is known to be extended, similar to the default model produced by MDA (11). For Gag, we used experimentally derived distance restraints to create an elongated conformation that reflects the domain arrangement in the context of an immature virion.
Depending on the length of the interdomain linkers and the nature of the domain-domain interfaces, a linear arrangement of domains likely represents only one possible conformation in an ensemble of many different domain packings (31). For example, Fn in solution is thought to be in a more globular state (11). Therefore, multidomain protein models generated with MDA can only provide the starting point for subsequent computational techniques that will sample possible conformations of disordered regions or different domain-domain interactions. Techniques for sampling include molecular dynamics (32), Brownian dynamics, normal mode analysis, ab initio modeling of linkers (33), constrained molecular docking (34,35), or integrative modeling incorporating additional experimental data as restraints (22). Homology model quality scores provided by MODELLER and a variety of web services (2) will not properly assess overall ultrastructure for multidomain proteins containing well-modeled domains connected by poorly constrained linkers or disordered regions.
MDA modeling is performed in the three-dimensional visualization package UCSF CHIMERA, providing rich structural information on templates. This has many advantages over sequence-oriented modeling pipelines. MDA allows for rapid inspection and comparison of co-complexed molecules and multimeric packing of domains in crystal asymmetric units that might be biologically relevant, as well as visual assessment of conformational heterogeneity of overlapping templates. Interdomain distances in the output structures can be measured easily and immediately upon model generation, and then adjusted in the restraints-file if necessary to allow for an efficient iterative cycle of hypothesis generation. We have found that the unique capability to display, automatically align, and color all of the homologs with known structure for the target protein in the same three-dimensional space for simultaneous visual analysis provides a useful summary of contemporary structural knowledge beyond the task of homology modeling. MDA models can be used for measuring basic physical properties like maximum distances or charge distributions, as illustrated in Fig. 2 C, although usually they will serve as starting structures for further modeling. Systems that might benefit from MDA due to their modular architecture and the number of homolog structures available include filamin, fibrillin, talin, von Willebrand factor, tenascin, and myosin-binding proteins, among many others. As larger proteins are explored computationally, MDA will provide a valuable tool to search and compare templates, perform homology modeling, and provide qualitative visual representations of large multidomain proteins.
Author Contributions
All authors designed the research. S.H. wrote the software extension and performed homology modeling of example systems. T.D.G. contributed to software development. All authors contributed to writing the article.
Acknowledgments
The authors thank David Goodsell for helpful discussions, Eric Pettersen for programming assistance, and Elaine Meng for careful proofreading of the article.
This work was supported in part by a postdoctoral fellowship from the Swiss National Science Foundation to S.H., gift donations from Autodesk to G.T.J., a grant from the National Institutes of Health (No. P41-GM103311) to T.E.F., a QB3 Fellowship grant from the California Institute for Quantitative Biosciences to G.T.J., and a UCSF School of Pharmacy, 2013 Mary Anne Koda-Kimble Seed Award for Innovation to G.T.J.
Supporting Material
Supporting Citations
References (36,37) appear in the Supporting Material.
References
- 1.Levitt M. Nature of the protein universe. Proc. Natl. Acad. Sci. USA. 2009;106:11079–11084. doi: 10.1073/pnas.0905029106. [DOI] [PMC free article] [PubMed] [Google Scholar]
- 2.Schwede T. Protein modeling: what happened to the “protein structure gap”? Structure. 2013;21:1531–1540. doi: 10.1016/j.str.2013.08.007. [DOI] [PMC free article] [PubMed] [Google Scholar]
- 3.Shapovalov M.V., Wang Q., Dunbrack R.L., Jr. BIOASSEMBLYMODELER (BAM): user-friendly homology modeling of protein homo- and heterooligomers. PLoS ONE. 2014;9:e98309. doi: 10.1371/journal.pone.0098309. [DOI] [PMC free article] [PubMed] [Google Scholar]
- 4.Söding J., Biegert A., Lupas A.N. The HHPRED interactive server for protein homology detection and structure prediction. Nucleic Acids Res. 2005;33:W244–W248. doi: 10.1093/nar/gki408. [DOI] [PMC free article] [PubMed] [Google Scholar]
- 5.Roy A., Kucukural A., Zhang Y. I-TASSER: a unified platform for automated protein structure and function prediction. Nat. Protoc. 2010;5:725–738. doi: 10.1038/nprot.2010.5. [DOI] [PMC free article] [PubMed] [Google Scholar]
- 6.Eswar N., John B., Sali A. Tools for comparative protein structure modeling and analysis. Nucleic Acids Res. 2003;31:3375–3380. doi: 10.1093/nar/gkg543. [DOI] [PMC free article] [PubMed] [Google Scholar]
- 7.Kelley L.A., Sternberg M.J. Protein structure prediction on the Web: a case study using the PHYRE server. Nat. Protoc. 2009;4:363–371. doi: 10.1038/nprot.2009.2. [DOI] [PubMed] [Google Scholar]
- 8.Camacho C., Coulouris G., Madden T.L. BLAST+: architecture and applications. BMC Bioinformatics. 2009;10:421. doi: 10.1186/1471-2105-10-421. [DOI] [PMC free article] [PubMed] [Google Scholar]
- 9.Pettersen E.F., Goddard T.D., Ferrin T.E. UCSF CHIMERA—a visualization system for exploratory research and analysis. J. Comput. Chem. 2004;25:1605–1612. doi: 10.1002/jcc.20084. [DOI] [PubMed] [Google Scholar]
- 10.Xu D., Jaroszewski L., Godzik A. AIDA: ab initio domain assembly server. Nucleic Acids Res. 2014;42:W308–W313. doi: 10.1093/nar/gku369. [DOI] [PMC free article] [PubMed] [Google Scholar]
- 11.Schwarzbauer J.E., DeSimone D.W. Fibronectins, their fibrillogenesis, and in vivo functions. Cold Spring Harb. Perspect. Biol. 2011;3:3. doi: 10.1101/cshperspect.a005041. [DOI] [PMC free article] [PubMed] [Google Scholar]
- 12.Sundquist W.I., Krausslich H.G. HIV-1 assembly, budding, and maturation. Cold Spring Harb. Perspect. Med. 2012;2:a006924. doi: 10.1101/cshperspect.a006924. [DOI] [PMC free article] [PubMed] [Google Scholar]
- 13.Bharat T.A., Davey N.E., Briggs J.A. Structure of the immature retroviral capsid at 8 Å resolution by cryo-electron microscopy. Nature. 2012;487:385–389. doi: 10.1038/nature11169. [DOI] [PubMed] [Google Scholar]
- 14.Johnson G.T., Goodsell D.S., Olson A.J. 3D molecular models of whole HIV-1 virions generated with CELLPACK. Faraday Discuss. 2014;169:23–44. doi: 10.1039/c4fd00017j. [DOI] [PMC free article] [PubMed] [Google Scholar]
- 15.UniProt Consortium Activities at the Universal Protein Resource (UniProt) Nucleic Acids Res. 2014;42:D191–D198. doi: 10.1093/nar/gkt1140. [DOI] [PMC free article] [PubMed] [Google Scholar]
- 16.Huang C.C., Meng E.C., Ferrin T.E. Enhancing UCSF CHIMERA through web services. Nucleic Acids Res. 2014;42:W478–W484. doi: 10.1093/nar/gku377. [DOI] [PMC free article] [PubMed] [Google Scholar]
- 17.Berman P., Zhang Z., Miller W. Winnowing sequences from a database search. J. Comput. Biol. 2000;7:293–302. doi: 10.1089/10665270050081531. [DOI] [PubMed] [Google Scholar]
- 18.Harpaz Y., Gerstein M., Chothia C. Volume changes on protein folding. Structure. 1994;2:641–649. doi: 10.1016/s0969-2126(00)00065-4. [DOI] [PubMed] [Google Scholar]
- 19.Meng E.C., Pettersen E.F., Ferrin T.E. Tools for integrated sequence-structure analysis with UCSF CHIMERA. BMC Bioinformatics. 2006;7:339. doi: 10.1186/1471-2105-7-339. [DOI] [PMC free article] [PubMed] [Google Scholar]
- 20.Eswar N., Eramian D., Sali A. Protein structure modeling with MODELLER. Methods Mol. Biol. 2008;426:145–159. doi: 10.1007/978-1-60327-058-8_8. [DOI] [PubMed] [Google Scholar]
- 21.Larsson P., Wallner B., Elofsson A. Using multiple templates to improve quality of homology models in automated homology modeling. Protein Sci. 2008;17:990–1002. doi: 10.1110/ps.073344908. [DOI] [PMC free article] [PubMed] [Google Scholar]
- 22.Ward A.B., Sali A., Wilson I.A. Biochemistry. Integrative structural biology. Science. 2013;339:913–915. doi: 10.1126/science.1228565. [DOI] [PMC free article] [PubMed] [Google Scholar]
- 23.Yang Z., Lasker K., Ferrin T.E. UCSF CHIMERA, MODELER, and IMP: an integrated modeling system. J. Struct. Biol. 2012;179:269–278. doi: 10.1016/j.jsb.2011.09.006. [DOI] [PMC free article] [PubMed] [Google Scholar]
- 24.Shen M.Y., Sali A. Statistical potential for assessment and prediction of protein structures. Protein Sci. 2006;15:2507–2524. doi: 10.1110/ps.062416606. [DOI] [PMC free article] [PubMed] [Google Scholar]
- 25.Klotzsch E., Schoen I., Vogel V. Conformational distribution of surface-adsorbed fibronectin molecules explored by single molecule localization microscopy. Biomat. Sci. 2014;2:883. doi: 10.1039/c3bm60262a. [DOI] [PubMed] [Google Scholar]
- 26.Bharat T.A., Castillo Menendez L.R., Briggs J.A. Cryo-electron microscopy of tubular arrays of HIV-1 Gag resolves structures essential for immature virus assembly. Proc. Natl. Acad. Sci. USA. 2014;111:8233–8238. doi: 10.1073/pnas.1401455111. [DOI] [PMC free article] [PubMed] [Google Scholar]
- 27.Johnson G.T., Autin L., Olson A.J. CELLPACK: a virtual mesoscope to model and visualize structural systems biology. Nat. Methods. 2015;12:85–91. doi: 10.1038/nmeth.3204. [DOI] [PMC free article] [PubMed] [Google Scholar]
- 28.Johnson G.T. AMI Newsletter. AMI; Lexington, KY: 2013. Announcing the Winners of the autoPACK Visualization Challenge 2012: Present HIV in Blood Plasma. [Google Scholar]
- 29.Johnson G.T., Hertig S. A guide to the visual analysis and communication of biomolecular structural data. Nat. Rev. Mol. Cell Biol. 2014;15:690–698. doi: 10.1038/nrm3874. [DOI] [PubMed] [Google Scholar]
- 30.Remmert M., Biegert A., Söding J. HHBLITS: lightning-fast iterative protein sequence searching by HMM-HMM alignment. Nat. Methods. 2012;9:173–175. doi: 10.1038/nmeth.1818. [DOI] [PubMed] [Google Scholar]
- 31.Tompa P. On the supertertiary structure of proteins. Nat. Chem. Biol. 2012;8:597–600. doi: 10.1038/nchembio.1009. [DOI] [PubMed] [Google Scholar]
- 32.Baaden M., Marrink S.J. Coarse-grain modeling of protein-protein interactions. Curr. Opin. Struct. Biol. 2013;23:878–886. doi: 10.1016/j.sbi.2013.09.004. [DOI] [PubMed] [Google Scholar]
- 33.Wollacott A.M., Zanghellini A., Baker D. Prediction of structures of multidomain proteins from structures of the individual domains. Protein Sci. 2007;16:165–175. doi: 10.1110/ps.062270707. [DOI] [PMC free article] [PubMed] [Google Scholar]
- 34.Cheng T.M., Blundell T.L., Fernandez-Recio J. Structural assembly of two-domain proteins by rigid-body docking. BMC Bioinformatics. 2008;9:441. doi: 10.1186/1471-2105-9-441. [DOI] [PMC free article] [PubMed] [Google Scholar]
- 35.Karaca E., Bonvin A.M. A multidomain flexible docking approach to deal with large conformational changes in the modeling of biomolecular complexes. Structure. 2011;19:555–565. doi: 10.1016/j.str.2011.01.014. [DOI] [PubMed] [Google Scholar]
- 36.Engel J., Odermatt E., Timpl R. Shapes, domain organizations and flexibility of laminin and fibronectin, two multifunctional proteins of the extracellular matrix. J. Mol. Biol. 1981;150:97–120. doi: 10.1016/0022-2836(81)90326-0. [DOI] [PubMed] [Google Scholar]
- 37.Nelea V., Kaartinen M.T. Periodic beaded-filament assembly of fibronectin on negatively charged surface. J. Struct. Biol. 2010;170:50–59. doi: 10.1016/j.jsb.2010.01.009. [DOI] [PubMed] [Google Scholar]
Associated Data
This section collects any data citations, data availability statements, or supplementary materials included in this article.