. 2015 May 7;4:e06474. doi: 10.7554/eLife.06474

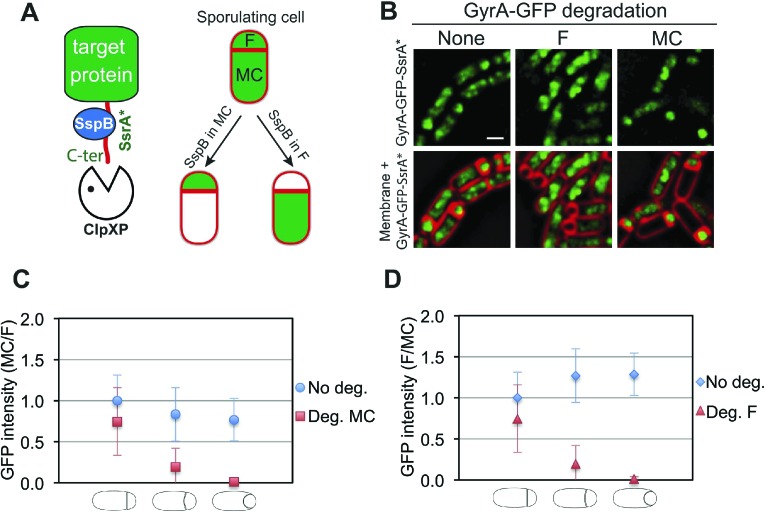
Figure 2. Cell-specific degradation of proteins during sporulation.

(A) Cell-specific protein degradation system (see text). Red indicates the cell membranes, green the target protein. F = forespore, MC = mother cell. (B) Fluorescence microscopy of GyrA-GFP-SsrA* (green) during sporulation, without degradation (strain JLG917), forespore degradation (F, JLG919) and mother cell degradation (MC, JLG1281). Membranes are stained with FM4-64 (red). Scale bar, 1 μm. (C and D) Quantification of the loss of GyrA-GFP-SsrA* fluorescence after degradation in the (C) mother cell and (D) forespore. No degradation controls express GyrA-GFP-SsrA* but not sspBEc (blue circles and diamonds). The ratio of the mean GFP intensity in the (C) mother cell/forespore (red squares) and (D) forespore/mother cell (red triangles) were calculated for sporangia with flat, slightly curved and engulfing septa 2.5 hr after the initiation of sporulation (t2.5). 25–66 sporangia were analyzed for each cell type.

DOI: http://dx.doi.org/10.7554/eLife.06474.004

Figure 2.

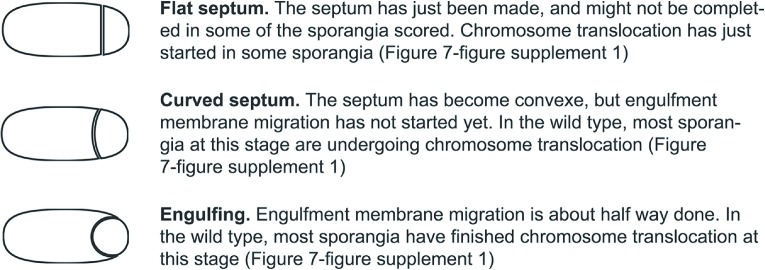
Figure 2—figure supplement 1. Description of the different stages of engulfment analyzed in this study.

Figure 2—figure supplement 1.

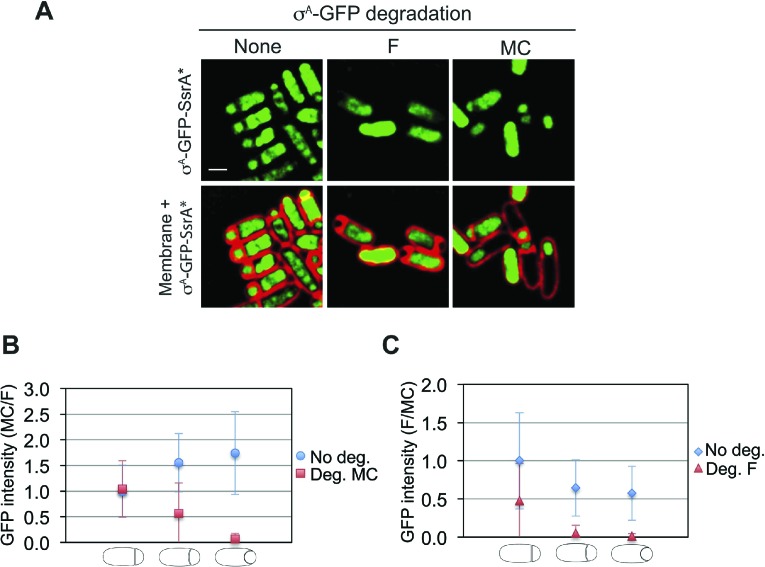
Figure 2—figure supplement 2. Cell-specific degradation of σA-GFP-SsrA*.

Figure 2—figure supplement 2.

(A) Cell-specific degradation of a σA-GFP-SsrA* fusion protein during sporulation. When sspBEc is not expressed (strain JLG247), GFP signal is detected in both forespore and mother cell. Expressison of sspBEc in the forepore (strain JLG261) leads to GFP disappearance in the forespore, while expression of sspBEc in the mother cell (strain JLG259) leads to GFP disappearance in the mother cell. Sporangia were harvested 2.5 h after resuspension (t2.5) and images of σA-GFP-SsrA* (green) and membrane (red) were taken. Membrane was stained with FM4-64 (red). Scale bar is 1 μm. (B and C) Quantification of the loss of σA-GFP-SsrA* fluorescence after degradation in the (B) mother cell and (C) forespore. No degradation controls express σA-GFP-SsrA* but not sspBEc (blue circles and diamonds). The ratio of the mean GFP intensity in the (B) mother cell/forespore (red squares) and (C) forespore/mother cell (red triangles) cell were calculated for sporangia with flat, slightly curved and engulfing at t2.5. 20–46 sporangia were analyzed for each cell type.