Abstract
The role of autophagy in carcinogenesis is controversial and apparently complex. By using mice with hepatocyte-specific knockout of Atg5, a gene essential for autophagy, we longitudinally studied the role of autophagy in hepatocarcinogenesis. We found that impairing autophagy in hepatocytes would induce oxidative stress and DNA damage, followed by the initiation of hepatocarcinogenesis, which could be suppressed by the antioxidant N-acetylcysteine. Interestingly, these mice developed only benign tumors with no hepatocellular carcinoma (HCC), even after the treatment with diethylnitrosamine, which induced HCC in wild-type mice. The inability of mice to develop HCC when autophagy was impaired was associated with the induction of multiple tumor suppressors including p53. Further analysis indicated that the induction of p53 was associated with the DNA-damage response. Tumorigenesis studies using an established liver tumor cell line confirmed a positive role of autophagy in tumorigenesis and a negative role of p53 in this process when autophagy was impaired. Our studies thus demonstrate that autophagy is required to maintain healthy mitochondria and to reduce oxidative stress and DNA damage to prevent the initiation of hepatocarcinogenesis. However, once hepatocarcinogenesis has been initiated, its presence is also required to suppress the expression of tumor suppressors to promote the development of HCC.
Autophagy (i.e., macroautophagy) is important for cells to remove protein aggregates and damaged organelles. Its dysfunction can cause a variety of diseases including cancers.1, 2 However, its role in carcinogenesis is apparently complex, as it has been shown in different reports to positively or negatively regulate carcinogenesis.3, 4 Autophagy apparently can function as a tumor suppressor, as the gene encoding Beclin-1, a component of the phosphatidylinositol-3-kinase class III (PI3KC3) complex that is essential for the initiation of autophagy, is often monoallelically deleted or mutated in breast, ovarian and prostate cancers.5 Frameshift mutations in Atg2B, Atg5, Atg9B and Atg12 autophagy genes are also often found in gastric and colorectal cancers with microsatellite instability.6 The tumor suppressor role of autophagy is further supported by the studies using mouse models. It has been shown that the monoallelic deletion of the Beclin-1 gene in mice induced tumor lesions in various tissues,7 Atg4C-knockout (KO) mice had increased susceptibility to carcinogens for the development of fibrosarcomas8 and the systemic mosaic KO of Atg5 and the liver-specific KO of Atg7 in mice led to the development of benign liver adenomas.9, 10
Autophagy has also been shown to promote tumor growth. It has been shown that autophagy can enhance the survival of tumor cells in the hypoxic regions of solid tumors.11 It has also been shown that in cells expressing oncogenic Ras, autophagy is required to promote tumorigenesis by maintaining oxidative metabolism or facilitating glycolysis.12, 13 Moreover, it has also been demonstrated that the suppression of autophagy by the expression of FIP200, a component of the ULK1-Atg13-FIP200-Atg101 complex that is essential for the induction of autophagy, could suppress mammary tumorigenesis induced by the polyomavirus middle T antigen in mice.14 These observations indicated a protumorigenic role of autophagy.
In this report, we used mice with liver-specific KO of Atg5 (L-Atg5-KO) to study the role of autophagy in carcinogenesis. We found that abolishing the expression of Atg5 impaired autophagy in the liver and led to oxidative DNA damage and the development of benign hepatic tumors with no visible carcinoma. This inability to develop hepatocellular carcinoma (HCC) was correlated with the induction of tumor suppressors, which negatively regulate the progression of tumorigenesis when autophagy was impaired.
Results
Induction of hepatocarcinogenesis by L-Atg5-KO
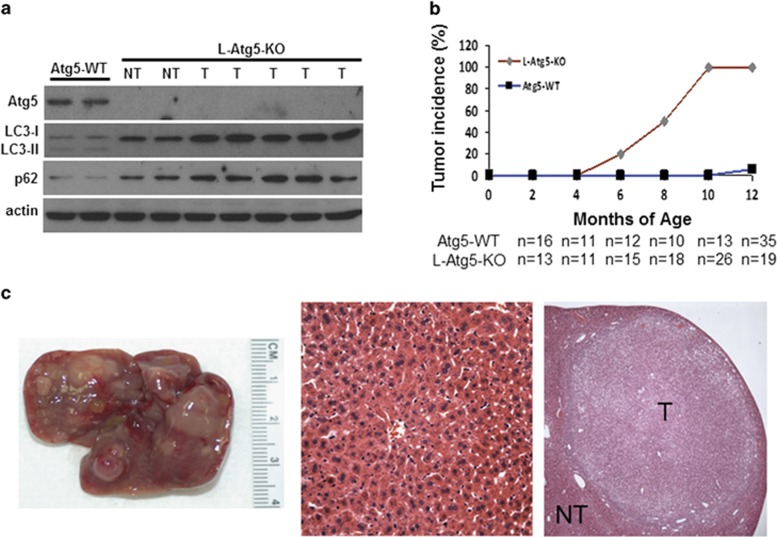
To investigate the possible effect of autophagy on hepatocarcinogenesis, we produced C57BL/6 mice with L-Atg5-KO, a gene essential for autophagy. As shown in Figure 1a, little Atg5 was detected in the liver of L-Atg5-KO mice, indicating an efficient KO of this gene. In contrast, this loss of Atg5 was not observed in the spleen or kidney (Supplementary Figure 1a). The deletion of the Atg5 gene inhibited the lipidation of LC3 and increased the non-lipidated LC3 protein level in the liver. An increase of the p62 protein level was also detected. As the lipidation of LC3 is essential for the formation of autophagosomes and p62 is a protein removed by autophagy,15 these results confirmed that the L-Atg5-KO impaired autophagy in the mouse liver. The L-Atg5-KO mice developed hepatomegaly and their liver weight was increased ~2-, 3- and 4-fold at 2, 4 and 6 months of age, respectively (Supplementary Figure 1b). Histological analysis of liver tissue sections of 4-month old mice revealed the enlargement of hepatocytes (Supplementary Figure 1c). The L-Atg5-KO mice as well as their control littermates were killed at different time points after birth. Liver tumors were visible in ~20% and 50% of L-Atg5-KO mice at 6 and 8 months of age, respectively (Figure 1b). All of the L-Atg5-KO mice developed liver tumors by 10 months of age. The tumors were usually multifocal, and histological analysis indicated that they were either focal nodular hyperplasia or adenomas (Figure 1c). In contrast to L-Atg5-KO mice, virtually no control mice developed tumor nodules by 12 months of age (Figure 1b). No tumors were detected in other organs examined in either L-Atg5-KO mice or control mice (Supplementary Figure 1d). The immunoblot analysis of liver tumors of L-Atg5-KO mice confirmed a similar lack of expression of Atg5 and the lipidation of LC3, and a further increase of the p62 level (Figure 1a).
Figure 1.
Development of hepatic tumors in L-Atg5-KO mice. (a) Immunoblot analysis of Atg5, LC3 and p62 in the liver of 4-month old Atg5-WT and L-Atg5-KO mice and in the liver tumors of 10-month old L-Atg5-KO mice. Actin served as the loading control. Two or more tissue samples were analyzed to ensure the reproducibility of the results. (b) Liver tumor incidence in Atg5-WT and L-Atg5-KO mice; ‘n' indicates the number of mice analyzed. The increase of tumor incidence starting from 6 months of age was statistically significant (P<0.01). (c) Left panel, a typical liver of L-Atg5-KO mice at 10 months of age; right panel, H&E staining of a representative hepatic adenoma isolated from a 10-month-old mouse; and middle panel, H&E staining of the liver tissue of an age-matched control mouse. LC3-I, non-lipidated LC3; LC3-II, lipidated LC3; NT, non-tumor tissue; T, tumor tissue
Increased oxidative stress and DNA damage in the liver of L-Atg5-KO mice
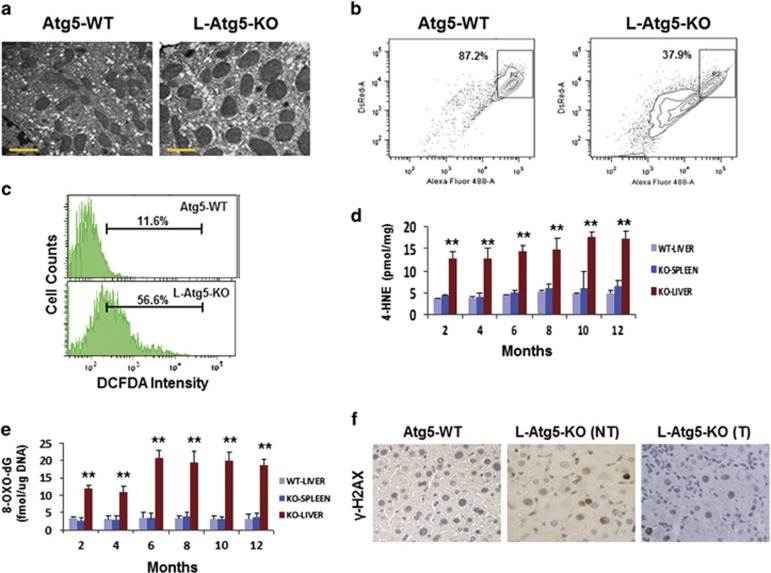
To understand the mechanism of hepatocarcinogenesis in L-Atg5-KO mice, we performed electron microscopy on liver tissue sections. As shown in Figure 2a and Supplementary Figure 2a, mitochondria in the hepatocytes of L-Atg5-KO mice increased in volume with no inapparent cristae, suggesting a possible alteration of physiology. This possibility was confirmed by the mitochondrial membrane potential assay, which indicated that a large fraction of mitochondria in the L-Atg5-KO mouse liver had reduced membrane potentials (Figure 2b). To further determine whether this abnormality of mitochondria would lead to an increase of oxidative stress, we isolated mouse hepatocytes by liver perfusion and measured the level of reactive oxygen species (ROS). As shown in Figure 2c, a significant increase of ROS was observed in a large number of hepatocytes. As ROS can cause lipid peroxidation to produce 4-hydroxynonenal (4-HNE) and malondialdehyde (MDA),16 we also analyzed the levels of 4-HNE and MDA in the liver of L-Atg5-KO mice. The liver of control mice and the spleen of L-Atg5-KO mice were also analyzed to serve as the controls. As shown in Figure 2d, there was a significant increase of the 4-HNE level in the liver of L-Atg5-KO mice at every time point analyzed, compared with the liver of control mice. No significant increase of 4-HNE was observed in the spleen of L-Atg5-KO mice. The same results were observed for MDA (Supplementary Figure 2b). These results indicated a specific increase of oxidative stress in the liver of L-Atg5-KO mice.
Figure 2.
Induction of oxidative DNA damage in the liver of L-Atg5-KO mice. (a) Electron microscopy of mitochondria in the hepatocytes of 4-month-old wild-type (WT) and L-Atg5-KO mice. Scale bar, 1 μm. (b) FACS analysis of mitochondrial membrane potential. The horizontal axis measured the green JC1 fluorescence and the vertical axis measured the red JC1 fluorescence. Boxed areas indicated mitochondria with high membrane potentials. See Materials and methods for details. (c) FACS analysis of ROS in mouse hepatocytes after staining with DCFDA, a fluorogenic dye that measures ROS in cells. (d) Analysis of 4-HNE in the liver of WT and L-Atg5-KO mice and the spleen of L-Atg5-KO mice at different age. (e) Analysis of 8-OXO-dG levels. In (d) and (e), five mice were analyzed for every time point and the results represented the mean. **P<0.01 when the liver of L-Atg5-KO mice were compared with their spleen or with the liver of the WT mice. (f) Immunostaining of γ-H2AX (brown-color staining) in the normal liver tissue sections of 4-month-old mice. The liver tumor tissue section of a 6-month-old L-Atg5-KO mouse was also analyzed. NT, non-tumor tissue; T, tumor tissue
As the increase of oxidative stress may lead to oxidative DNA damage, we also measured the level of 8-hydroxy-2′-deoxyguanosine (8-OXO-dG), a marker of oxidative DNA damage,17 in the liver of L-Atg5-KO mice. Indeed, as shown in Figure 2e, the 8-OXO-dG level was significantly higher in the liver of L-Atg5-KO mice than in the spleen of these mice or the liver of control mice at 2 and 4 months of age. This level was further increased in the liver of L-Atg5-KO mice at 6 months of age and remained at that level thereafter. The increase in DNA damage was also confirmed by immunohistochemical staining of γ-H2AX, a marker of DNA damage. As shown in Figure 2f and Supplementary Figure 2c, there were few γ-H2AX-positive cells in the liver tissue section of the wild-type mice. In contrast, ~20% of cells in non-tumor and tumor tissue sections of L-Atg5-KO mice were positive for γ-H2AX, confirming the induction of DNA damage in those cells.
Inhibition of hepatocarcinogenesis in L-Atg5-KO mice by N-acetylcysteine
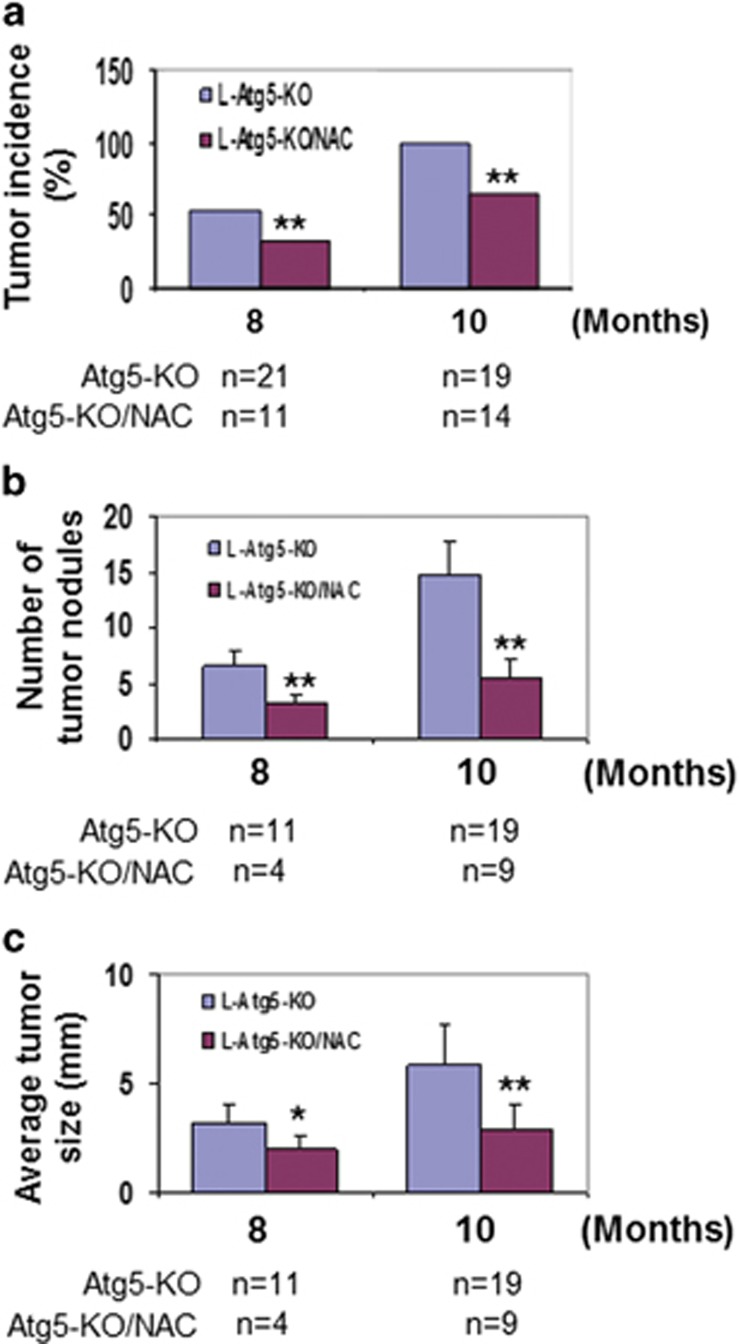
The results shown in Figure 2 suggested a possible role of oxidative stress and DNA damage in the induction of hepatocarcinogenesis in L-Atg5-KO mice. To test this possibility, we fed L-Atg5-KO mice with N-acetylcysteine (NAC), an antioxidant, on a daily basis starting from 2 months of age. This treatment reduced the levels of 4-HNE, MDA and 8-OXO-dG in the liver when mice were analyzed at 8 and 10 months of age (Supplementary Figure 3a). As shown in Figure 3a, it also reduced the percentage of mice that developed liver tumors from ~50 to 33% at 8 months of age and from 100 to 67% at 10 months of age. The number and the size of tumor nodules in tumor-positive mice were also reduced by NAC (Figures 3b and c). NAC had no effect on autophagy in the liver tumors of these mice (Supplementary Figure 3b). The reduction of liver tumor incidence by NAC confirmed a causative role of oxidative stress in the induction of hepatocarcinogenesis in L-Atg5-KO mice.
Figure 3.
Reduction of liver tumor incidence of L-Atg5-KO mice by NAC. Comparison of the liver tumor incidence (a), tumor number (b) and tumor size (c) in L-Atg5-KO mice without and with treatment of NAC; ‘n' indicates the number of mice analyzed. *P<0.05; **P<0.01. In (a), the data were analyzed by χ2, and in (b) and (c), they were analyzed by the Student's t-test
Inability of diethylnitrosamine to induce HCC in L-Atg5-KO mice
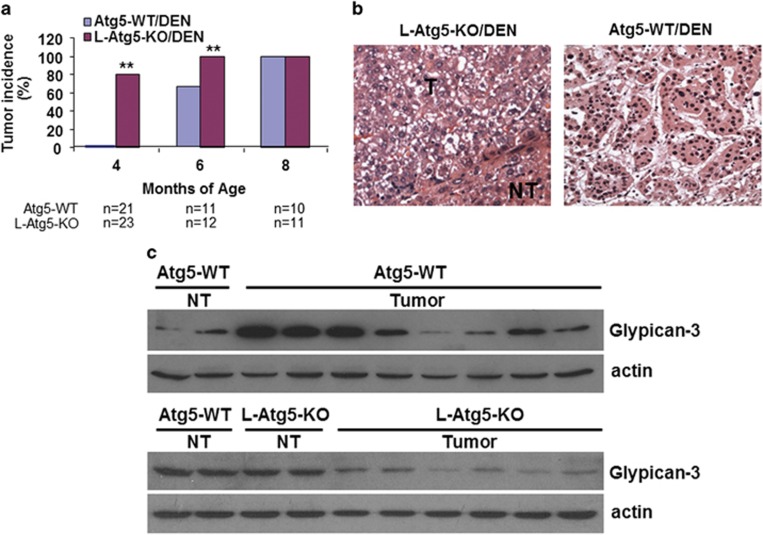
As mentioned above, L-Atg5-KO mice developed only hepatic hyperplasia and adenomas with no HCC. To understand why these mice did not develop HCC, we injected L-Atg5-KO mice and control mice with multiple doses of the carcinogen DEN (diethylnitrosamine), a known inducer of HCC. The analysis of liver tumors by ultrasound at 4 months of age revealed no detectable tumors in control mice. However, 80% of L-Atg5-KO mice developed visible liver tumor nodules (Figure 4a; also see Supplementary Figure 4a for a representative sonogram). When L-Atg5-KO mice and control mice were randomly selected and killed at 6 months of age, nearly 70% of control mice and all of the L-Atg5-KO mice were found to have developed liver tumors. All of the mice including control mice analyzed at 8 months of age had liver tumors (Figure 4a). The histological analysis of liver tumor nodules revealed only benign focal hyperplasia and adenomas in L-Atg5-KO mice, whereas all of the tumor-positive control mice contained both adenomas and HCC as early as at 6 months of age (Figure 4b). There was no apparent difference in autophagy between tumor and non-tumor liver tissues of control mice based on immunoblot analysis of LC3 and p62 (Supplementary Figure 4b). The inability of L-Atg5-KO mice to develop HCC was further confirmed by immunoblot analysis of glypican-3, a heparan sulfate proteoglycan that is associated with HCC.18 As shown in Figure 4c, the expression levels of glypican-3 varied greatly in different liver tumors isolated from control mice, indicative of a mixture of benign tumors and HCC. In contrast, the expression levels of glypican-3 were reduced in all of the liver tumors isolated from L-Atg5-KO mice, in agreement with the lack of HCC in these mice.
Figure 4.
Effect of Atg5 KO on hepatocarcinogenesis in mice treated with DEN. Wild-type and L-Atg5-KO mice were injected with DEN (5 mg/kg body weight) at 16, 23, 30 and 37 days of age. (a) Liver tumor incidence at 4, 6 and 8 months of age. **P<0.01. (b) H&E staining of a typical adenoma from 6-month-old L-Atg5-KO mice (left panel) and HCC from wild-type mice (right panel). The adenomas were well-circumscribed and consisted of sheets of hepatocytes with a bubbly vacuolated cytoplasm. The HCC of wild-type mice displayed a macrotrabecular pattern with clear-cell morphology and nuclear irregularity. (c) Immunoblot analysis of glypican-3. (Upper two panels) Eight liver tumor nodules were randomly selected from four wild-type mice for immunoblot analysis of glypican-3 and actin. Non-tumor tissues from two different wild-type mice were used as the controls. (Lower two panels) One liver tumor tissue was randomly selected from each of six L-Atg5-KO mice for immunoblot analysis. The non-tumor tissues of two wild-type mice and two L-Atg5-KO mice were also analyzed to serve as the controls
Induction of tumor suppressors by L-Atg5-KO
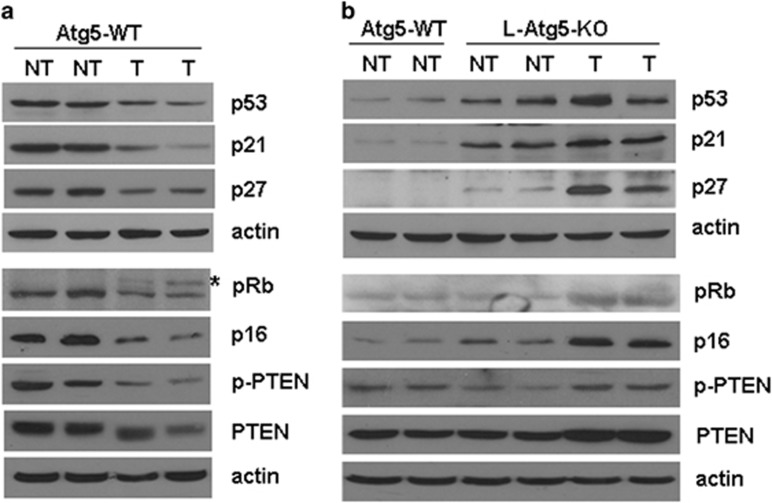
To understand why L-Atg5-KO mice failed to develop HCC even after the DEN treatment, we isolated tumor and non-tumor liver tissues from wild-type and L-Atg5-KO mice and analyzed the cell proliferation rate by staining the tissue sections for Ki67, a cellular proliferation marker.19 Our results revealed that the tumor tissues of L-Atg5-KO mice had a lower number of Ki67-positive cells than those of the wild-type mice (Supplementary Figure 5a). When the tissue sections were analyzed for apoptotic cells by the TUNEL assay, the liver tissues, in particular the tumor tissues, from L-Atg5-KO mice had a higher apoptotic rate (Supplementary Figure 5b). To further understand the mechanism of these differences between the tumors of L-Atg5-KO mice and wild-type mice, we examined the expression of a panel of tumor suppressors, which included p53, p21waf1, p27kip, pRb, p16 and PTEN. As shown in Figure 5a, the tumor tissues isolated from wild-type mice that had been treated with DEN had reduced expression levels of p53, p21waf1, p27kip and p16. In addition, it also had a reduced level of pRb with a visible increase of hyperphosphorylated (i.e., inactivated) pRb, and a reduced level of phosphorylated (i.e., activated) PTEN.20 These results were as expected, as these tumor suppressors negatively regulate cellular proliferation. Interestingly, the L-Atg5-KO increased p53, p21waf1 and p27kip protein levels in both non-tumor and tumor liver tissues, with a more prominent effect in the latter for p27kip (Figure 5b). It also increased the levels of pRb, p16, phospho-PTEN and PTEN in the liver tumor tissues. This induction of tumor suppressors likely had an important role in preventing the development of HCC in L-Atg5-KO mice, as their induction would be expected to impede cellular proliferation. The treatment of mice with NAC did not affect the expression of these tumor suppressors in the tumor tissues of L-Atg5-KO mice (Supplementary Figure 6a), indicating that NAC could reduce the tumor incidence but it had no effect on the expression of tumor suppressors in the tumors that had developed.
Figure 5.
Immunoblot analysis of tumor suppressors in the liver of wild-type (WT) and L-Atg5-KO mice. Immunoblot was conducted to analyze the expression of various tumor suppressors in non-tumor (NT) and tumor (T) liver tissues of WT (a) and L-Atg5-KO mice (b) that had been treated with DEN. In (b), the non-tumor liver tissues of WT mice were used as the control. Two mice were used for all of the studies to ensure the reproducibility of the results. The asterisk denotes the hyperphosphorylated Rb
Mechanisms of p53 induction in the liver of L-Atg5-KO mice
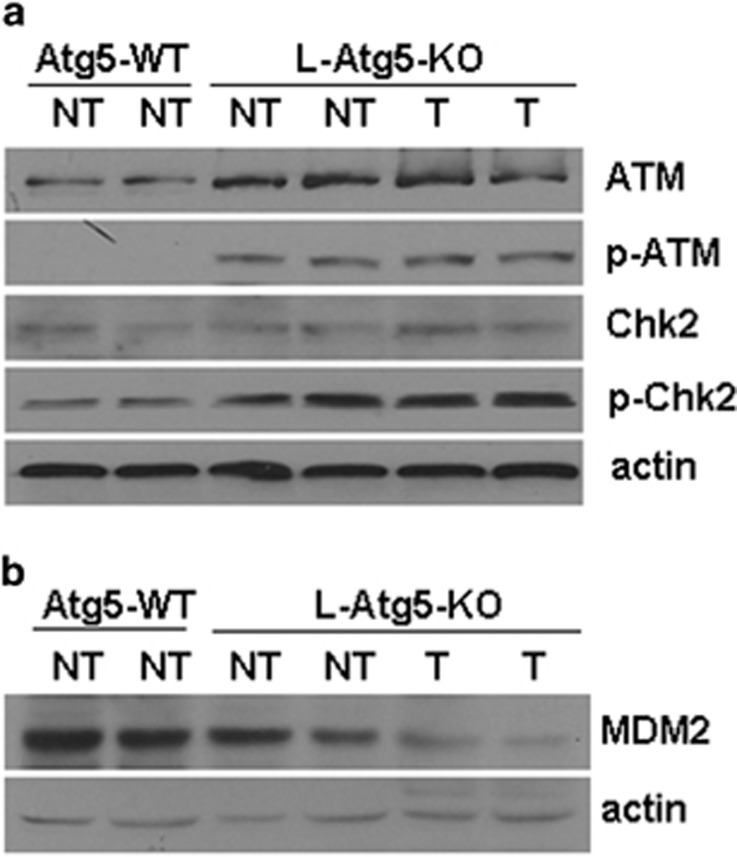
To understand how tumor suppressors were induced in L-Atg5-KO mice, we chose to focus on p53, as p53 is the upstream regulator of p21waf1 and may also indirectly regulate the expression of pRb and PTEN.21 We first analyzed the p53 mRNA level by real-time RT-PCR. Our results revealed no difference of the p53 mRNA levels between wild-type and L-Atg5-KO mice (P>0.05) (Supplementary Figure 6b), indicating a possible posttranslational regulation. DNA damage can activate ataxia telangiectasia mutated (ATM), a serine/threonine kinase, which can phosphorylate Chk2 and destabilize MDM2, an E3 ubiquitin ligase that negatively regulates the p53 stability.22 To determine whether the induction of p53 in the L-Atg5-KO mouse liver was due to the ATM signaling pathway activated by DNA damage, we analyzed the expression of ATM, Chk2 and MDM2 in the liver tissues of L-Atg5-KO mice. As shown in Figure 6a, there was an apparent increase of total ATM and phosphorylated ATM in both non-tumor and tumor liver tissues of L-Atg5-KO mice. Similarly, although there was no significant difference of the total Chk2 level in the liver of wild-type and L-Atg5-KO mice, the increase of the phosphorylated Chk2 level in both non-tumor and tumor tissues of L-Atg5-KO mice was apparent. In contrast, when the MDM2 protein was analyzed, its level was found to be slightly reduced in the non-tumor liver tissues and almost undetectable in the tumor tissues of the L-Atg5-KO mice (Figure 6b). There was no apparent alteration of its mRNA level (Supplementary Figure 6c), indicating a posttranslational regulation. These results confirmed the activation of the ATM-Chk2 pathway when autophagy was impaired and provided an explanation as to why the expression levels of p53 were increased in the liver of L-Atg5-KO mice.
Figure 6.
Analysis of the mechanisms of p53 inductions by Atg5 KO. Immunoblot analyses of: (a) ATM and Chk2 and their phosphorylated forms; and (b) MDM2 in the liver of wild-type (WT) and L-Atg5-KO mice
Autophagy-dependent effect of p53 on tumorigenesis of HepG2 cells
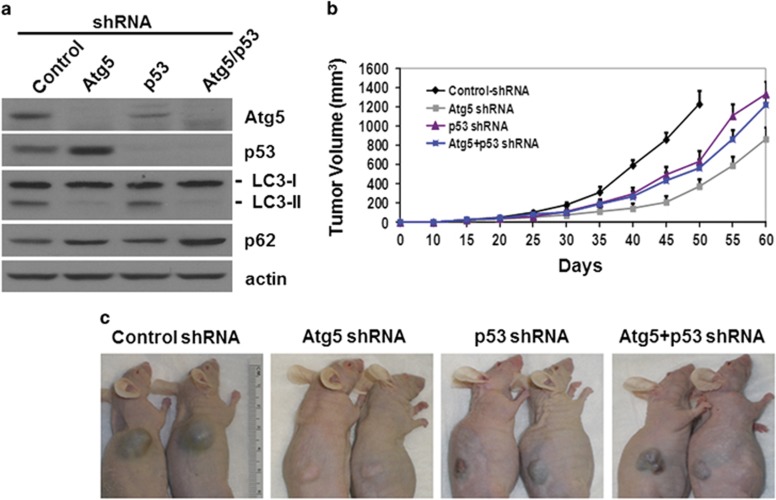
To understand the possible role of tumor suppressors in hepatocarcinogenesis when autophagy is impaired, we analyzed p53. We transduced HepG2 cells, a human hepatoblastoma cell line that expressed the wild-type p53,23 with lentiviral vectors that expressed a nonspecific short hairpin RNA (shRNA), the Atg5 shRNA, the p53 shRNA or both Atg5 and p53 shRNAs. The transduced cells were then selected with puromycin. As shown in Figure 7a, Atg5 and p53 shRNAs reduced the expression of their respective proteins to an almost undetectable level. In agreement with the results shown in Figure 5b, the suppression of Atg5 expression led to a slight increase of the p53 protein level. In contrast, the suppression of p53 expression resulted in the reduction of the Atg5 protein level. These results indicated an interesting interplay between Atg5 and p53 on the expression of each other. The Atg5 knockdown, whether it was by itself or together with p53 knockdown, reduced the lipidated LC3 protein level and increased the p62 protein level, indicating the suppression of autophagy. The increase of the p62 level was more prominent with the double knockdown, suggesting a stronger inhibition of autophagy. In contrast to Atg5 knockdown, p53 knockdown by itself had no apparent effect on LC3 lipidation or p62, even though it reduced the expression level of Atg5. This might be because the reduced level of Atg5 was still sufficient to maintain the basal level of autophagy. To test the effect of autophagy and p53 on the tumorigenesis of HepG2 cells, we subcutaneously injected the cells into nude mice. As shown in Figure 7b, compared with the control, Atg5 knockdown significantly inhibited HepG2 tumor growth in nude mice, indicating the need of autophagy to promote tumorigenesis. When the expression of p53 was also knocked down, the tumor growth was partially restored. These results indicated that the inhibition of tumor growth due to the loss of autophagy could be partially reversed if the expression of p53 was suppressed. P53 knockdown by itself also reduced the tumor growth of HepG2 cells to a level similar to that of the cells with p53 and Atg5 double knockdown. The analysis of the expression of Atg5, p53, LC3 and p62 in various HepG2 cell lines recovered from the tumors revealed no effect of the tumor growth on their expression (Supplementary Figure 7a). Similar to the results shown in Figure 6b, Atg5 knockdown reduced the expression of MDM2, which was not affected by p53 knockdown (Supplementary Figure 7a).
Figure 7.
Effects of Atg5 and p53 on tumorigenesis of HepG2 cells in nude mice. (a) Immunoblot analysis of Atg5, p53, LC3, p62 and actin in stable HepG2 cells expressing various shRNAs. (b) Nude mice were subcutaneously injected with HepG2 cells that expressed various shRNAs. Tumor volumes were measured at different time points after injection. The difference of tumor sizes between control HepG2 cells and HepG2 cells with Atg5 knockdown was statistically significant starting from 30 days (P<0.05 on day 30 and P<0.01 after day 30). The difference between HepG2 cells with Atg5 or p53 knockdown and HepG2 cells with Atg5 and p53 double knockdown was statistically significant starting from 35 days (P<0.05 on day 35 and P<0.01 after day 35). The tumor growth of control HepG2 cells was terminated 50 days after the injection owing to the large tumor size. (c) Representative mice with tumors of HepG2 cells
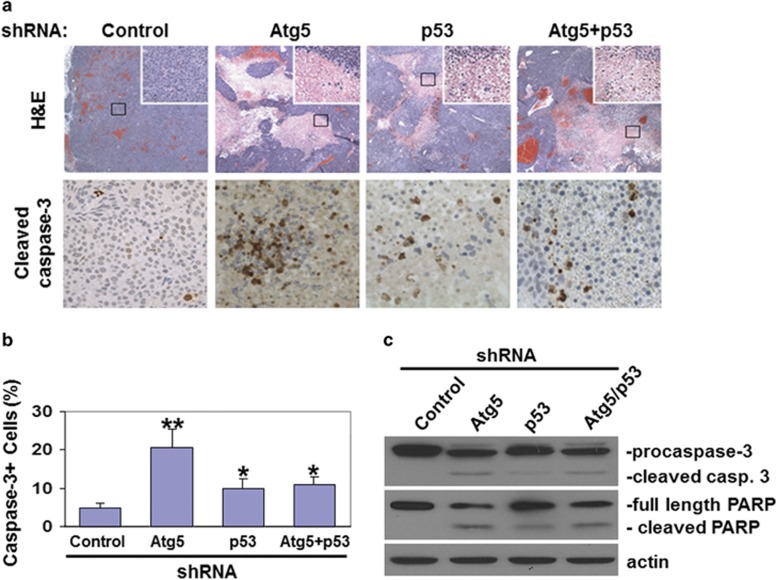
Examples of mice with HepG2 tumors are shown in Figure 7c. To further investigate how the knockdown of Atg5 and p53 affected tumor growth, we conducted histological analysis of the tumor tissues. As shown in the top panels of Figure 8a, in contrast to the tumors of control HepG2 cells, areas of reduced or no hematoxylin and eosin (H&E) staining and patches of destroyed tissues were observed in the tumors of HepG2 cells with Atg5 knockdown, p53 knockdown or both, indicative of necrotic cell deaths. The analysis of cellular apoptosis by immunostaining of activated caspase-3 revealed ~20% of cells undergoing apoptosis in the tumors of HepG2 cells with Atg5 knockdown (Figures 8a and b). The percentages of apoptotic cells in the tumors of HepG2 cells with p53 knockdown or with both Atg5 and p53 knockdown were similar and at about 10%. The induction of apoptosis was also confirmed by immunoblot analysis of procaspase-3 and poly(ADP-ribose) polymerase (PARP), which are cleaved during apoptosis. As shown in Figure 8c, tumors with Atg5 knockdown had cleaved caspase-3 and PARP. The cleaved caspase-3 and PARP were also detected in the tumors with p53 knockdown or p53 and Atg5 double knockdown, although to a lesser degree, in agreement with their intermediate apoptosis rate.
Figure 8.
Induction of cell deaths in HepG2 tumor tissues in nude mice. (a) HepG2 tumor tissue sections were H&E-stained (top panels) or immunostained for cleaved caspase-3 (bottom panels). For H&E staining, areas boxed were enlarged and shown in the upper right corner. (b) Percentage of cells with activated caspase-3 in HepG2 tumor tissues. The results represent the mean of 20 different viewing fields. *P<0.05; **P<0.01. (c) Immunoblot analysis of caspase-3 and PARP in HepG2 tumor tissues
The above results confirmed the role of autophagy in promoting tumorigenesis. It also demonstrated that the inefficient progression of tumorigenesis when autophagy was impaired was at least partially due to apoptotic and necrotic cell deaths, which could be partially rescued by suppressing the expression of p53. The inability of p53 knockdown to fully restore the tumor growth might be due to the expression of other tumor suppressors such as p27kip, which remained high in the tumors of HepG2 cells with double knockdown of Atg5 and p53 (Supplementary Figure 7b).
As our results shown in Figure 6a suggested a possible role of the ATM-Chk2 pathway in the induction of p53 when autophagy was impaired, we decided to test this possibility by using HepG2 cells with stable knockdown of Atg5. As shown in Supplementary Figure 8a, the knockdown of ATM with shRNA reduced total Chk2 and phosphorylated Chk2 levels, increased the MDM2 protein level and abolished the induction of p53. The repeat of the same experiments using HepG2 cells recovered from xenografted tumors generated the same results (Supplementary Figure 8b). These results confirmed the role of the ATM-Chk2 pathway in the induction of p53 when the expression of Atg5 was suppressed.
Discussion
In this report, we demonstrated that autophagy had dual effects on hepatocarcinogenesis. It was required to reduce oxidative stress and DNA damage to prevent the initiation of hepatocarcinogenesis. However, once hepatocarcinogenesis had been initiated, it was also required to suppress the expression of tumor suppressors to promote the development of HCC. It does not appear likely that these effects were due to other nonspecific activities of Atg5, as mice with liver-specific KO of Atg7 was also found to develop benign liver tumors in another study,9, 10 and the treatment of rats with chloroquine, which inhibits autophagy,24 enhanced the development of liver tumors induced by DEN in the early dysplastic stage and suppressed tumor progression in the later stage.25
Our finding that the ablation of autophagy induced the expression of multiple tumor suppressors in the liver tumors of L-Atg5-KO mice is interesting (Figure 5b). As we found that the loss of autophagy could activate ATM and Chk2 and suppress the expression of MDM2 (Figures 6a and b), the induction of p53 was likely mediated by the DNA-damage response. By using p53 as an example of tumor suppressors and mice xenografted with HepG2 cells as a model, we confirmed the role of p53 in impeding tumorigenesis when autophagy was impaired (Figure 7). However, in the presence of intact autophagy, the loss of p53 could actually induce cell death and suppress the tumorigenesis of HepG2 cells (Figures 7 and 8). These observations indicated that the effect of p53 on tumorigenesis was dependent on the integrity of autophagy. It will be interesting to test whether the knockout of the p53 gene in L-Atg5-KO mice also enables these mice to eventually develop HCC.
Recently, it was reported that the deletion of the autophagy gene Atg7 could induce the expression of p53 and suppress the progression of oncogenic K-ras-induced lung tumors in mice, and this suppression could be partially relieved if the expression of p53 was abolished.26 In a separate study, it was also demonstrated that the loss of Atg5 or Atg7 could also prevent the development of high-grade pancreatic neoplastic legions induced by K-ras, and the pancreatic tumor growth could be restored if the expression of p53 was also abolished.27 These recent findings together with ours indicate that autophagy is required for tumor progression for at least three different tumor types and that the deletion of p53 can partially restore tumorigenesis when autophagy is impaired.
In conclusion, our results indicate that autophagy has both positive and negative effects on hepatocarcinogenesis, depending on whether it is before or after its onset. This finding will have important implications if treatments that target autophagy are to be used for HCC patients or patients who are at risk for HCC.
Materials and Methods
Production of L-Atg5-KO mice and hepatocarcinogenesis studies
C57BL/6 mice with L-Atg5-KO were produced by crossing mice carrying the floxed Atg5 gene (Atg5f/f) with mice carrying the Alb-cre gene as described before.28 This crossbreeding produced mice with hepatocyte-specific KO of Atg5 (Alb-Cre Atg5f/f; i.e., L-Atg5-KO mice) and their control littermates without the Atg5 KO (Alb-cre Atg5+/f or Atg5f/f). For the treatment with DEN, L-Atg5-KO mice and their control littermates were intraperitoneally injected with DEN (5 mg/kg body weight) on day 16 of age and once a week for 4 weeks thereafter.29 For the treatment with NAC, L-Atg5-KO mice were fed water containing NAC (4 mg/ml) ad libitum on a daily basis starting from 2 months of age. Liver tumor tissue sections were stained with H&E and blindly analyzed by a pathologist who did not know the codes of the tissue samples. Our mouse studies were conducted in accordance with the Guide for the Care and Use of Laboratory Animals of the National Institutes of Health and approved by the Institutional Animal Care and Use Committee of the University of Southern California.
Immunoblotting analysis
Liver tissues were homogenized in the RIPA solution (10 mM Tris-HCl, pH 7.0, 150 mM NaCl, 1% Triton X-100, 1% sodium deoxycholate and 0.1% sodium dodecyl sulfate) and, after a brief centrifugation to remove cell debris, the protein concentrations were determined by Bradford BCA (Bio-Rad, Hercules, CA, USA) and subjected to immunoblot analysis.
Immunohistochemistry
Paraffin-embedded liver tissue sections were stained for γ-H2AX. Briefly, liver tissue sections were treated with 0.01 M sodium citrate in the microwave oven for 10 min for epitope retrieval, and then blocked using the goat serum. Tissue sections were incubated with the primary antibody and the secondary biotinylated affinity-purified goat anti-rabbit IgG, and the staining was then developed using the avidin-conjugated horseradish peroxidase with diaminiobenzidine as the substrate (Ultra-sensitive ABC Peroxidase Staining Kit; Thermo Scientific, Rockford, IL, USA). Staining of Ki67 was performed the same way, with the exception that the alkaline phosphatase-conjugated secondary antibody was used for the staining. The TUNEL assay was performed using the Roche In Situ Cell Death Detection Kit (Mannheim, Germany) following the manufacturer's protocol.
Analysis of ROS in mouse hepatocytes
Hepatocytes of L-Atg5-KO and control mice were purified by sedimenting liver cells through a 29% Percoll cushion after liver perfusion with collagenase IV. The ROS was measured using flow cytometry and 2′,7′-dichlorofluorescein diacetate (DCFDA) Cellular ROS Detection Assay Kit (Abcam, Cambridge, MA, USA) following the manufacturer's instructions. Briefly, 1 × 10⁶ cells were incubated in 500 μl ROS Working Solution at 37 °C in a CO2 incubator for 30 min. Cells were washed with 2 ml 1x Assay Buffer, resuspended in 1 ml 1x Assay Buffer and used immediately for FACS analysis.
Lipid peroxidation and oxidative DNA damage assays
4-HNE, MDA and 8-OXO-dG were measured using their respective ELISA Kit (Cell Biolabs, San Diego, CA, USA). All of these assays were conducted following the manufacturer's instructions. Briefly, mouse livers were homogenized in phosphate-buffered saline (PBS) and, after a brief centrifugation to remove tissue debris, liver homogenates were diluted with PBS to generate a protein concentration of 10 μg/ml. The levels of 4-HNE and MDA in the samples were then measured. For the 8-OXO-dG assay, total liver DNA was isolated by phenol extraction and digested with nuclease P1 followed by treatment with alkaline phosphatase. The level of 8-OXO-dG was then measured using the ELISA Kit. The spleen of L-Atg5-KO mice was also analyzed using the same procedures.
Analysis of mitochondrial membrane potentials
Mouse hepatocytes were isolated by liver perfusion. The mitochondrial membrane potential (ΔΨm) was measured using flow cytometry and the Mitochondrial Membrane Potential Detection Kit (BD Bioscience, San Jose, CA, USA), following the manufacturer's instructions. Briefly, 1 × 10⁶ cells were incubated in 500 μl JC1 Working Solution at 37 °C in a CO2 incubator for 15 min. Cells thus stained were washed with 2 ml 1x Assay Buffer, resuspended in 500 μl 1x Assay Buffer and used immediately for FACS analysis. JC1 forms aggregates and emits intense red fluorescence when ΔΨm is high. It remains in monomeric form and emits only green fluorescence when ΔΨm is low.
Transduction of HepG2 cells with lentiviral vectors and xenograft studies
HepG2 cells were maintained in DMEM (Dulbecco's modified Eagle's medium) containing 10% FBS. Lentiviral vectors that expressed human p53 (V3LHS_404717, V3LHS_333919 and V3LHS_333920) and Atg5 (V3LHS_301131, V3LMM_452283 and V2LMM_72717) shRNAs were purchased from Thermo Open-Biosystems (Lafayette, CO, USA). Lentiviral vectors that expressed human ATM shRNA were purchased from Sigma-Aldrich (St. Louis, MO, USA). A total of 5 × 10⁵ HepG2 cells were seeded in a 6-cm plate and infected with a lentivirus dose of 2.5 × 10⁶ the next day. Infected cells were cultured in DMEM containing FBS and 2 μg/ml puromycin dihydrochloride for 2 weeks. After the selection with puromycin, cells were tested for the transduction efficiency by flow cytometry and fluorescence microscopy, and the knockdown efficiency of p53 and Atg5 was determined by immunoblot. For in vivo tumorigenesis experiments, 18 eight-week-old male nude mice (BALB/cA-nu (nu/nu)) were randomly divided into four groups and subcutaneously injected with stable HepG2 cells that expressed the control shRNA, Atg5 shRNA, p53 shRNA or both Atg5 and p53 shRNAs in bilateral flanks (3 × 10⁶ cells per injection site). Bidimensional tumor measurements were taken with calipers every 5 days, and mice were killed after 50 or 60 days. The tumor volume was calculated using the formula (width2 × length)/2.
Real-time RT-PCR analysis of p53 and MDM2 mRNAs
Liver tissues were homogenized in Trizol (Invitrogen, Grand Island, NY, USA) and total RNA was isolated following the manufacturer's protocol. The cDNA synthesis was performed using 1 μg RNA, the random hexamer primer (Roche, Mannheim, Germany) and the MMLV Reverse Transcriptase Kit (Applied Biosystems, Grand Island, NY, USA). The real-time PCR was performed using the Invitrogen Power SYBR Green PCR Master Mix (Grand Island, NY, USA) and the Applied Biosystems 7500 Fast Real-Time PCR System (Grand Island, NY, USA). The primers used for RT-PCR were as follows: p53, forward: 5′-GGGCGTAAACGCTTCGAGATG-3′ and reverse: 5′-GAGGATTGTGTCTCAGCCCTG-3′ MDM2, forward: 5′-TTGATCCGAGCCTGGGTCTGT-3′ and reverse: 5′-AAGATCCTGATGCGAGGGCGT-3′ GAPDH, forward: 5′-TGAACGGGAAGCTCACTGG-3′ and reverse: 5′-TCCACCACCCTGTTGCTGTA-3′. PCR reactions were carried out in a total volume of 25 μl. The reaction mixture contained 2 × SYBR Mix (12.5 μl) from the kit, 0.4 pmol/μl from each primer and 4 U Taq DNA polymerase and 1 μl cDNA. The 2 × SYBR Mix contained the PCR buffer, Mg2+, dNTP mixture and SYBR Green. The thermal cycling condition included an initial denaturation step at 95 °C for 10 min and 40 reaction cycles consisting of a denaturation step at 95 °C for 15 s and an annealing/elongation step at 60 °C for 60 s. Fluorescent measurements were taken at the annealing/elongation step. Each sample was run in duplicates and mean Ct values were used for further calculations.
Intrahepatic tumor imaging by high-frequency ultrasound
Mice were anesthetized using 1–2% isoflurane in oxygen by inhalation throughout the entire procedure and placed on a heated stage to maintain the body temperature. The ultrasound was used to survey the liver for tumors and to measure tumor volume and overall liver size. Once the liver had been assessed, mice were allowed to recover fully.
Preparation of cells derived from xenografted tumors
Xenografted tumors were removed from nude mice, rinsed in PBS, minced in a Petri dish and then digested with trypsin at 37 °C for 30 min. Cells dispersed by trypsin were then incubated with DMEM containing 10% FBS in a CO2 incubator overnight. After the removal of cell debris, cells were rinsed with DMEM a few times and then allowed to grow and expand for further experiments.
Acknowledgments
We thank Ms Michelle MacVeigh-Aloni and the Histology Subcore of the USC Research Center for Liver Diseases (RCLD) for help with the PCNA staining and Ms Xiuyan Li of the USC RCLD Cell Culture Core for the preparation of primary mouse hepatocytes by liver perfusion. We also thank the USC Molecular Imaging Center and the Cell and Tissue Imaging Core for help with TEM, and Li-Peng Yap and Ryan Park of the USC Molecular Imaging Center for help with the mouse ultrasonic imaging. The floxed Atg5 mice were kindly provided by Dr Noboru Mizhushima at the Tokyo Medical and Dental University. This work was supported by NIH Grants AI083025, CA123328, CA177337, DK094652 and DK100257.
Glossary
- HCC
hepatocellular carcinoma
- PI3KC3
phosphatidylinositol-3-kinase class III
- DEN
diethylnitrosamine
- NAC
N-acetylcysteine
- H&E
hematoxylin and eosin
- ROS
reactive oxygen species
- 4-HNE
4-hydroxynonenal
- MDA
malondialdehyde
- 8-OXO-dG
8-hydroxy-2′-deoxyguanosine
- ATM
ataxia telangiectasia mutated
- PARP
poly(ADP-ribose) polymerase
- DCFDA
2′,7′-dichlorofluorescein diacetate
- PBS
phosphate-buffered saline
The authors declare no conflict of interest.
Footnotes
Supplementary Information accompanies this paper on Cell Death and Differentiation website (http://www.nature.com/cdd)
Edited by M Piacentini
Supplementary Material
References
- Mizushima N, Levine B, Cuervo AM, Klionsky DJ. Autophagy fights disease through cellular self-digestion. Nature. 2008;451:1069–1075. doi: 10.1038/nature06639. [DOI] [PMC free article] [PubMed] [Google Scholar]
- Levine B, Kroemer G. Autophagy in the pathogenesis of disease. Cell. 2008;132:27–42. doi: 10.1016/j.cell.2007.12.018. [DOI] [PMC free article] [PubMed] [Google Scholar]
- Mathew R, White E. Autophagy in tumorigenesis and energy metabolism: friend by day, foe by night. Curr Opin Genet Dev. 2011;21:113–119. doi: 10.1016/j.gde.2010.12.008. [DOI] [PMC free article] [PubMed] [Google Scholar]
- Lozy F, Karantza V. Autophagy and cancer cell metabolism. Semin Cell Dev Biol. 2012;23:395–401. doi: 10.1016/j.semcdb.2012.01.005. [DOI] [PMC free article] [PubMed] [Google Scholar]
- Liang XH, Jackson S, Seaman M, Brown K, Kempkes B, Hibshoosh H, et al. Induction of autophagy and inhibition of tumorigenesis by beclin 1. Nature. 1999;402:672–676. doi: 10.1038/45257. [DOI] [PubMed] [Google Scholar]
- Kang MR, Kim MS, Oh JE, Kim YR, Song SY, Kim SS, et al. Frameshift mutations of autophagy-related genes ATG2B, ATG5, ATG9B and ATG12 in gastric and colorectal cancers with microsatellite instability. J Pathol. 2009;217:702–706. doi: 10.1002/path.2509. [DOI] [PubMed] [Google Scholar]
- Qu X, Yu J, Bhagat G, Furuya N, Hibshoosh H, Troxel A, et al. Promotion of tumorigenesis by heterozygous disruption of the beclin 1 autophagy gene. J Clin Invest. 2003;112:1809–1820. doi: 10.1172/JCI20039. [DOI] [PMC free article] [PubMed] [Google Scholar]
- Marino G, Salvador-Montoliu N, Fueyo A, Knecht E, Mizushima N, Lopez-Otin C. Tissue-specific autophagy alterations and increased tumorigenesis in mice deficient in Atg4C/autophagin-3. J Biol Chem. 2007;282:18573–18583. doi: 10.1074/jbc.M701194200. [DOI] [PubMed] [Google Scholar]
- Takamura A, Komatsu M, Hara T, Sakamoto A, Kishi C, Waguri S, et al. Autophagy-deficient mice develop multiple liver tumors. Genes Dev. 2011;25:795–800. doi: 10.1101/gad.2016211. [DOI] [PMC free article] [PubMed] [Google Scholar]
- Inami Y, Waguri S, Sakamoto A, Kouno T, Nakada K, Hino O, et al. Persistent activation of Nrf2 through p62 in hepatocellular carcinoma cells. J Cell Biol. 2011;193:275–284. doi: 10.1083/jcb.201102031. [DOI] [PMC free article] [PubMed] [Google Scholar]
- Mathew R, Karantza-Wadsworth V, White E. Assessing metabolic stress and autophagy status in epithelial tumors. Methods Enzymol. 2009;453:53–81. doi: 10.1016/S0076-6879(08)04004-4. [DOI] [PMC free article] [PubMed] [Google Scholar]
- Guo JY, Chen HY, Mathew R, Fan J, Strohecker AM, Karsli-Uzunbas G, et al. Activated Ras requires autophagy to maintain oxidative metabolism and tumorigenesis. Genes Dev. 2011;25:460–470. doi: 10.1101/gad.2016311. [DOI] [PMC free article] [PubMed] [Google Scholar]
- Lock R, Roy S, Kenific CM, Su JS, Salas E, Ronen SM, et al. Autophagy facilitates glycolysis during Ras-mediated oncogenic transformation. Mol Biol Cell. 2011;22:165–178. doi: 10.1091/mbc.E10-06-0500. [DOI] [PMC free article] [PubMed] [Google Scholar]
- Wei H, Wei S, Gan B, Peng X, Zou W, Guan JL. Suppression of autophagy by FIP200 deletion inhibits mammary tumorigenesis. Genes Dev. 2011;25:1510–1527. doi: 10.1101/gad.2051011. [DOI] [PMC free article] [PubMed] [Google Scholar]
- Levine B, Mizushima N, Virgin HW. Autophagy in immunity and inflammation. Nature. 2011;469:323–335. doi: 10.1038/nature09782. [DOI] [PMC free article] [PubMed] [Google Scholar]
- Dalle-Donne I, Rossi R, Colombo R, Giustarini D, Milzani A. Biomarkers of oxidative damage in human disease. Clin Chem. 2006;52:601–623. doi: 10.1373/clinchem.2005.061408. [DOI] [PubMed] [Google Scholar]
- Cooke MS, Evans MD, Burd RM, Patel K, Barnard A, Lunec J, et al. Induction and excretion of ultraviolet-induced 8-oxo-2'-deoxyguanosine and thymine dimers in vivo: implications for PUVA. J Invest Dermatol. 2001;116:281–285. doi: 10.1046/j.1523-1747.2001.01251.x. [DOI] [PubMed] [Google Scholar]
- Llovet JM, Chen Y, Wurmbach E, Roayaie S, Fiel MI, Schwartz M, et al. A molecular signature to discriminate dysplastic nodules from early hepatocellular carcinoma in HCV cirrhosis. Gastroenterology. 2006;131:1758–1767. doi: 10.1053/j.gastro.2006.09.014. [DOI] [PubMed] [Google Scholar]
- Scholzen T, Gerdes J. The Ki-67 protein: from the known and the unknown. J Cell Physiol. 2000;182:311–322. doi: 10.1002/(SICI)1097-4652(200003)182:3<311::AID-JCP1>3.0.CO;2-9. [DOI] [PubMed] [Google Scholar]
- Leslie NR, Batty IH, Maccario H, Davidson L, Downes CP. Understanding PTEN regulation: PIP2, polarity and protein stability. Oncogene. 2008;27:5464–5476. doi: 10.1038/onc.2008.243. [DOI] [PubMed] [Google Scholar]
- Levine B, Abrams J. P53: The Janus of autophagy. Nat Cell Biol. 2008;10:637–639. doi: 10.1038/ncb0608-637. [DOI] [PMC free article] [PubMed] [Google Scholar]
- Rambhatla L, Ram-Mohan S, Cheng JJ, Sherley JL. Immortal DNA strand cosegregation requires p53/IMPDH-dependent asymmetric self-renewal associated with adult stem cells. Cancer Res. 2005;65:3155–3161. doi: 10.1158/0008-5472.CAN-04-3161. [DOI] [PubMed] [Google Scholar]
- Muller M, Strand S, Hug H, Heinemann EM, Walczak H, Hofmann WJ, et al. Drug-induced apoptosis in hepatoma cells is mediated by the CD95 (APO-1/Fas) receptor/ligand system and involves activation of wild-type p53. J Clin Invest. 1997;99:403–413. doi: 10.1172/JCI119174. [DOI] [PMC free article] [PubMed] [Google Scholar]
- Klionsky DJ, Abdalla FC, Abeliovich H, Abraham RT, Acevedo-Arozena A, Adeli K, et al. Guidelines for the use and interpretation of assays for monitoring autophagy. Autophagy. 2012;8:445–544. doi: 10.4161/auto.19496. [DOI] [PMC free article] [PubMed] [Google Scholar]
- Sun K, Guo XL, Zhao QD, Jing YY, Kou XR, Xie XQ, et al. Paradoxical role of autophagy in the dysplastic and tumor-forming stages of hepatocarcinoma development in rats. Cell Death Dis. 2013;4:e501. doi: 10.1038/cddis.2013.35. [DOI] [PMC free article] [PubMed] [Google Scholar]
- Guo JY, Karsli-Uzunbas G, Mathew R, Aisner SC, Kamphorst JJ, Strohecker AM, et al. Autophagy suppresses progression of K-ras-induced lung tumors to oncocytomas and maintains lipid homeostasis. Genes Dev. 2013;27:1447–1461. doi: 10.1101/gad.219642.113. [DOI] [PMC free article] [PubMed] [Google Scholar]
- Rosenfeldt MT, O'Prey J, Morton JP, Nixon C, Mackay G, Mrowinska A, et al. P53 status determines the role of autophagy in pancreatic tumour development. Nature. 2013;504:296–300. doi: 10.1038/nature12865. [DOI] [PubMed] [Google Scholar]
- Tian Y, Sir D, Kuo CF, Ann DK, Ou JH. Autophagy required for hepatitis B virus replication in transgenic mice. J Virol. 2011;85:13453–13456. doi: 10.1128/JVI.06064-11. [DOI] [PMC free article] [PubMed] [Google Scholar]
- Zheng Y, Chen WL, Louie SG, Yen TS, Ou JH. Hepatitis B virus promotes hepatocarcinogenesis in transgenic mice. Hepatology. 2007;45:16–21. doi: 10.1002/hep.21445. [DOI] [PubMed] [Google Scholar]
Associated Data
This section collects any data citations, data availability statements, or supplementary materials included in this article.


