Abstract
Purpose
To determine the retinal nerve fiber layer (RNFL) thickness at which visual field (VF) damage becomes detectable and associated with structural loss.
Design
Retrospective cross-sectional study.
Methods
Eighty seven healthy and 108 glaucoma subjects (one eye per subject) were recruited from an academic institution. All patients had VF examinations (Swedish Interactive Threshold Algorithm 24-2 test of the Humphrey visual field analyzer 750i; Carl Zeiss Meditec, Dublin, CA) and spectral domain optical coherence tomography RNFL scans (Spectralis, Heidelberg Engineering, Heidelberg, Germany). Comparison of RNFL thicknesses values with VF threshold values showed a plateau of VF threshold values at high RNFL thickness values and then a sharp decrease at lower RNFL thickness values. A broken stick statistical analysis was utilized to estimate the tipping point at which RNFL thickness values are associated with VF defects. The slope for the association between structure and function was computed for data above and below the tipping point.
Results
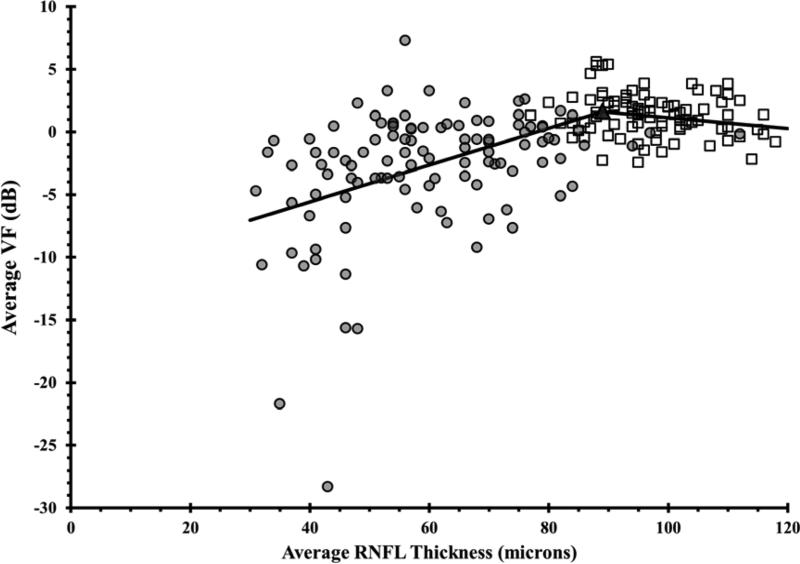
The mean RNFL thickness value that was associated with initial VF loss was 89 μm. The superior RNFL thickness value that was associated with initial corresponding inferior VF loss was 100 μm. The inferior RNFL thickness value that was associated with initial corresponding superior VF loss was 73 μm. The differences between all the slopes above and below the aforementioned tipping points were statistically significant (p<0.001).
Conclusions
In open angle glaucoma, substantial RNFL thinning or structural loss appears to be necessary before functional visual field defects become detectable.
Keywords: retinal nerve fiber layer, spectral domain optical coherence tomography
Introduction
Glaucoma causes damage to the retinal ganglion cells (RGCs), their axons, and associated glial cells. This damage leads to characteristic structural changes of the optic disc and retinal nerve fiber layer (RNFL) and functional loss of vision.1
Glaucoma specialists acknowledge the important challenges of detecting early glaucomatous damage and its progression over time. It has been reported that substantial RGC loss may occur at a specific location before a corresponding visual field loss is detected.2-4 Visual field testing is subjective and prone to inter-test variability,5 whereas OCT imaging of RNFL thickness measurements are objective. Nevertheless, both structural and functional tests are important in assessing early damage and progression in glaucoma.
The ability of any model to correlate structure and function depends on the map that is being utilized to accurately relate specific standard automatic perimetric (SAP) field regions to their corresponding RNFL sectors. The Garway-Heath map6 is an example of one such model that has been validated in many previous studies.1, 7-9 Wollstein et al7 used the broken stick tipping point model to determine how much structural damage as measured by Cirrus HD-OCT is needed before functional loss is detected by visual field testing. Our study complements that work by using the Spectralis machine in a larger group of glaucoma patients. The main purpose of this paper is to determine the RNFL tipping point, or the RNFL values at which visual field loss is first detected.
Methods
Data Collection
We did a retrospective review of patients who were seen at the Glaucoma Service at the Massachusetts Eye and Ear Infirmary between February 2009 and Dec 2011. Study protocols were approved by the Massachusetts Eye and Ear Infirmary Institutional Review Board and were in accordance with the Health Insurance Portability and Accountability Act. The research adhered to the tenets of the Declaration of Helsinki for research involving human subjects. Study participants were recruited from the ongoing SIG study (spectral domain OCT in glaucoma study).
Subjects were included if they were either healthy volunteers or open-angle glaucoma patients of age 18 years or older. Subjects were excluded if any of the following was present: corneal scarring, media opacities, anterior segment dysgenesis, past chronic steroid use, history of diabetic retinopathy, or any other disease or medical treatment that might independently affect VF or retinal thickness. Other exclusion criteria included history of intraocular surgery except for uncomplicated cataract extraction at least a year prior to enrolment, best corrected visual acuity worse than 20/40, refractive error outside the −6.00 to +6.00 diopter range, and any ocular abnormality other than glaucoma. One eye of each subject was randomly selected. In unilateral glaucoma cases, the affected eye was selected.
During the above study period, 195 eyes of 195 subjects were included in the current study after inclusion and exclusion criteria were applied.
Procedures
All patients had a complete history and eye examination by a glaucoma specialist (TCC). Clinical data obtained included best corrected visual acuity, Goldman applanation tonometry, slit lamp biomicroscopy, gonioscopy, pachymetry (PachPen, Accutome Ultrasound Inc., Malvern, PA), and dilated fundus exam. Age, race, gender, and spherical equivalent refractive error were recorded for all patients.
Visual field testing
Swedish Interactive Threshold Algorithm (SITA) 24-2 perimetry of the Humphrey visual field analyzer 750i, (Carl Zeiss Meditec, Dublin, CA) was performed in all subjects. Qualified tests had a false positive and a false negative of <20%, and fixation losses of <33%. Healthy subjects had a glaucoma hemifield test (GHT) within normal limits and their mean deviation (MD) and pattern standard deviation (PSD) within 95% of healthy population. Glaucomatous VFs were defined as those with at least one of the following confirmed: GHT outside normal limits, or pattern standard deviation probability outside 95% of the healthy population.
VF total deviation values were recorded in all 52 testing points. The individual HVF values were grouped to correspond with sectors or regions on the spectral domain optical coherence tomography (SD-OCT) printout. This structure-function correlation was modeled after the Garway-Heath map.6 Total deviation values were unlogged, and the average of all values in each group was log transformed back to decibel scale.1 A secondary analysis was performed to correlate the visual field mean deviation (MD) with the mean RNFL thickness.
Spectral Domain Optical Coherence Tomography Imaging
All patients had peripapillary SD-OCT RNFL thickness measurements (Spectralis, Heidelberg Engineering, Heidelberg, Germany). The Spectralis OCT has a scan speed of 40,000 A-lines per second. Eye movement tracking is achieved by the TruTrack image alignment software. Using this system, multiple images can be obtained from exactly the same location and then averaged to reduce speckle noise.10, 11 Real-time eye tracking also compensates for many of the involuntary eye movements that can occur during image acquisition and that result in motion artifacts. The scan circle around the optic nerve is 12 degrees in diameter, and the scan circle diameter in millimeters therefore depends on the axial eye length. For a typical eye length, the circle would be approximately 3.5 to 3.6 mm in diameter.
The Spectralis OCT software (version 4.0) allows for automatic segmentation of the upper and lower borders of the RNFL to calculate the average RNFL thickness. Peripapillary RNFL thickness values are divided into 4 quadrants. The superior and inferior quadrants are further divided into nasal and temporal sectors. Using this approach, we have previously reported an excellent degree of reproducibility in the measurement of peripapillary RNFL thickness values using Spectralis OCT.12
Statistical Methods
A scatter plot was first used to show the relationship between RNFL thickness and VF threshold values, and the relationship was then described by a smoothing curve to visually identify the RNFL thickness region which showed changes between a plateau and a steep decrease in the relationship. A series of broken stick regression models with specified tipping point in the identified region were then fitted into the data and the model with the highest R-squared value was chosen as the final model. The tipping point from the final model was reported, along with the slopes above and below the tipping point and their corresponding 95% confidence interval. P values < 0.05 were considered statistically significant.
Results
Patient Characteristics
One hundred ninety five subjects were recruited for the study: 87 healthy and 108 open angle glaucoma subjects. Of the open angle glaucoma patients, 84 had primary open angle glaucoma, 16 had pseudoexfoliation glaucoma, and 8 had normal tension glaucoma. Demographics are summarized in Table 1.
Table 1.
Demographics of the healthy and glaucomatous subjects. Table includes age, gender, visual field findings, retinal nerve fiber layer thickness, and spherical equivalent
| Healthy (n= 87) | Glaucoma (n=108) | P value | |
|---|---|---|---|
| Age (years) | 53.5 ± 13.2 | 68.7 ± 11.5 | < 0.001* |
| Female/Male | 56/31 | 61/47 | 0.27 |
| Visual field MD (dB) | −0.6 ± 1.5 | −11.3 ± 7.8 | < 0.001* |
| Visual field PSD (dB) | 1.4 ± 0.3 | 7.3 ± 3.6 | < 0.001* |
| OCT mean RNFL (μm) | 97.2 ± 9.2 | 60.2 ± 15.9 | < 0.001* |
| Spherical equivalent (diopters) | −0.3 ± 2.31 | −0.58 ± 1.96 | 0.36 |
MD, mean deviation; PSD, pattern standard deviation; OCT, optical coherence tomography; RNFL, retinal nerve fiber layer
= statistically significant (p < 0.05).
The mean RNFL thickness was 97.2 ± 9.2 (CI: 95.3 to 99.1) μm for the healthy subjects. We applied the ISNT rule13,14 for peripapillary RNFL thickness values and found that 42/87 (48.3%) of the normal subjects in our study followed the ISNT rule for RNFL, where the average RNFL thickness values decreased starting from the thickest quadrant inferiorly to the thinnest quadrant temporally (Table 2). The mean RNFL thickness was thinner in the glaucoma subjects at 60.2 ± 15.9 (CI: 57.2 to 63.2) μm. Only 7/108 (6.5%) of the glaucoma patients followed the RNFL ISNT rule (Table 2).
Table 2.
Percentage of Normal and Glaucoma Eyes that Met the ISNT Rule for Retinal Nerve Fiber Layer Thickness. The ISNT rule holds when the retinal nerve fiber layer (RNFL) is thickest in the inferior quadrant, followed by superior, nasal, and then temporal quadrants. Optical coherence tomography RNFL thickness values are shown.
| Quadrant | Normal (n=87) | Glaucoma (n=108) |
| Mean ± SD [95% CI] (μm) | Mean ± SD [95% CI] (μm) | |
| Inferior | 126.5 ± 17.1 [122.9 to 130.1] | 67.0 ± 21.9 [62.9 to 71.1] |
| Superior | 117.0 ± 17.1 [113.4 to 120.6] | 71.3 ± 23.6 [66.8 to 75.8] |
| Nasal | 75.9 ± 13.8 [73.0 to 78.8] | 49.9 ± 19.1 [46.3 to 53.5] |
| Temporal | 69.0 ± 10.4 [66.8 to 71.3] | 52.4 ± 15.2 [49.5 to 55.3] |
| ISNT rule met | 42/87 (48.3%) | 7/108 (6.5%) |
SD, standard deviation; CI, confidence interval.
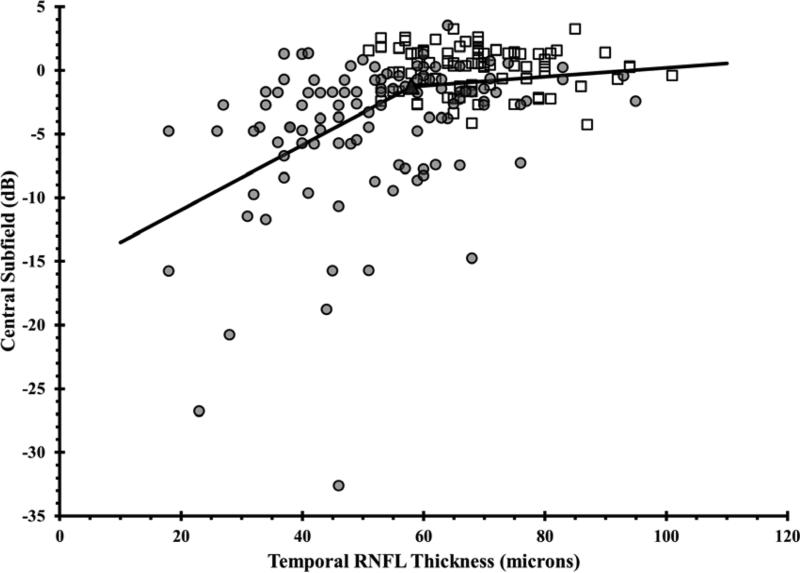
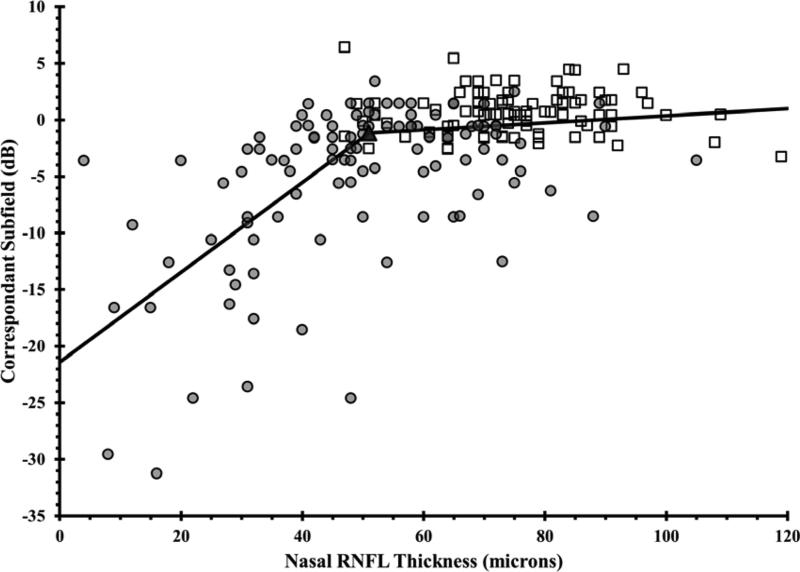
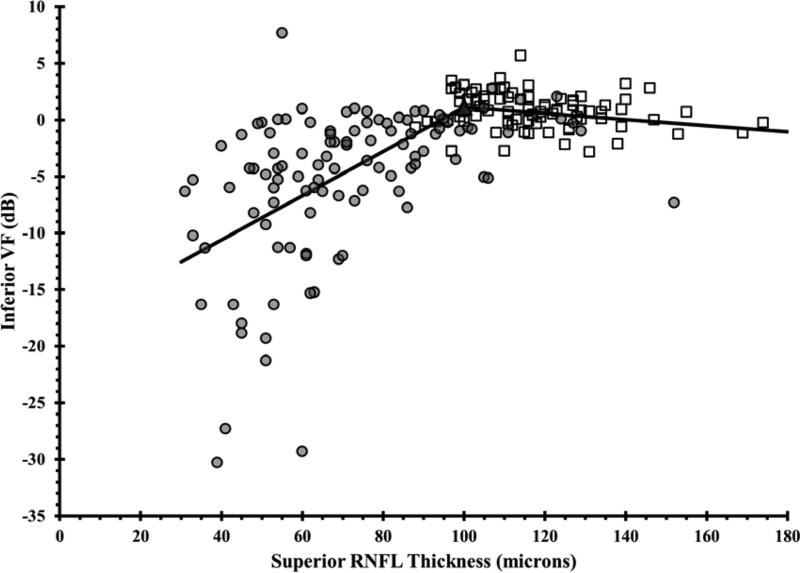
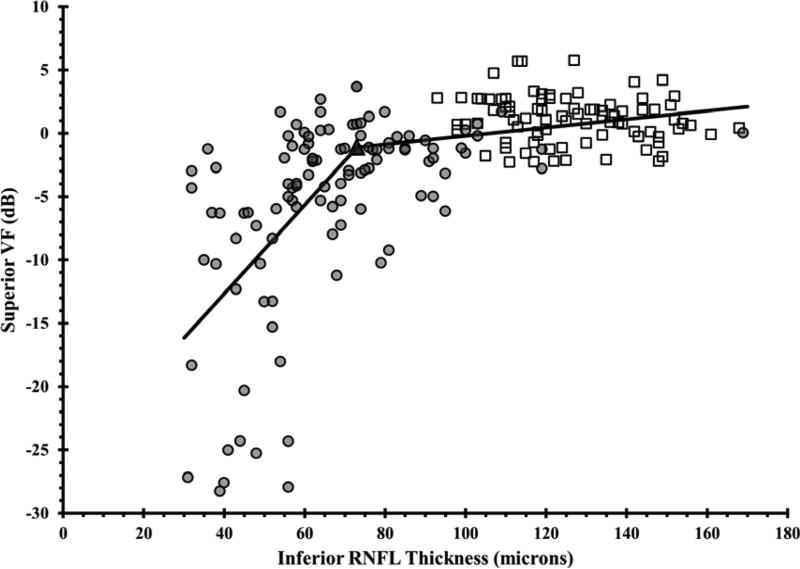
Scatter plots of RNFL thickness and VF threshold values demonstrated a range of RNFL thickness values that were unrelated to VF values followed by a range of RNFL thickness values that exhibited a strong relationship between these two parameters (Figure 1). Estimates of the statistically optimal tipping points between these two ranges for average and quadrant RNFL thicknesses are listed in Table 3. Using the mean RNFL thickness values for the normal subjects in our cohort, the percentage of RNFL loss necessary to reach the tipping point was also calculated for the mean and quadrant RNFL thickness values. The tipping point for the mean RNFL measurement occurred after an 8.4% loss from the mean normal value and after a 14.5% and 42.3% loss in the superior and inferior quadrants, respectively (Table 3).
Figure 1. Using the Broken Stick Model to Determine the Tipping Point, the Point at Which Retinal Nerve Fiber Layer Thinning is First Associated with Visual Field Loss.
Graphs correlate retinal nerve fiber layer (RNFL) thickness values with corresponding VF values, where each of the 52 testing points were unlogged, averaged, then log transformed back to decibel scale. Graphs are presented for the global RNFL values versus average VF total deviation values (upper), the superior RNFL region versus inferior VF (middle left), the inferior RNFL region versus superior VF (middle right), the temporal RNFL region versus central subfield (lower left), and the nasal RNFL region versus corresponding visual subfield (lower right). Broken stick model is represented by the black lines. Empty squares represent healthy eyes. Filled circles represent glaucoma eyes. Filled triangles represent the tipping points.
Table 3.
The retinal nerve fiber layer thickness tipping point values, which are associated with initial visual field loss, are shown with their associated degree of percentage retinal nerve fiber layer thickness loss.
| RNFL area | RNFL tipping point (μm) | Mean normal RNFL thickness (μm) | Average percent RNFL thickness loss associated with each tipping point value |
|---|---|---|---|
| Global | 89 | 97.2 | 8.4% |
| Temporal Quadrant | 58 | 69.0 | 15.9% |
| Superior Quadrant | 100 | 117.0 | 14.5% |
| Nasal Quadrant | 51 | 75.9 | 32.8% |
| Inferior Quadrant | 73 | 126.5 | 42.3% |
RNFL, retinal nerve fiber layer
The slopes below the tipping point were significantly different than a zero slope. The slopes below the tipping points were significantly steeper than the slopes above the tipping point for all locations. The slopes for VF threshold as a function of RNFL thickness above and below the tipping points are listed in Table 4.
Table 4.
Slopes Associated with the Broken Stick Model Which Was Used to Determine the Tipping Point, the Point at Which Retinal Nerve Fiber Layer Thinning is First Associated with Visual Field Loss. Values of fitted slopes below and above the tipping point are listed for global and quadrant retinal nerve fiber layer thickness values.
| RNFL area | Slopes below the tipping point (dB per μm) | Slopes above the tipping point (dB per μm) | Difference between the slopes below and above the tipping point (95% CI) | P value* | ||
|---|---|---|---|---|---|---|
| Slope (95% CI) | P value* | Slope (95% CI) | P value | |||
| Global | 0.15 (0.11 to 0.18) | <0.001 | −0.04 (−0.13 to 0.04) | 0.30 | −0.2 (−0.3 to −0.09) | <0.001 |
| Temporal quadrant | 0.26 (0.18 to 0.33) | <0.001 | 0.04 (−0.04 to 0.11) | 0.35 | −0.22 (−0.35 to −0.09) | <0.001 |
| Superior quadrant | 0.2 (0.16 to 0.23) | <0.001 | −0.03 (−0.08 to 0.02) | 0.3 | −0.22 (−0.3 to −0.15) | <0.001 |
| Nasal quadrant | 0.4 (0.32 to 0.5) | <0.001 | 0.03 (−0.02 to 0.08) | 0.2 | −0.37 (−0.5 to −0.26) | <0.001 |
| Inferior quadrant | 0.4 (0.28 to 0.42) | <0.001 | 0.03 (0.01 to 0.06) | 0.024* | −0.32 (−0.41 to −0.22) | <0.001 |
RNFL, retinal nerve fiber ayer; CI, confidence interval
= statistically significant (p < 0.05). P values for the slopes below and above the tipping points represent the statistical significance of the slopes being different than zero. P values for the last column represent the statistical significance of the difference between the slopes below and above the tipping points.
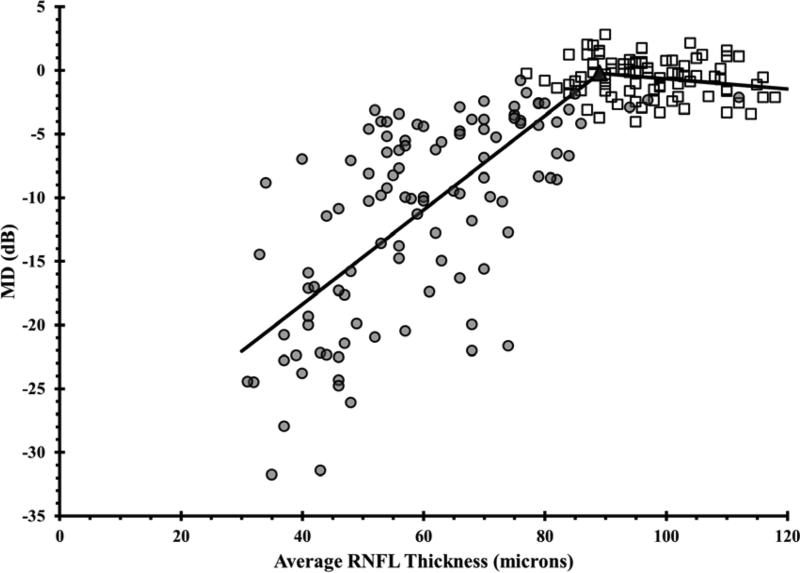
Employing the same approach but using VF MD instead of the threshold values, the tipping point was determined to be 89 μm (Figure 2), with slopes above the tipping point of -0.04 (-0.14 to 0.06) dB/μm (p= 0.45) and below the tipping point of 0.37 (0.33 to 0.41) dB/μm (p< 0.001) with a statistically significant difference between the slopes (p< 0.001).
Figure 2. Using the Broken Stick Model to Determine the Tipping Point, the Point at Which Retinal Nerve Fiber Layer Thinning is First Associated with Visual Field Loss.
Graph correlates global retinal nerve fiber layer (RNFL) with mean deviation visual field (VF) values for healthy and glaucoma eyes. The broken stick model is represented by the black lines. Empty squares represent healthy eyes. Filled circles represent glaucoma eyes. The filled triangle represents the tipping point.
Discussion
Glaucoma is the second leading cause of blindness in the world. It affects more than 2.5 million people in the United States.15 Detecting structural changes that precede visual function loss may be a key to vision preservation in glaucoma patients.16 Measuring early structural RNFL thinning by OCT also provides an objective measurement in the evaluation of glaucoma patients. Although visual field testing is subjective and prone to inter-test variability,5 it remains the most common tool to detect functional vision loss in glaucoma patients. Our study utilized the broken stick model to determine the tipping point at which VF damage becomes associated with detectable structural changes as measured by Spectralis-OCT.
Previous studies have shown that RNFL thickness and visual field sensitivity decrease with age.17-25 Therefore, the VF total deviation threshold values, which are age corrected, were used. We also performed another analysis using VF mean deviation (MD), because this parameter is commonly used in clinical practice.
The slope of VF threshold versus RNFL was not significantly different than zero in the region above the tipping point for global and all sectoral analyses. This is in agreement with the previous literature1, 7, 26-30 where thicker RNFL values were not associated with abnormalities in the VF threshold. This can be explained by the higher variability in VF outcomes than structural outcomes in the early stages of glaucoma.1,26 Therefore, RNFL structural evaluation may be a more sensitive measure of health than VF function in the early stages of glaucoma, and this is consistent with past reports on histology and disc photography assessment.7,31,32 There was a strong correlation between structure and function below the tipping point, with a rate of change that varied by RNFL sector.
It has been reported that substantial retinal ganglion cell loss and RNFL thinning may occur at a specific location before a corresponding visual field loss is detected.33,34 Kerrigan-Baumrind et al4 compared SAP field loss to post-mortem RGC counts in humans, and found that a statistically significant SAP field defect did not occur until 25% to 35% of the RGCs were lost. Previous studies utilized either a linear or curvilinear model throughout the data in order to evaluate the in vivo structure-function relationship in glaucoma.1,26-30 Ajtony et al30 had detected a mean global RNFL thickness threshold of approximately 70 microns using the Stratus-OCT. Recently, Wollstein et al7 utilized the broken stick statistical analysis to determine a tipping point RNFL thickness of 75.3 microns in 72 healthy and 40 glaucomatous eyes by using Cirrus HD-OCT. Wollstein study revealed that approximately 17% of RNFL thinning was necessary for functional damage to be detectable. In our study, we utilized the Spectralis-OCT in 87 healthy and 108 glaucomatous eyes and found a tipping point of 89 microns by applying the broken stick model. Therefore, at least 8.4% of global RNFL thinning is necessary to detect general functional vision loss (Table 3).
Wollstein et al7 demonstrated detectable visual field defects were associated with 26% and 28% of RNFL thinning in the inferior and superior quadrants, respectively. In our study, substantial inferior quadrant RNFL thinning (42.3%) appears to be necessary for functional loss to be detectable, whereas less superior RNFL thinning (14.5%) is needed before visual field defects are detectable (Table 3). Normally, the inferior RNFL is usually the thickest (ISNT rule). We found that only 15.9% of RNFL thinning was needed in order to detect central visual field loss. Difficulties have been reported with estimating the structure-function relationship at the nasal area adjacent to the optic disc because of the paucity of test points at the temporal regions adjacent to the blind spot on the VF test.8 Furthermore, OCT measurements in the nasal quadrant had the lowest test-retest reproducibility by using Stratus and spectral domain OCT.35, 36 Wollstein et al7 could not detect a tipping point for the nasal quadrant. In our study, we reported a structural tipping point of 51 microns for the nasal quadrant (Table 3).
A complete loss of retinal ganglion cells in humans leaves a residual layer thickness due to blood vessels and glial cells,37-40 and the thickness of this residual layer varies among individuals.37 Hood et al40 reported that approximately 13% of the overall OCT measured RNFL area was due to signals from the blood vessels. Therefore, our reported RNFL thinning percentages may be underestimated since we cannot accurately subtract that nonfunctional residual layer thickness from our OCT measurements.
The limitations of our study are its cross-sectional nature. Our findings may not apply to certain individual patients if these same subjects were to be observed longitudinally. Clinicians should be cautious when applying our findings to individual subjects, because of the large variation in normal RNFL thickness values. Patients may start with a thinner or thicker RNFL, and their individual tipping point for RNFL thickness may vary from the average value we reported. Thus, it is important to understand the implications of the wide variation in normal RNFL thickness values when applying our tipping point values for an individual patient.
Although our study was modeled after the Wollstein and associates paper which included subjects with refractive errors ranging from −12.00 to +8.00 diopters,7 we restricted the range of refractive errors in our study (−6.00 to +6.00 diopters) for both the normal and glaucoma subjects. Therefore, the effects of refractive error on RNFL thickness in our study should be lessened. To date, our study has the largest group of patients used to analyze a clinically relevant tipping point.
In conclusion, the broken stick analysis allows for the identification of a structural tipping point. This may help to guide the physician to know at which RNFL thickness value one should be more concerned about imminent vision loss.
Acknowledgments
Funding/Support: None
Financial Disclosures: Teresa C Chen, M.D. has received funding from the Agency for Healthcare Research and Quality, the Massachusetts Lions Eye Research Fund, and the American Glaucoma Society Mid-Career Award. Dr. Chen has also received support from Harvard Catalyst | The Harvard Clinical and Translational Science Center (National Center for Research Resources and the National Center for Advancing Translational Sciences, National Institutes of Health Award 8UL1TR000170-05 and financial contributions from Harvard University and its affiliated academic health care centers).
Other Acknowledgments: The content is solely the responsibility of the authors and does not necessarily represent the official views of Harvard Catalyst, Harvard University and its affiliated academic health care centers, or the National Institutes of Health.
Biography
 Tarek Alasil, MD is a Research Fellow at the Massachusetts Eye and Ear Infirmary. Dr. Alasil is American Board Certified in Internal Medicine. He will start his Ophthalmology Residency Training at the Yale Eye Center in the summer of 2014. His main research interests focus on ophthalmic imaging with optical coherence tomography. He has published over 20 original articles, major reviews, case reports, and book reviews.
 Teresa C. Chen, MD is an Associate Professor of Ophthalmology at the Harvard Medical School. She works in the Glaucoma Service at the Massachusetts Eye and Ear Infirmary. Her research expertise is in imaging and the pediatric glaucomas. She edited the book Glaucoma Surgery and has published over 100 original articles, major reviews, and book chapters. Drs. de Boer and Chen were the first to image a glaucoma eye with spectral domain optical coherence tomography.
Footnotes
Publisher's Disclaimer: This is a PDF file of an unedited manuscript that has been accepted for publication. As a service to our customers we are providing this early version of the manuscript. The manuscript will undergo copyediting, typesetting, and review of the resulting proof before it is published in its final citable form. Please note that during the production process errors may be discovered which could affect the content, and all legal disclaimers that apply to the journal pertain.
Contributions of Authors: Design of the study (TA, FY, HL, TCC); conduct of the study (TA, JFD, TCC); collection of data (TA, KW, MGF, NB), management (TA, ALC, TCC); analysis (TA, FY, HL, ALC, TCC); interpretation of the data (TA, FY, HL, TCC); preparation (TA, TCC), review (TA, FY, HL, TCC); and approval of the manuscript (TA, KW, FY, MGF, NB, HL, JFD, ALC, TCC).
References
- 1.Hood DC, Kardon RH. A framework for comparing structural and functional measures of glaucomatous damage. Prog Retin Eye Res. 2007;26(6):688–710. doi: 10.1016/j.preteyeres.2007.08.001. [DOI] [PMC free article] [PubMed] [Google Scholar]
- 2.Quigley HA. Number of people with glaucoma worldwide. Br J Ophthalmol. 1996;80(5):389–93. doi: 10.1136/bjo.80.5.389. [DOI] [PMC free article] [PubMed] [Google Scholar]
- 3.Quigley HA, Broman AT. The number of people with glaucoma worldwide in 2010 and 2020. Br J Ophthalmol. 2006;90(3):262–7. doi: 10.1136/bjo.2005.081224. [DOI] [PMC free article] [PubMed] [Google Scholar]
- 4.Kerrigan-Baumrind LA, Quigley HA, Pease ME, et al. Number of ganglion cells in glaucoma eyes compared with threshold visual field tests in the same persons. Invest Ophthalmol Vis Sci. 2000;41(3):741–8. [PubMed] [Google Scholar]
- 5.Turalba AV, Grosskreutz C. A review of current technology used in evaluating visual function in glaucoma. Semin Ophthalmol. 2010;25(5-6):309–16. doi: 10.3109/08820538.2010.518898. [DOI] [PubMed] [Google Scholar]
- 6.Garway-Heath DF, Poinoosawmy D, Fitzke FW, et al. Mapping the visual field to the optic disc in normal tension glaucoma eyes. Ophthalmology. 2000;107(10):1809–15. doi: 10.1016/s0161-6420(00)00284-0. [DOI] [PubMed] [Google Scholar]
- 7.Wollstein G, Kagemann L, Bilonick RA, Ishikawa H, Folio LS, Gabriele ML, Ungar AK, Duker JS, Fujimoto JG, Schuman JS. Retinal nerve fiber layer and visual function loss in glaucoma: the tipping point. Br J Ophthalmol. 2012;96(1):47–52. doi: 10.1136/bjo.2010.196907. [DOI] [PMC free article] [PubMed] [Google Scholar]
- 8.Takagishi M, Hirooka K, Baba T, Mizote M, Shiraga F. Comparison of retinal nerve fiber layer thickness and measurements using time domain and spectral domain optical coherence tomogrpahy and visual field sensitivity. J Glaucoma. 2011;20(6):383–7. doi: 10.1097/IJG.0b013e3181efb371. [DOI] [PubMed] [Google Scholar]
- 9.Nilforushan N, Nassiri N, Moghimi S, et al. Structure-function relationships between spectral-domain OCT and standard achromatic perimetry. Invest Ophthalmol Vis Sci. 2012;53(6):2740–8. doi: 10.1167/iovs.11-8320. [DOI] [PubMed] [Google Scholar]
- 10.Hammer DX, Ferguson RD, Magill JC, et al. Compact scanning laser ophthalmoscope with high-speed retinal tracker. Appl Opt. 2003;42(22):4621–32. doi: 10.1364/ao.42.004621. [DOI] [PubMed] [Google Scholar]
- 11.Hammer DX, Ferguson RD, Magill JC, et al. Active retinal tracker for clinical optical coherence tomography systems. J Biomed Opt. 2005;10(2):024038. doi: 10.1117/1.1896967. [DOI] [PMC free article] [PubMed] [Google Scholar]
- 12.Wu H, de Boer JF, Chen TC. Reproducibility of retinal nerve fiber layer thickness measurements using spectral domain optical coherence tomography. J Glaucoma. 2011;20(8):470–6. doi: 10.1097/IJG.0b013e3181f3eb64. [DOI] [PMC free article] [PubMed] [Google Scholar]
- 13.Jonas JB, Gusek GC, Naumann GO. Optic disc, cup and neuroretinal rim size, configuration and correlations in normal eyes. Invest Ophthalmol Vis Sci. 1988;29(7):1151–8. [PubMed] [Google Scholar]
- 14.Harizman N, Oliveira C, Chiang A, et al. The ISNT rule and differentiation of normal from glaucomatous eyes. Arch Ophthalmol. 2006;124(11):1579–83. doi: 10.1001/archopht.124.11.1579. [DOI] [PubMed] [Google Scholar]
- 15.The International Bank for Reconstruction and Development the World Bank . World Development Report. Oxford University Press; Oxford: 1993. pp. 1–348. [Google Scholar]
- 16.Sommer A, Katz J, Quigley HA, et al. Clinically detectable nerve fiber atrophy precedes the onset of glaucomatous field loss. Arch Ophthalmol. 1991;109(1):77–83. doi: 10.1001/archopht.1991.01080010079037. [DOI] [PubMed] [Google Scholar]
- 17.Bendschneider D, Tornow RP, Horn FK, et al. Retinal nerve fiber layer thickness in normals measured by spectral domain OCT. J Glaucoma. 2010;19(7):475–82. doi: 10.1097/IJG.0b013e3181c4b0c7. [DOI] [PubMed] [Google Scholar]
- 18.Alasil T, Wang K, Keane PA, et al. Analysis of Normal Retinal Nerve Fiber Layer Thickness by Age, Gender, and Race Using Spectral Domain Optical Coherence Tomography. J Glaucoma. 2013;22(7):532–41. doi: 10.1097/IJG.0b013e318255bb4a. [DOI] [PubMed] [Google Scholar]
- 19.Budenz DL, Anderson DR, Varma R, et al. Determinants of normal retinal nerve fiber layer thickness measured by Stratus OCT. Ophthalmology. 2007;114(6):1046–52. doi: 10.1016/j.ophtha.2006.08.046. [DOI] [PMC free article] [PubMed] [Google Scholar]
- 20.Varma R, Bazzaz S, Lai M. Optical tomography-measured retinal nerve fiber layer thickness in normal latinos. Invest Ophthalmol Vis Sci. 2003;44(8):3369–73. doi: 10.1167/iovs.02-0975. [DOI] [PubMed] [Google Scholar]
- 21.Nagai-Kusuhara A, Nakamura M, Fujioka M, et al. Association of retinal nerve fiber layer thickness measured by confocal scanning laser ophthalmoscopy and optical coherence tomography with disc size and axial length. Br J Ophthalmol. 2008;92(2):186–90. doi: 10.1136/bjo.2007.127480. [DOI] [PubMed] [Google Scholar]
- 22.Hirasawa H, Tomidokoro A, Araie M, et al. Peripapillary retinal nerve fiber layer thickness determined by spectral domain optical coherence tomography in ophthalmologically normal eyes. Arch Ophthalmol. 2010;128(11):1420–6. doi: 10.1001/archophthalmol.2010.244. [DOI] [PubMed] [Google Scholar]
- 23.Schuman JS, Hee MR, Puliafito CA, et al. Quantification of nerve fiber layer thickness in normal and glaucomatous eyes using optical coherence tomography. Arch Ophthalmol. 1995;113(5):586–96. doi: 10.1001/archopht.1995.01100050054031. [DOI] [PubMed] [Google Scholar]
- 24.Parikh RS, Parikh SR, Sekhar GC, et al. Normal age-related decay of retinal nerve fiber layer thickness. Ophthalmology. 2007;114(5):921–6. doi: 10.1016/j.ophtha.2007.01.023. [DOI] [PubMed] [Google Scholar]
- 25.Spry PG, Johnson CA. Senescent changes of the normal visual field: an old-age problem. Optom Vis Sci. 2001;78(6):436–41. doi: 10.1097/00006324-200106000-00017. [DOI] [PubMed] [Google Scholar]
- 26.Harwerth RS, Wheat JL, Fredette MJ, et al. Linking structure and function in glaucoma. Prog Retin Eye Res. 2010;29(4):249–71. doi: 10.1016/j.preteyeres.2010.02.001. [DOI] [PMC free article] [PubMed] [Google Scholar]
- 27.Schlottmann PG, De Cilla S, Greenfield DS, et al. Relationship between visual field sensitivity and retinal nerve fiber layer thickness as measured by scanning laser polarimetry. Invest Ophthalmol Vis Sci. 2004;45(6):1823–9. doi: 10.1167/iovs.03-0692. [DOI] [PubMed] [Google Scholar]
- 28.Leung CK, Chong KK, Chan WM, et al. Comparative study of retinal nerve fiber layer measurement by StratusOCT and GDx VCC, II: structure/function regression analysis in glaucoma. Invest Ophthalmol Vis Sci. 2005;46(10):3702–11. doi: 10.1167/iovs.05-0490. [DOI] [PubMed] [Google Scholar]
- 29.Badlani V, Shahidi M, Shakoor A, et al. Nerve fiber layer thickness in glaucoma patients with asymmetric hemifield visual field loss. J Glaucoma. 2006;15(4):275–80. doi: 10.1097/01.ijg.0000212298.23787.bf. [DOI] [PubMed] [Google Scholar]
- 30.Ajtony C, Balla Z, Somoskeoy S, et al. Relationship between visual field sensitivity and retinal nerve fiber layer thickness as measured by optical coherence tomography. Invest Ophthalmol Vis Sci. 2007;48(1):258–63. doi: 10.1167/iovs.06-0410. [DOI] [PubMed] [Google Scholar]
- 31.Quigley HA, Katz J, Derick RJ, et al. An evaluation of optic disc and nerve fiber layer examinations in monitoring progression of early glaucoma damage. Ophthalmology. 1992;99(1):19–28. doi: 10.1016/s0161-6420(92)32018-4. [DOI] [PubMed] [Google Scholar]
- 32.Quigley HA, Enger C, Katz J, et al. Risk factors for the development of glaucomatous visual field loss in ocular hypertension. Arch Ophthalmol. 1994;112(5):644–9. doi: 10.1001/archopht.1994.01090170088028. [DOI] [PubMed] [Google Scholar]
- 33.Quigley HA, Addicks EM, Green WR. Optic nerve damage in human glaucoma. III: quantitative correlation of nerve fiber loss and visual field defect in glaucoma, ischemic neuropathy, papilledema, and toxic neuropathy. Arch Ophthalmol. 1982;100(1):135–46. doi: 10.1001/archopht.1982.01030030137016. [DOI] [PubMed] [Google Scholar]
- 34.Quigley HA, Dunkelberger GR, Green WR. Retinal ganglion cell atrophy correlated with automated perimetry in human eyes with glaucoma. Am J Ophthalmol. 1989;107(5):453–64. doi: 10.1016/0002-9394(89)90488-1. [DOI] [PubMed] [Google Scholar]
- 35.Budenz DL, Fredette MJ, Feuer WJ, et al. Reproducibility of peripapillary retinal nerve fiber thickness measurements with stratus OCT in glaucomatous eyes. Ophthalmology. 2008;115(4):661–6. doi: 10.1016/j.ophtha.2007.05.035. [DOI] [PubMed] [Google Scholar]
- 36.Hood DC, Fortune B, Arthur SN, et al. Blood vessel contributions to retinal nerve fiber layer thickness profiles measured with optical coherence tomography. J Glaucoma. 2008;17(7):519–28. doi: 10.1097/IJG.0b013e3181629a02. [DOI] [PMC free article] [PubMed] [Google Scholar]
- 37.Hong S, Kim CY, Lee WS, Seong GJ. Reproducibility of peripapillary retinal nerve fiber layer thickness with spectral domain cirrus high-definition optical coherence tomography in normal eyes. Jpn J Ophthalmol. Jan. 2010;54(1):43–7. doi: 10.1007/s10384-009-0762-8. [DOI] [PubMed] [Google Scholar]
- 38.Hood DC, Anderson S, Rouleau J, et al. Retinal nerve fiber structure versus visual field function in patients with ischemic optic neuropathy. Ophthalmology. 2008;115(5):904–10. doi: 10.1016/j.ophtha.2007.06.001. [DOI] [PMC free article] [PubMed] [Google Scholar]
- 39.Hood DC. Relating retinal nerve fiber thickness to behavioral sensitivity in patients with glaucoma: application of a linear model. J Opt Soc Am A Opt Image Sci Vis. 2007;24(5):1426–30. doi: 10.1364/josaa.24.001426. [DOI] [PubMed] [Google Scholar]
- 40.Hood DC, Anderson SC, Wall M, Kardon RH. Structure versus function in glaucoma: a test of a linear model. Invest Ophthalmol Vis Sci. Invest Ophthalmol Vis Sci. 2007;48(8):3662–8. doi: 10.1167/iovs.06-1401. [DOI] [PubMed] [Google Scholar]


