

Abstract
Pharmacophore modelling-based virtual screening of compound is a ligand-based approach and is useful when the 3D structure of target is not available but a few known active compounds are known. Pharmacophore mapping studies were undertaken for a set of 50 N3-phenylpyrazinones possessing Corticotropin-releasing Factor 1 (CRF 1) antagonistic activity. Six point pharmacophores with two hydrogen bond acceptors, one hydrogen bond donor, two hydrophobic regions, and one aromatic ring as pharmacophoric features were developed. Amongst them the pharmacophore hypothesis AADHHR.47 yielded a statistically significant 3D-QSAR model with 0.803 as R 2 value and was considered to be the best pharmacophore hypothesis. The developed pharmacophore model was externally validated by predicting the activity of test set molecules. The squared predictive correlation coefficient of 0.91 was observed between experimental and predicted activity values of test set molecules. The geometry and features of pharmacophore were expected to be useful for the design of selective CRF 1 receptor antagonists.
1. Introduction
Anxiety and depression are among the most common disorders seen in medical practice. The coexistence of anxiety and depression with medical illness is a topic of considerable clinical and research interest [1]. Depression is a serious mental health problem, with significant consequences in terms of human suffering, lost productivity, and even loss of life [2]. Corticotropin-releasing factor 1 (CRF 1) receptor antagonists have been sought since the stress-secreted peptide (adrenocorticotropin-releasing hypothalamic peptide) was isolated in 1981. Although evidence is mixed concerning the efficacy of CRF 1 receptor antagonist as antidepressants, CRF 1 receptor antagonist might be novel pharmacotherapies for anxiety and addiction [3]. Two well-characterized receptor subtypes, CRF 1 and CRF 2, have been identified. These G-protein-coupled receptors are widely distributed throughout the central and peripheral nervous systems [4]. Clinical evidence supports the hypothesis that overproduction of CRF 1 may underlie the pathology of depression, anxiety, and stress-related disorders and suggests that CRF 1 receptor antagonists could be useful for the treatment of these conditions [5].
To reduce the overall cost associated with the discovery and development of a new drug, the computer-aided molecular design methods have been identified as the most promising candidates to focus on the experimental efforts in modern medicinal chemistry. Pharmacophore mapping is one of the major elements of drug design in the absence of structural data of the target receptor. With the aim of providing useful pharmacophoric information for the future efforts in the development of more potent molecules in the series of phenylpyrazinones and to get insight into the structural and molecular properties, the ligand-based 3D-QSAR study was performed using pharmacophore techniques with PHASE module from Schrodinger, New York [6, 7].
2. Experimental
2.1. Dataset
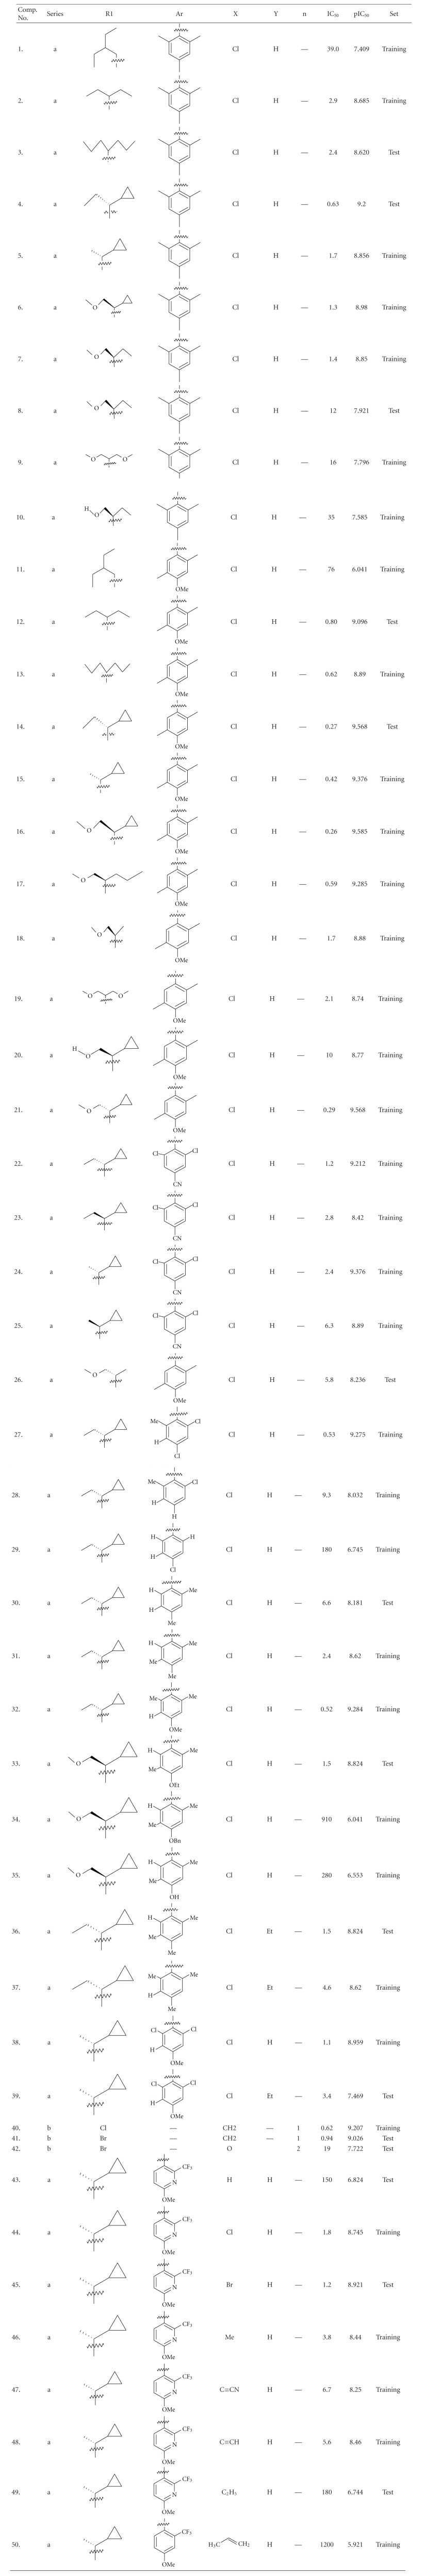
The in vitro biological data of a series of 50 phenylpyrazinones as CRF 1 receptor antagonists were used for the present studies [6]. The CRF 1 antagonistic activity was expressed as IC50, that is, concentration in μm required for 50% inhibition of enzyme activity. The dataset was divided randomly into training set and test set by considering the 70% of the total molecules in the training set and 30% in the test set. The basic structures of the N3-phenylpyrazinones are shown in Figure 1, and various substituents are listed in Table 1. Thirty-five molecules forming the training set were used to generate pharmacophore model and prediction of the activity of test set (15 compounds) molecules was used as a method to validate the proposed models.
Figure 1.
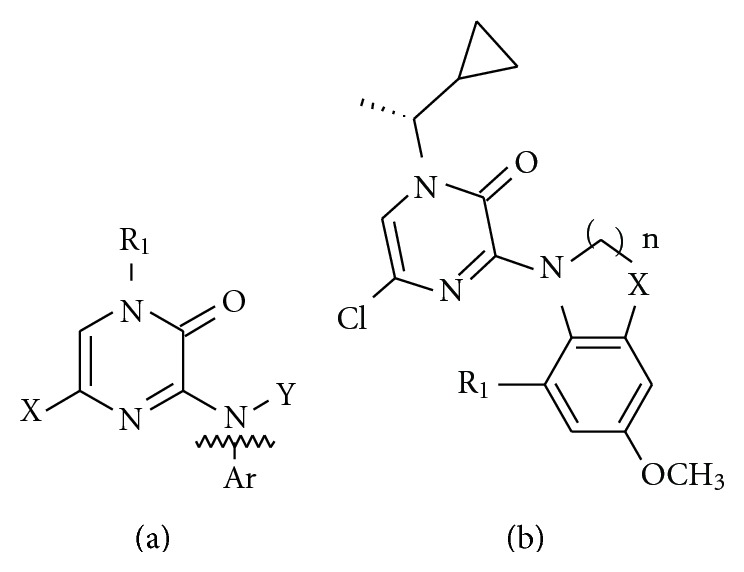
Basic structures of N3-phenylpyrazinones.
Table 1.
Various substituents attached to basic structure of N3-phenylpyrazinones.
|
2.2. PHASE Methodology
The 3D-QSAR studies were carried out using PHASE [8–10] version 3.0 implemented in the Maestro 8.5 molecular modeling package from Schrodinger, Molecular Modeling Interface Inc., LLC, New York, NY USA. Phase is a versatile product for pharmacophore perception, structure alignment, activity prediction, and 3D database searching. Phase provides support for lead discovery, SAR development, lead optimization, and lead expansion. Phase may also be used as a source of molecular alignments for third-party 3D-QSAR programs. Phase is well suited to drug discovery projects for which no receptor structure is available. Phase utilizes fine-grained conformational sampling and a range of scoring techniques to identify common pharmacophore hypotheses, which convey characteristics of 3D chemical structures that are purported to be critical for binding. A given hypothesis may be combined with known activity data to create 3D-QSAR models that identify overall aspects of molecular structure that govern activity. These models may be used in conjunction with the hypothesis to mine a 3D database for molecules that are most likely to exhibit strong activity toward the target [11].
2.3. Preparing Ligands
LigPrep [12] was used to attach hydrogen, converts 2D structures to 3D, generates stereoisomer, and, optionally, neutralizes charged structures or determines the most probable ionization state at user-defined pH. All the structures were ionized at neutral pH 7. Conformers for each ligand were generated using ConfGen by applying OPLS-2005 force field method [13, 14] with implicit GB/SA distance-dependent dielectric solvent model at cutoff root mean square deviation (RMSD) of 1 (MacroModel 9.6 2010) with 1,000 iterations using water as solvent.
2.4. Pharmacophore Hypothesis Generation
PHASE can identify the spatial arrangements of functional groups that are common and essential for the biological activity of the ligands under investigation [10, 15]. The most dominating features, hydrogen bond acceptor (A), hydrogen bond donor (D), hydrophobic group (H), and negatively charged group (N) were defined by a set of chemical structural patterns with the requirement that all five match. Pharmacophore-matching tolerance was set to 1 A°. Hypotheses were generated by a systematic variation of number of sites and the number of matching active compounds. Common pharmacophore hypotheses (CPH) were considered, which indicated at least five sites common to all molecules. Further, the best CPH was selected depending on the survival score, until at least one hypothesis was found and scored successfully. The hypotheses were scored using default parameters for site, vector, volume, selectivity, number of matches, and energy terms. The regression analysis was performed by constructing a series of models with an increasing number of PLS factors. Pharmacophore-based 3D-QSAR models were generated for the hypotheses using the 35 member training set with three PLS factors and a grid spacing of 1 A°. The evaluation of generated CPHs was performed by correlating the observed and the estimated activity for the training set of 35 molecules. PLS analyses were performed in which a series of models were constructed with an increasing number of PLS factors. Score hypotheses step was employed to align the actives to the hypotheses and calculate the score for the actives. CPHs of significant statistical values were selected for molecular alignments.
2.5. Validation of Pharmacophore Model
For accurate and reliable predictions of biological activities of new compounds, the main target was to develop QSAR models, which were statistically robust both internally as well as externally. The data set was divided into a training set and a test set as external validation is considered to be a conclusive proof for judging predictability of a model. The training set was used to generate pharmacophore model and prediction of the activity of test set was used as a method to validate the proposed models. The robustness of the developed pharmacophore hypotheses was internally validated by statistical parameters, that is, squared correlation coefficient (R 2) and variance ratio (F). Validation is a crucial aspect of pharmacophore design, particularly when the model is built for the purpose of predicting activities of molecules in external test series [16]. In the present case, the developed pharmacophore model was externally validated by predicting the activity of test set molecules. The correlation between the experimental and predicted activities of the test set molecules was determined.
3. Results and Discussion
CRF 1 receptor antagonists may offer therapeutic potential for the treatment of diseases resulting from elevated levels of CRF 1 such as anxiety and depression. Efforts to identify structurally diverse CRF 1 receptor antagonists led to the discovery of pyrazinone-based compounds and it was found that CRF 1 receptor binding affinity was improved when the branching point was on the carbon atom bonded directly to the pyrazinone ring [6]. Ligand-based drug design relies on knowledge of other molecules that bind to the biological target of interest. These molecules may be used to derive a pharmacophore which defines the minimum necessary structural characteristics a molecule must possess in order to bind to the target [7]. In other words, a model of the biological target is built based on the knowledge of what binds to it and this model in turn may be used to design new molecular entities that interact with the target.
Thirty-five molecules forming the training set were used to develop the pharmacophore models. The pharmacophoric features selected for creating sites were hydrogen bond acceptor (A), hydrogen bond donor (D), hydrophobic region (H), and aromatic ring (R). Pharmacophore models containing four to six features were generated. The four and five featured pharmacophore hypotheses were rejected due to low value of survival score (less than 2.5), as they were unable to define the complete binding space of the selected molecules. Six featured pharmacophore hypotheses were selected and subjected to stringent scoring function analysis.
The results of six featured pharmacophore hypotheses, labeled AADHHR.47, ADHHHR.203, DHHHRR.611, and AAHHHR.19, are presented in Table 2. The first hypothesis AADHHR.47 is the best hypothesis in this study, characterized by highest survival score (2.980) and best regression coefficient (0.803).
Table 2.
Parameters of six featured pharmacophore hypothesis.
| Serial number | Hypothesis | Survival score | R 2 | F |
|---|---|---|---|---|
| 1 | AADHHR.47 | 2.980 | 0.803 | 138.5 |
| 2 | ADHHHR.203 | 2.892 | 0.789 | 129.7 |
| 3 | DHHHRR.611 | 2.863 | 0.7565 | 105.6 |
| 4 | AAHHHR.19 | 2.700 | 0.7747 | 118.1 |
The pharmacophore hypothesis AADHHR.47 is presented in Figure 2. The features represented by this hypothesis are two hydrogen bond acceptors (A), one hydrogen bond donor (D), two hydrophobic regions (H), and one aromatic ring (R). The distances and angles between different sites of AADHHR.47 are given in Tables 3 and 4, respectively.
Figure 2.
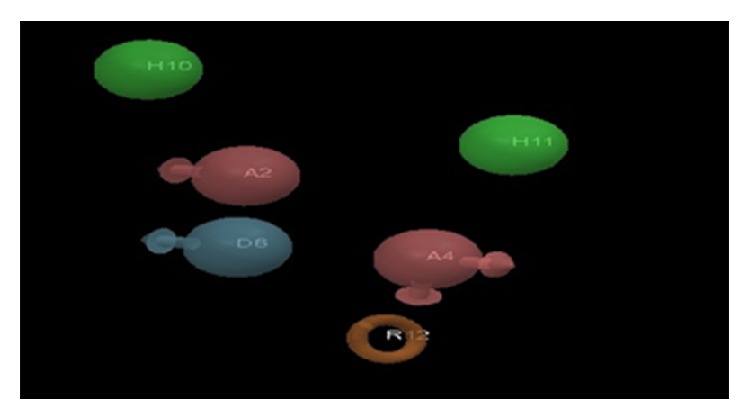
PHASE-generated pharmacophore model AADHHR.47 illustrating hydrogen bond acceptor (A2, A4; pink), hydrogen bond donor (D6; blue), hydrophobic region (H10, H11; green), and aromatic ring (R12; orange) features with distances (in Å) between different sites of AADHHR.47.
Table 3.
Distances between different sites of model AADHHR.47.
| Site-1 | Site-2 | Distances (A°) | Site-1 | Site-2 | Distances (A°) |
|---|---|---|---|---|---|
| A2 | A4 | 3.572 | A4 | R12 | 3.474 |
| A2 | D6 | 2.520 | D6 | H10 | 5.541 |
| A2 | H10 | 3.291 | D6 | H11 | 6.688 |
| A2 | H11 | 4.947 | D6 | R12 | 3.243 |
| A2 | R12 | 5.054 | H10 | H11 | 5.984 |
| A4 | D6 | 3.850 | H10 | R12 | 8.343 |
| A4 | H10 | 6.431 | H11 | R12 | 7.161 |
| A4 | H11 | 3.802 |
Table 4.
Angles between different sites of model AADHHR.47.
| Site-1 | Site-2 | Site-3 | Angle (°) | Site-1 | Site-2 | Site-3 | Angle (°) |
|---|---|---|---|---|---|---|---|
| A4 | A2 | D6 | 76.2 | A2 | H10 | A4 | 21.3 |
| A4 | A2 | H10 | 139.1 | A2 | H10 | D6 | 15.3 |
| A4 | A2 | H11 | 49.9 | A2 | H10 | H11 | 55.8 |
| A4 | A2 | R12 | 43.4 | A2 | H10 | R12 | 1.5 |
| D6 | A2 | H10 | 144.6 | A4 | H10 | D6 | 36.6 |
| D6 | A2 | H11 | 123.9 | A4 | H10 | H11 | 35.4 |
| D6 | A2 | R12 | 32.9 | A4 | H10 | R12 | 22.8 |
| H10 | A2 | H11 | 90.9 | D6 | H10 | H11 | 70.8 |
| H10 | A2 | R12 | 177.5 | D6 | H10 | R12 | 13.8 |
| H11 | A2 | R12 | 91.4 | H11 | H10 | R12 | 57.2 |
| A2 | A2 | D6 | 39.5 | A2 | H11 | A4 | 45.9 |
| A2 | A4 | H10 | 19.6 | A2 | H11 | D6 | 18.2 |
| A2 | A4 | H11 | 84.2 | A2 | H11 | H10 | 33.4 |
| A2 | A4 | R12 | 91.7 | A2 | H11 | R12 | 44.9 |
| D6 | A4 | H10 | 59.0 | A4 | H11 | D6 | 29.3 |
| D6 | A4 | H11 | 121.9 | A4 | H11 | H10 | 78.7 |
| D6 | A4 | R12 | 52.3 | A4 | H11 | R12 | 9.7 |
| H10 | A4 | H11 | 65.9 | D6 | H11 | H10 | 51.5 |
| H10 | A4 | R12 | 111.2 | D6 | H11 | R12 | 26.8 |
| H11 | A4 | R12 | 159.6 | H10 | H11 | R12 | 78.2 |
| A2 | D6 | A4 | 64.3 | A2 | R12 | A4 | 44.9 |
| A2 | D6 | H10 | 20.1 | A2 | R12 | D6 | 25.0 |
| A2 | D6 | H11 | 37.9 | A2 | R12 | H10 | 1.0 |
| A2 | D6 | R12 | 122.1 | A2 | R12 | H11 | 43.7 |
| A4 | D6 | H10 | 84.4 | A4 | R12 | D6 | 69.8 |
| A4 | D6 | H11 | 28.9 | A4 | R12 | H10 | 45.9 |
| A4 | D6 | R12 | 57.9 | A4 | R12 | H11 | 10.7 |
| H10 | D6 | H11 | 57.7 | D6 | R12 | H10 | 24.0 |
| H10 | D6 | R12 | 142.2 | D6 | R12 | H11 | 68.4 |
| H11 | D6 | R12 | 84.7 | H10 | R12 | H11 | 44.6 |
For each ligand, one aligned conformer based on the lowest RMSE of feature atom coordinates from those of the corresponding reference feature was superimposed on AADHHR.47. The fitness scores for all ligands were observed on the best scored pharmacophore model AADHHR.47. The greater the fitness score, the greater the activity prediction of the compound. The fit function does not only check if the feature is mapped or not but also contains a distance term, which measures the distance that separates the feature on the molecule from the centroid of the hypothesis feature.
Table 5 shows the fitness score for all the molecules of training set. Figure 3 shows the AADHHR.47 aligned with ligand having maximum fitness score, that is, molecule 48 of the training set. Beside this survival score analysis, another validation method to characterize the quality of AADHHR.47 is represented by its capacity for correct activity prediction of training set molecules.
Table 5.
Experimental and predicted IC50 values of training set molecules based on hypothesis AADHHR.47.
| Comp. No. | Experimental activity (IC50) | Predicted activity (IC50) | Fitness score | Comp. No. | Experimental activity (IC50) | Predicted activity (IC50) | Fitness score |
|---|---|---|---|---|---|---|---|
| 1. | 7.409 | 8.2 | 1.96 | 24 | 9.376 | 8.88 | 2.37 |
| 2. | 8.685 | 9.02 | 2.14 | 25 | 8.89 | 9.25 | 1.29 |
| 5. | 8.856 | 9.12 | 2.26 | 27 | 9.275 | 9.45 | 1.31 |
| 6. | 8.98 | 9.22 | 1.67 | 28 | 8.032 | 8.32 | 1.46 |
| 7. | 8.85 | 9.13 | 1.90 | 29 | 6.745 | 7.156 | 1.33 |
| 9. | 7.796 | 8.14 | 2.01 | 31 | 8.62 | 8.61 | 1.37 |
| 10. | 7.585 | 8.22 | 1.56 | 32 | 9.284 | 9.05 | 1.43 |
| 11. | 6.041 | 7.15 | 1.10 | 34 | 6.041 | 7.44 | 1.31 |
| 13. | 8.89 | 9.18 | 1.89 | 35 | 6.553 | 8.68 | 1.55 |
| 15. | 9.376 | 9.22 | 2.48 | 37 | 8.62 | 9.18 | 2.08 |
| 16. | 9.585 | 9.74 | 1.66 | 38 | 8.959 | 8.57 | 2.00 |
| 17. | 9.285 | 9.27 | 1.75 | 40 | 9.207 | 9.56 | 1.92 |
| 18. | 8.88 | 9.01 | 2.03 | 44 | 8.745 | 9.18 | 2.68 |
| 19. | 8.74 | 8.82 | 2.01 | 46 | 8.421 | 8.44 | 2.60 |
| 20. | 8.77 | 8.89 | 1.79 | 47 | 8.174 | 8.25 | 2.59 |
| 21. | 9.568 | 9.45 | 1.43 | 48 | 8.252 | 8.46 | 3.00 |
| 22. | 9.212 | 9.22 | 2.35 | 50 | 5.921 | 7.32 | 1.08 |
| 23. | 8.42 | 9.16 | 1.25 |
Figure 3.
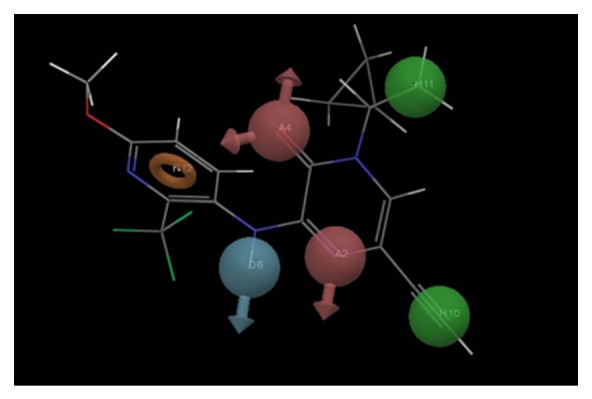
Best pharmacophore model AADHHR.47 aligned with molecule 48. Pharmacophore features are color coded: 2 hydrogen bond acceptors (A2, A4; pink), 1 hydrogen bond donor (D6; blue), 2 hydrophobic regions (H10, H11; green), and 1 aromatic ring (R12; orange).
The predicted CRF 1 antagonistic activity of training set molecule exhibited R 2 value of 0.803 (RMSD = 0.618) with experimental CRF 1 antagonistic activity using model AADHHR.47 (Figure 4). The validity and predictive character of AADHHR.47 was further assessed by using the test set prediction.
Figure 4.

Relation between experimental and predicted CRF 1 antagonistic activity values of training set (a) and test set molecules (b) using model AADHHR.47.
The test set having fifteen molecules was analyzed. All the test set molecules were built and minimized as well as used in conformational analysis like all training set molecules. Then the activities of test set molecules were predicted using AADHHR.47 and compared with the actual activity. Actual and predicted activity values of test set molecules are given in Table 6.
Table 6.
Experimental and predicted IC50 values of test set molecules based on hypothesis AADHHR.47.
| Comp. No. | Experimental activity (IC50) | Predicted activity (IC50) | Fitness score | Comp. no. | Experimental activity (IC50) | Predicted activity (IC50) | Fitness score |
|---|---|---|---|---|---|---|---|
| 3. | 8.620 | 8.68 | 1.99 | 36 | 8.824 | 9.23 | 1.95 |
| 4. | 9.200 | 9.10 | 2.23 | 39 | 7.469 | 7.42 | 1.89 |
| 8. | 7.921 | 8.15 | 2.01 | 41 | 9.026 | 9.07 | 1.81 |
| 12. | 9.096 | 9.02 | 2.27 | 42 | 7.722 | 8.41 | 1.94 |
| 14. | 9.568 | 9.19 | 2.23 | 43 | 6.824 | 7.12 | 2.51 |
| 26. | 8.236 | 8.42 | 2.21 | 45 | 8.921 | 9.11 | 0.87 |
| 30. | 8.181 | 8.13 | 1.18 | 49 | 6.744 | 7.14 | 2.61 |
| 33. | 8.824 | 9.20 | 1.75 |
The predicted CRF 1 antagonistic activity of test molecule exhibited R 2 value of 0.91 (RMSD = 0.2961) with experimental CRF 1 antagonistic activity using model AADHHR.47 (Figure 4). For a reliable model, the squared predictive correlation coefficient should exceed 0.60 [17, 18]. The results of this study reveal that model AADHHR.47 can be used for the prediction of CRF 1 antagonistic activity.
3.1. 3D QSAR Analysis
Additional insight into the CRF 1 antagonistic activity can be gained by visualizing the 3D QSAR model in the context of one or more ligands in the series with varying activity. This information can then be used to design new or more active analogues. 3D QSAR model based on the molecules of training and test set using various features, that is, hydrogen bond acceptor (A), hydrogen bond donor (D), hydrophobic regions (H), and aromatic ring (R) has been studied.
3.1.1. Hydrogen Bond Donor Field Predictions
The 3D QSAR model based on molecule 48 of the training set using hydrogen bond donor feature is shown in Figure 5(a). Red region near and around the meta- and parahydrogen of pyridine ring substituted at position 3 through NH terminal indicates that the substitutions at these positions by groups having more hydrogen bond donor property favor the CRF 1 antagonistic activity. Green region around the double bond between C5 and C6 on pyridine ring, NH terminal connecting pyrazinone and pyridine ring, methoxy group at C4 on pyridine ring, indicates that substitutions at these positions by groups having hydrogen bond donor property do not favor CRF 1 antagonistic activity.
Figure 5.

3-D QSAR model based on molecule 48 of training set illustrating hydrogen bond donor feature (a), hydrogen bond acceptor feature (b) and hydrophobicity feature (c).
3.1.2. Hydrogen Bond Acceptor Field Predictions
The 3D QSAR model based on molecule 48 of the training set using hydrogen bond acceptor feature is shown in Figure 5(b). Red region around N1, carbonyl group at C2 and in between C2 and C3, double bond between C5 and C6 (all 3 on pyrazinone ring), indicates that the substitutions at these positions by groups having more hydrogen bond acceptor property favour the CRF 1 antagonistic activity. Green region around C5 on pyrazinone ring, NH terminal and methoxy group on pyridine ring, indicates that the substitutions at these positions by groups having more hydrogen bond acceptor property do not favour the CRF 1 antagonistic activity.
3.1.3. Hydrophobicity Field Prediction
The 3D QSAR model based on molecule 48 of the training set using hydrophobicity feature is shown in Figure 5(c). Green region around ethynyl group substituted at position 5, at C6 (both on pyrazinone ring), double bond between C5 and C6, methoxy group at C4 (both on pyridine ring), indicates that the substitutions at these positions by groups having more hydrophobicity favour CRF 1 antagonistic activity and substitutions at these positions by more hydrophobic groups will result in increase in CRF 1 antagonistic activity. Blue region around methyl substituent of N1, position 4 (both on pyrazinone ring), methoxy group at C4 on pyridine ring, indicates that groups having more hydrophobic property do not favour CRF 1 antagonistic activity.
4. Conclusions
This study shows the generation of a pharmacophore model AADHHR.47 for N3 phenylprazinones acting as CRF 1 antagonists. Pharmacophore modelling correlates activities with the spatial arrangement of various chemical features. The first hypothesis AADHHR.47 is the best hypothesis in this study, characterized by the best regression coefficient (0.803), degree of freedom (138.5), and highest survival score (2.980). Hypothesis AADHHR.47 represents the best pharmacophore model for determining CRF 1 antagonistic activity. AADHHR.47 consists of two hydrogen bond acceptors, one hydrogen bond donor, two hydrophobic regions, and one aromatic ring features. AADHHR.47 model had strong correlation between experimental and estimated activity of the training (R 2 = 0.803) and test (R 2 = 0.91) set molecules. Thus, AADHHR.47 pharmacophore model was able to accurately predict CRF 1 antagonistic activity, and the validation results also provide additional confidence in the proposed pharmacophore model. The obtained results suggested that the proposed 3D-QSAR model AADHHR.47 can be useful to rationally design new N3-phenylprazinones molecules as CRF 1 antagonists and also to identify new promising molecules as CRF 1 antagonists in large 3D database of molecules.
References
- 1.Dimatteo M. R., Lepper H. S., Croghan T. W. Depression is a risk factor for noncompliance with medical treatment meta-analysis of the effects of anxiety and depression on patient adherence. Archives of Internal Medicine. 2000;160(14):2101–2107. doi: 10.1001/archinte.160.14.2101. [DOI] [PubMed] [Google Scholar]
- 2.Beevers C. G. Cognitive vulnerability to depression: a dual process model. Clinical Psychology Review. 2005;25(7):975–1002. doi: 10.1016/j.cpr.2005.03.003. [DOI] [PubMed] [Google Scholar]
- 3.Zorrilla E. P., Koob G. F. Progress in corticotropin-releasing factor-1 antagonist development. Drug Discovery Today. 2010;15(9-10):371–383. doi: 10.1016/j.drudis.2010.02.011. [DOI] [PMC free article] [PubMed] [Google Scholar]
- 4.Hartz R. A., Ahuja V. T., Schmitz W. D., et al. Synthesis and structure-activity relationships of N3-pyridylpyrazinones as corticotropin-releasing factor-1 (CRF1) receptor antagonists. Bioorganic and Medicinal Chemistry Letters. 2010;20(6):1890–1894. doi: 10.1016/j.bmcl.2010.01.129. [DOI] [PubMed] [Google Scholar]
- 5.Han X., Pin S. S., Burris K., et al. Synthesis and structure-activity relationship of imidazo[1,2-a] benzimidazoles as corticotropin-releasing factor 1 receptor antagonists. Bioorganic & Medicinal Chemistry Letters. 2005;15(18):4029–4032. doi: 10.1016/j.bmcl.2005.06.028. [DOI] [PubMed] [Google Scholar]
- 6.Hartz R. A., Ahuja V. T., Arvanitis A. G., et al. Synthesis, structure-activity relationships, and in vivo evaluation of N3-phenylpyrazinones as novel corticotropin-releasing factor-1 (CRF1) receptor antagonists. Journal of Medicinal Chemistry. 2009;52(14):4173–4191. doi: 10.1021/jm900301y. [DOI] [PubMed] [Google Scholar]
- 7.Guner O. F. Pharmacophore Perception, Development and Use in Drug Design. San Diego, Calif, USA: International University Line; 2000. [Google Scholar]
- 8. PHASE, Version 3.0, Schrödinger, LLC, New York, NY, USA, 2008.
- 9.Dixon S. L., Smondyrev A. M., Knoll E. H., Rao S. N., Shaw D. E., Friesner R. A. PHASE: a new engine for pharmacophore perception, 3D QSAR model development, and 3D database screening—1. Methodology and preliminary results. Journal of Computer-Aided Molecular Design. 2006;20(10-11):647–671. doi: 10.1007/s10822-006-9087-6. [DOI] [PubMed] [Google Scholar]
- 10.Dixon S. L., Smondyrev A. M., Rao S. N. PHASE: a novel approach to pharmacophore modeling and 3D database searching. Chemical Biology and Drug Design. 2006;67(5):370–372. doi: 10.1111/j.1747-0285.2006.00384.x. [DOI] [PubMed] [Google Scholar]
- 11.Maestro. Version 8.5, Schrödinger, LLC, New York, NY, USA, 2008.
- 12. Ligprep 2.0, Schrodinger, LLC, New York, NY, USA, 2010.
- 13.Kaminski G. A., Friesner R. A., Tirado-Rives J., Jorgensen W. L. Evaluation and reparametrization of the OPLS-AA force field for proteins via comparison with accurate quantum chemical calculations on peptides. Journal of Physical Chemistry B. 2001;105(28):6474–6487. doi: 10.1021/jp003919d. [DOI] [Google Scholar]
- 14.Amnerkar N. D., Bhusari K. P. Synthesis, anticonvulsant activity and 3D-QSAR study of some prop-2-eneamido and 1-acetyl-pyrazolin derivatives of aminobenzothiazole. European Journal of Medicinal Chemistry. 2010;45(1):149–159. doi: 10.1016/j.ejmech.2009.09.037. [DOI] [PubMed] [Google Scholar]
- 15.Evans D. A., Doman T. N., Thorner D. A., Bodkin M. J. 3D QSAR methods: phase and catalyst compared. Journal of Chemical Information and Modeling. 2007;47(3):1248–1257. doi: 10.1021/ci7000082. [DOI] [PubMed] [Google Scholar]
- 16.Boyd B. D. Reviews in Computational Chemistry. Vol. 4. New York, NY, USA: VCH; 1990. Successes of computer-assisted molecular design; pp. 355–371. [Google Scholar]
- 17.Dureja H., Kumar V., Gupta S., Madan A. K. Topochemical models for the prediction of lipophilicity of 1,3-disubstituted propan-2-one analogs. Journal of Theoretical and Computational Chemistry. 2007;6(3):435–448. doi: 10.1142/S021963360700309X. [DOI] [Google Scholar]
- 18.Wold S. Validation of QSAR’s. Quantitative Structure-Activity Relationships. 1991;10(3):191–193. [Google Scholar]