Abstract
Prostate cancer (PCa) is the most common non-cutaneous malignancy among men in the United States and the second leading cause of cancer-related death. Multi-parametric magnetic resonance imaging (mpMRI) has gained recent popularity to characterize PCa. Acoustic Radiation Force Impulse (ARFI) imaging has the potential to aid PCa diagnosis and management by using tissue stiffness to evaluate prostate zonal anatomy and lesions. MR and B-mode/ARFI in vivo imaging datasets were compared with one another and with gross pathology measurements made immediately after radical prostatectomy. Images were manually segmented in 3D Slicer to delineate the central gland (CG) and prostate capsule, and 3D models were rendered to evaluate zonal anatomy dimensions and volumes. Both imaging modalities showed good correlation between estimated organ volume and gross pathologic weights. Ultrasound and MR total prostate volumes were well correlated (R2 = 0.77), but B-mode images yielded prostate volumes that were larger (16.82% ± 22.45%) than MR images, due to overestimation of the lateral dimension (18.4% ± 13.9%), with less significant differences in the other dimensions (7.4% ± 17.6%, anterior-to-posterior, and −10.8% ± 13.9%, apex-to-base). ARFI and MR CG volumes were also well correlated (R2 = 0.85). CG volume differences were attributed to ARFI underestimation of the apex-to-base axis (−28.8% ± 9.4%) and ARFI overestimation of the lateral dimension (21.5% ± 14.3%). B-mode/ARFI imaging yielded prostate volumes and dimensions that were well correlated with MR T2-weighted image (T2WI) estimates, with biases in the lateral dimension due to poor contrast caused by extraprostatic fat. B-mode combined with ARFI imaging is a promising low-cost, portable, real-time modality that can complement mpMRI for PCa diagnosis, treatment planning, and management.
Keywords: ARFI imaging, MR imaging, prostate, image segmentation, visualization, tissue modeling, elasticity
Introduction
Prostate cancer (PCa) is the most common non-cutaneous malignancy among men in the United States and the second leading cause of cancer-related death.1 Approximately 1 in every 6 men will develop PCa during their lifetime, with the median age of diagnosis at 67 years old.1 PCa is also the second leading cause of cancer-related death, with 1 in 36 men dying from the disease. The National Cancer Institute (NCI) estimates that 238,590 men will be diagnosed with PCa in 2013 and 29,720 will die from the disease.1
PCa diagnosis usually begins by screening with a prostate-specific antigen (PSA) test and digital rectal examination (DRE). More definitive diagnosis can be made by random transrectal ultrasound (TRUS)-guided biopsies, which are then used to provide the clinician with the proper Gleason score. The combination of these factors, as well as staging, determines the appropriate therapy and prognosis.
PCa screening has led to earlier diagnosis of smaller tumors and more localized disease; however, it is well known that the sensitivity and specificity of PSA and DRE are not optimal. In addition, DRE has a low predictive value at lower PSA ranges, and PSA yields many false positives.2–4 As such, a theoretical risk of over-diagnosis and treatment of low-grade, and possibly clinically insignificant, disease exists. Moreover, due to the random nature of TRUS-guided systematic biopsies, PCa located outside the routine sampling sites can be missed, and the extent of the cancer might be underestimated.3,5 For example, in a study by Mufarrij et al., 45.9% to 47.2% of patients who were candidates for active surveillance, but underwent radical prostatectomy, had a higher Gleason score on final histopathology than after TRUS biopsy.6 These inaccuracies may lead to missed diagnoses, imprecise risk assessment, and potentially avoidable morbidity.
The use of non-invasive prostate imaging could lead to improved PCa diagnosis, risk-stratification, and management. Magnetic resonance imaging (MRI) has been available for use in the workup of patients with PCa since the early 1980s, but early studies on its diagnostic accuracy were heterogeneous. The more recent ability to include functional parameters in PCa MRI analysis has yielded promising results.3,4 Among the MRI sequences currently used in the study of PCa, it is well established that T2-Weighted Imaging (T2WI) offers the best assessment of prostate anatomy based on its ability to delineate prostatic margins, distinguish internal structures, and differentiate among the glandular zones.
Acoustic Radiation Force Impulse (ARFI) imaging is an ultrasound-based modality that evaluates the mechanical properties of tissues.7 ARFI imaging has the potential to aid in PCa diagnosis and management by evaluating the structural composition of prostate zones and tumors based on their stiffness contrast. Zhai et al. were able to visualize prostatic anatomy by using ARFI imaging in freshly excised prostates.9 In a second study, Zhai et al. demonstrated the feasibility of ARFI prostate imaging in vivo8; however, to the authors’ best knowledge, there have been no studies to date that compare in vivo ARFI prostate imaging with other imaging modalities.
The goal of this study is to evaluate the ability of B-mode/ARFI imaging to delineate prostate zonal anatomy, specifically central gland (CG) and total prostate gland in vivo as compared with T2WI MR at 3T using an endorectal coil. Similar work has been done with other ultrasonic imaging modalities that strive to characterize the viscoelastic properties of the prostate in comparison with MR imaging, as has been done by Mahdavi et al.,10 where vibro-elastography has been developed to visualize and segment the prostate in synergy with B-mode ultrasound, with MRI used as the imaging gold standard. The “Background” section of this manuscript provides an overview of MR and ARFI imaging in the prostate and an overall clinical motivation for prostate imaging. The “Method” section describes the methods used to experimentally acquire our imaging data, process the gross pathological specimens post radical prostatectomy, and image process our datasets. The results of our analysis, including gross pathology and imaging prostate axis and volume estimates, are presented in the “Results” section, along with a statistical analysis of the bias and variability associated with each imaging modalities measurement, all of which is discussed in the “Discussion” section.
Background
Prostate Anatomy
The prostate gland sits caudal to the urinary bladder and surrounds the urethra. Its superior borders include the bladder and seminal vesicles, and the urogenital diaphragm delineates its inferior boundary. The gland is bordered anteriorly by the pubic symphysis and posteriorly by the rectum. The prostate is separated from the rectum by a 2–3 mm fascial layer,11 and it can be easily palpated on rectal examination.
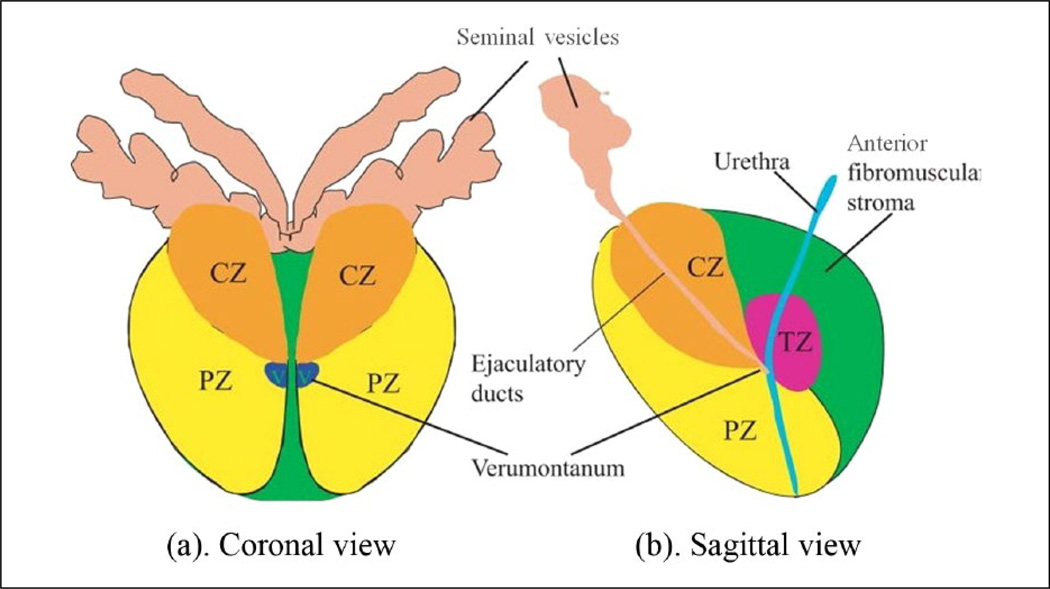
The prostate gland can be divided from superior-to-inferior into the base, mid-gland, and apex. The urethra enters the prostate proximally at the base and extends to the mid-gland, at which point the ejaculatory ducts open into the urethra at the verumontanum.11 The urethra then continues past the apex and travels through the penis. The prostate can be divided into glandular and non-glandular components. The glandular components include the transitional zone (TZ), central zone (CZ), and peripheral zone (PZ) (Figure 1). In the healthy prostate, each zone contains approximately 5%, 20%, and 70%–80% of glandular tissue, respectively,12 but these ratios can change significantly in the presence of benign prostatic hyperplasia (BPH). The non-glandular components include the anterior fibromuscular stroma (AFS) and the urethra. In some imaging modalities, the central and transition zones cannot be visualized as discrete entities, and they are collectively identified as the CG. The CG was one of the prostate structures manually segmented in MR and ARFI images in this study.
Figure 1.
Diagrams of McNeal’s zonal anatomy of the human prostate.13 It divides a human prostate into one non-glandular zone (the anterior fibromuscular stroma) and three glandular zones: central zone, peripheral zone, and transition zone, denoted by CZ, PZ, and TZ, respectively. (a) Coronal section of the prostate. V represents the verumontanum. (b) Sagittal section of the prostate. In the top part of the diagram, the seminal vesicles and ductus deferens enter the central zone and connect to the ejaculatory ducts, which merge with the urethra at the verumontanum. (Figure reprinted with permission.23) CZ = central zone; PZ = peripheral zone; TZ = transitional zone.
An outer band of fibromuscular tissue surrounds the anterior aspect of the prostate.12 This boundary is important when assessing the extraprostatic extension of cancer as tumor can spread by disrupting this tissue. Two neurovascular bundles are posterior and lateral to the prostate, which can also be invaded by malignant cells. The prostate capsule is another structure that was manually segmented in both MR and ultrasound images in this study, and its overall extent was used to delineate the total prostate gland.
MR Imaging in Prostate Diagnostics
MR imaging has been available for use in the workup of patients with PCa since the early 1980s, but the early work on its diagnostic accuracy is heterogeneous due to heavy reliance on morphology via T1- and T2-weighted imaging (T2WI). More recent abilities to include not only anatomic but also biologic and functional dynamic parameters into MR analysis via diffusion-weighted imaging (DWI), dynamic contrast-enhanced (DCE) imaging, or MR spectroscopic imaging (MRSI) are promising in the future diagnosis and characterization of PCa.
Currently, prostate MR focuses on a multiparametric approach, where two or more imaging sequences, including anatomic and functional data, are used together to make a diagnosis.14 As MR technology continues to evolve and improve, its role in PCa diagnosis, staging, treatment planning, and follow-up has gained much attention.
T2-Weighted imaging and prostate anatomy
T2WI sequences are crucial components of prostate MR imaging. T2WI is particularly useful in prostate analysis due to its excellent soft tissue contrast resolution, which can be maximized by using thin sections of 3–4 mm and a small field of view of approximately 14 cm2.3,12 T2 sequences are the most helpful for tumor localization, as they can clearly show overall prostate morphology, internal structures, and prostatic margins.3
The prostate can be divided into glandular and non-glandular components. The glandular components include the PZ and the CG, which are typically easily distinguishable on T2WI. Other anatomical markers such as the urethra, verumontanum, and ejaculatory ducts are also often seen on T2WI.
Approximately 70% of the prostatic tissue is found in the PZ, which is high in water content, and thus has higher signal intensity in T2WI.11 In all, 75% of prostatic tumors are found in the PZ and normally show hypointense T2 signal when compared with the higher intensity PZ4,15; however, tumors can sometimes have similar intensity as the surrounding tissue and false positives can occur secondary to post-biopsy changes/hemorrhage, hyperplasia or prostatitis, making diagnosis more challenging.15
Functional MR sequences
Even though T2WI is the mainstay of prostate MR, its overall performance in PCa diagnosis is not optimal. The incorporation of two or more functional sequences in multiparametric MR imaging (mpMRI) has been shown to significantly improve the performance of MRI in cancer diagnosis.16 The European Society of Urogenital Radiology (ESUR) prostate MR guidelines recommend at least two functional imaging techniques, in addition to T2WI, to better characterize prostate tumors.14 In a study by Turkbey et al., researchers found that mpMRI had a PCa detection positive predictive value of 98%.16
ARFI Imaging
Acoustic radiation force-based elasticity imaging has recently been developed for investigation of mechanical properties of human soft tissues, including liver, arteries, heart, prostate, breast, and cervix.17–26 The acoustic radiation force F⃗ generated in soft tissues by focused ultrasound can be described by,27,28
| (1) |
where α is the acoustic attenuation coefficient of the tissue, c is the tissue’s sound speed, and I⃗ is the acoustic intensity at a given point in space. The acoustic radiation force is generated by a transfer of momentum from the propagating acoustic wave to the propagation medium through attenuation mechanisms, such as absorption and scattering of the ultrasonic wave. In these studies, the acoustic attenuation and sound speed of the prostate tissue were assumed to be constant and not vary as a function of the zonal anatomy, meaning that all displacement differences seen in the prostate would be assumed to be stiffness-related after normalizing for depth-dependent focal gain.
Method
Study Inclusion Criteria
Patients undergoing radical prostatectomy for biopsy-proven PCa treatment were enrolled as study subjects in this Institutional Review Board (IRB)-approved (Duke IRB# Pro00006458), Health Insurance Portability and Accountability Act (HIPAA)-compliant study, with all enrolled patients providing written informed consent. A total of 16 patients were recruited and enrolled in this study. Inclusion criteria included undergoing complete pelvic MRI with endorectal coil for detection of PCa, with multiplanar T2-weighted anatomic imaging, as well as pre-operative ARFI imaging and radical prostatectomy. Patients with previous treatments of PCa or BPH, or anatomic anomalies of the rectum, were excluded from this study.
Pathology Processing
Prostates were radically removed using a da Vinci Surgical System (Intuitive Surgical®, Inc., Sunnyvale, California). After excision, the prostates were weighed and tri-axially measured, formalin fixed for at least 24 hours without being cut, and then processed for whole-mount histology. While tri-axial measurements of the gross prostate were not necessarily anatomically aligned, rough estimates of the prostate volume were made using a tri-axial, ellipsoidal organ volume assumption, where the volume could be estimated as follows:
| (2) |
where A represents the eigenvector matrix of the tri-axial pathology measurements.
An alternative approach to estimating the prostate volume would have been to reconstruct the prostate capsule from serial whole-mount histology slides of the prostate. This approach, however, was not chosen because the formalin fixation process can cause 0%–25% contraction of the tissue,29 the ~3 mm slice thickness introduces error, and tearing/folding of tissue on the whole-mount slides introduces additional artifacts that need to be compensated for in the volume estimation process. Finally, differences in the tissue orientation on each whole-mount slide would require an image registration process to align all the slides, introducing another source of error in the process.
MR Imaging
All MR imaging was performed on one of two 3.0 Tesla MR scanners (General Electric HDx, GE Healthcare, Waukesha, Wisconsin; Siemens Skyra, Siemens Healthcare, Erlangan, Germany) using a single channel Medrad eCoil endorectal coil (Medrad, Indianola, Pennsylvania), as well as multi-channel surface coils. Imaging sequences included thin-section (3 mm section thickness) fast spin echo T2-weighted images in the coronal, axial, and sagittal planes. Diffusion weighted images (DWI) were obtained using multiple b-values, and calculation of Apparent Diffusion Coefficient (ADC) maps was also performed. Dynamic contrast-enhanced MR (DCE-MRI) sequences were obtained after administration of a weight-based dose of extracellular MR contrast agent (Magenvist®, Bayer Pharma AG) with 4–5 second temporal resolution for 5–6 minutes. While the DWI and DCE-MRI images were used in conjunction with the T2W images for lesion characterization, the DWI and DCE-MRI images were lower resolution than the T2WI and did not augment the T2WI information for the purposes of delineating prostate anatomy.
B-Mode/ARFI Imaging
Experimental B-mode and ARFI imaging data were acquired using a modified Siemens Acuson SC2000 ultrasound scanner (Siemens Healthcare, Ultrasound Business Unit, Mountain View, California, USA) and the side-fire array of an Acuson ER7B endorectal transducer. The ARFI imaging sequence was comprised of standard B-mode ultrasonic imaging, or tracking beams, and pushing beams. For each lateral location, two pre-push reference images were acquired; then three 300-cycle pushing pulses were transmitted in rapid succession, focused at 30 mm, 22.5 mm, and 15 mm, respectively; and finally the response of the tissue was tracked for up to 6 ms at a pulse repetition frequency (PRF) of 8 kHz. This pushing strategy is similar to what has been published by Bercoff et al.30 The 30 mm and 22.5 mm foci pushing pulses were transmitted at 4.6 MHz with a F/2 geometry, and the 15 mm focus pushing pulse was transmitted at 5.4 MHz with a F/2.35 geometry to maintain the same beamwidth (0.67 mm) throughout the region of excitation. A total of 82 lateral locations were interrogated to cover the 55 mm field of view, translating 0.67 mm laterally per location.
For the tracking pulses, 16 parallel receive lines at 5.0 MHz were spaced to observe the response of the tissue to the pushing pulses. Specifically, four lines were dedicated to tracking the on-axis displacement, with all four beams located inside the beamwidth of the pushing pulses such that the tracking beam spacing was 0.17 mm. The tracking beams were focused at 60 mm with F/3 transmit and F/0.5 receive focal configurations.
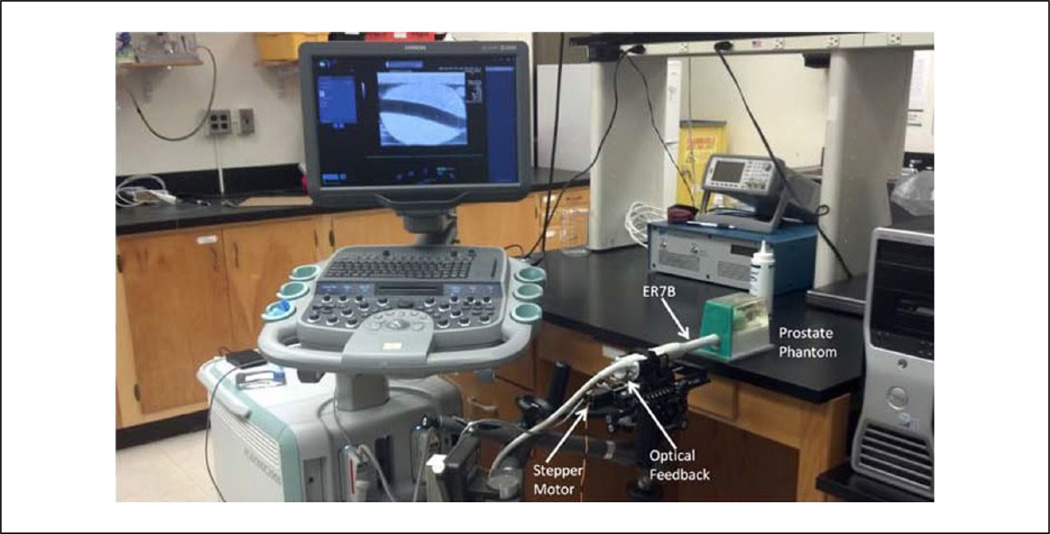
3D volumetric imaging data were acquired endorectally using mechanical rotation of the ER7B transducer between sequential imaging frames, sweeping across the lateral extent of the prostate. This rotation setup used a CIVCO Micro-Touch™ stabilizer (CIVCO Medical Solutions, Kalona, Iowa, USA) that allows for complete 6-axis degrees of freedom for manual positioning of the transducer to sweep through the entire prostate during imaging. Sequential imaging frames were ~1° apart, depending on the absolute size of the prostate. A custom optical angular feedback transduction circuit using a reflective linear strip with 212 lines-per-inch (LPI) resolution (US Digital, Vancouver, Washington, USA) with a QSB-S Quadrature-to-USB adapter was used to achieve 9 line/degree resolution. Rotation was performed with a 141 oz-in torque stepper motor with planetary gearbox (Model 11YPG202S-LW4-R27, Anaheim Automation, Anaheim, California, USA) (Figure 2) to achieve accurate spatial localization of the imaging frames in the 3D dataset.
Figure 2.
The experimental setup used for B-mode/ARFI imaging in the operating suite, including the Siemens SC2000 scanner with the ER7B endorectal transducer sitting in a custom cradle of a CIVCO Micro-Touch stabilizer with optical feedback controlling a stepper motor to acquire 3D ultrasound imaging data. Custom-written Python code was run on the scanner to trigger B-mode and ARFI imaging acquisition sequences relative to completed rotation increments of ~1°. ARFI = Acoustic Radiation Force Impulse.
Displacement estimation was performed using a phase-shift estimator on the beamformed inphase and quadrature (IQ) data.31,32 The ARFI data were normalized as a function of depth to account for attenuation and focal gain effects to ensure that ARFI image brightness differences were more directly related to stiffness differences. This normalization was performed using displacement profiles measured in two homogeneous, elastic tissue-mimicking phantoms (CIRS, Norfolk, Virginia) with Young’s modulus of 10.0 kPa and acoustic attenuations of 0.49 and 0.72 dB/cm/MHz, respectively. The mean displacement profiles from each phantom were averaged together to achieve a mean attenuation of 0.6 dB/cm/MHz, which is within the measured range of attenuation in healthy peripheral zone prostate tissue.33 This mean displacement profile was low-pass filtered with a cutoff frequency of 0.8/mm and applied to all displacements in the entire dataset at each time step.
The normalized displacement data were scan-converted using a 2D Delaunay triangulation interpolation method in Matlab (R2012b, The MathWorks, Inc, Natick, Massachusetts, USA) for each lateral location in the dataset. The scan-converted ARFI imaging data had a final isotropic voxel size of 0.15 × 0.15 × 0.15 mm3.
Image Zonal Anatomy Segmentation and 3D Model Rendering
MR image segmentation and modeling
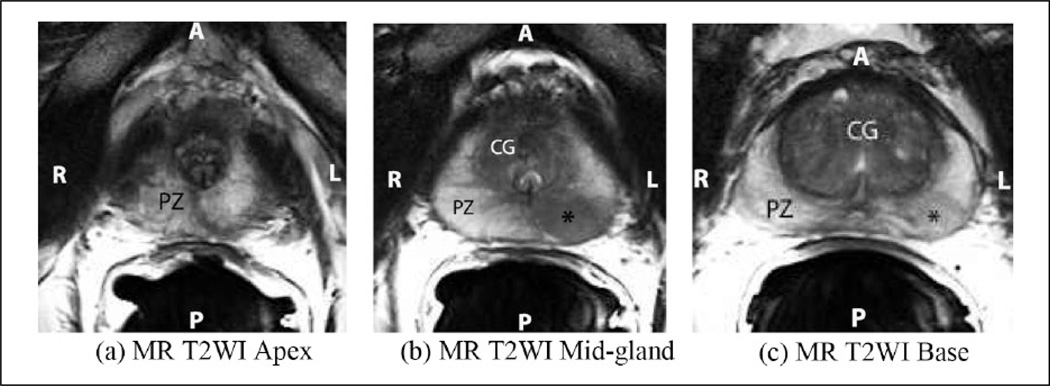
Axial MR T2WI images were manually segmented by a single radiologist (C.K.) using the smooth polygon tool in ITK-SNAP (http://www.itksnap.org),34 using unique labels for the PZ, CG, and AFS. The gland was segmented from base to apex. The base was identified below the bladder, and subsequent images were segmented until the last slice with visible prostatic tissue was identified caudally. The CG, urethra, PZ, and AFS were segmented independently according to their well-established anatomical characteristics on T2WI.4,11,12,14,35 The PZ was identified by its homogeneous high signal intensity on T2WI, which is usually similar to that of the nearby extraprostatic fat. The CG was visualized and delineated based on its heterogeneous, lower signal intensity and its location (Figure 3). The urethra was included in the CG segmentation. When visible, the AFS was identified by its low T2 signal intensity and its location anterior to the CG. All MR image segmentations were ultimately reviewed by an experienced prostate radiologist (R.T.G.).
Figure 3.
Axial T2-weighted MR images of the prostate show the apex (a), mid-gland (b), and base (c). The peripheral zone (PZ) is of higher signal intensity than the central gland (CG), the latter composed of the central zone and the transitional zone. The apex (a) is composed mostly of PZ glandular tissue and the urethra is seen at the level of the mid-gland as an inverted “U” (b). Note the area of hypointense signal in the peripheral zone at the mid-gland and base (asterisk, b and c), which represents a prostatic tumor. The posterior (P) aspect of the prostate is adjacent to the endorectal coil, and the right (R)-to-left (L) extent of the prostate is referred to as the lateral-to-lateral axis in the subsequent analysis. MR = magnetic resonance; T2WI = T2-weighted image.
Segmented image stacks were imported into 3D Slicer (http://www.slicer.org, v4.3.0),36 and 3D models were rendered using the parameters in Table 1.
Table 1.
3D Model Volume Rendering Parameters.
| Parameter | Value |
|---|---|
| Decimation | 0.1 |
| Smoothing Algorithm | Laplacian |
| Smoothing | 70.0 |
| Joint Smoothing | Enabled |
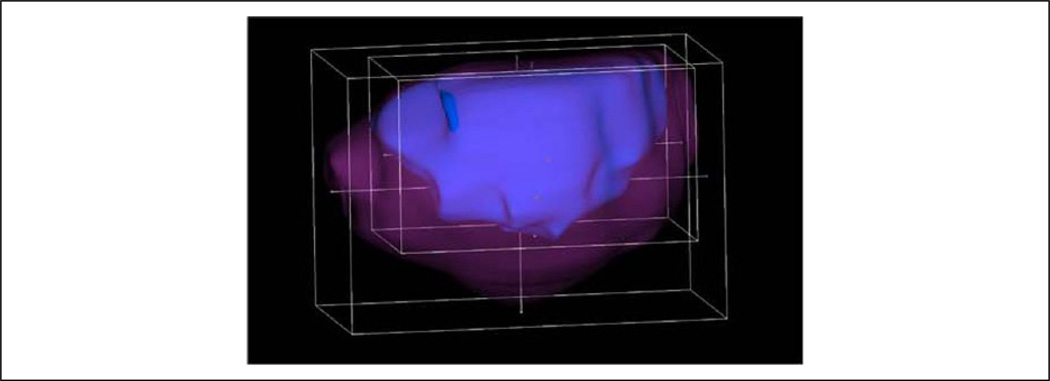
The 3D models were used to render volume estimates of the PZ and CG, with the sum of PZ and CG representing the total prostate gland volume. AFS volume estimates in select MR cases were included in the total prostate gland volume estimates. Orthogonal tri-axial measurements in the lateral-to-lateral, apex-to-base, and anterior-to-posterior dimensions were made in 3D Slicer by placing a region-of-interest (ROI) cube in the model’s center and expanding the ROI cube to fit the maximal model dimensions (Figure 4).
Figure 4.
An example of the 3D Slicer ROI tool surrounding the prostate capsule (magenta) and central gland (blue) of study subject. This ROI tool is used to find the tri-axial dimensions of the prostate, in both the ultrasound and MR image datasets. MR = magnetic resonance.
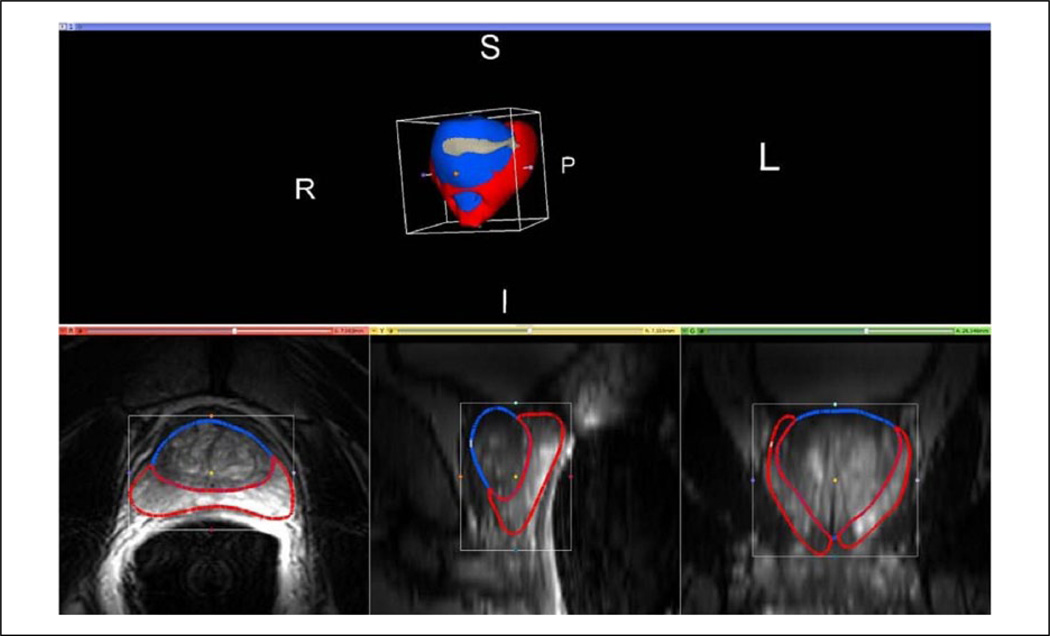
Figure 3 shows the anatomic zones and some anatomic orientation labels in the prostate of a representative study subject MR T2WI. The zonal anatomy of the prostate was manually segmented (Figure 5, bottom left) across the image stack, and 3D models of the zonal anatomy volumes were rendered (Figure 5, top).
Figure 5.
Representative MR T2WI segmentations and rendered volume performed in 3D Slicer, with the peripheral zone (PZ) being delineated in red, the central gland (CG) being delineated in blue, and the anterior fibromuscular stroma (AFS) being shown in gray. The AFS was combined with the PZ for quantitative analyses shown herein. The native imaging plane for segmentation is the axial view, shown in the bottom left image. The bottom middle and right images show the projections of the rendered model segment outlines in the sagittal and coronal views, respectively. 3D view of the rendered volume shows anatomical markers for patient left (L), right (R), superior (S), inferior (I), and posterior (P). MR = magnetic resonance; T2WI = T2-weighted image.
Ultrasound image segmentation and modeling
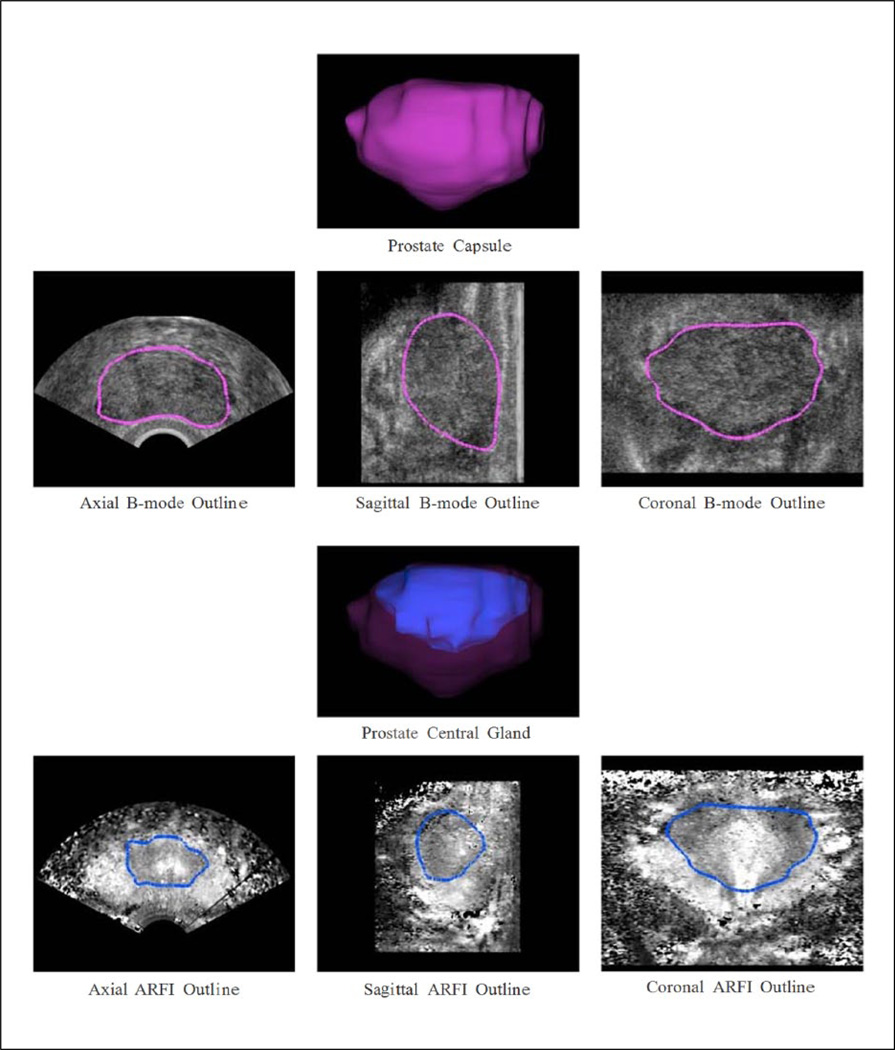
Sagittal B-mode and ARFI ultrasound image stacks were segmented in 3D Slicer by two researchers (T.J.G. and Z.A.M.) using the draweffect tool to model and measure the prostate capsule and CG volume and tri-axial dimensions (Figure 6). Since both B-mode and ARFI imaging data were acquired concurrently using the same probe and sequences, the datasets are perfectly spatially co-registered and could be loaded concurrently into 3D Slicer in the same voxel space, achieving perfect spatial registration of segmentations using both B-mode and ARFI image features. The sagittal imaging plane was chosen for segmentation because it has a greater number of easily identifiable anatomical structures: seminal vesicles in the left and right posterior base, urethra in the mid apex, surrounding fibromuscular tissue in the anterior, and rectum in the posterior. Prostate capsules were segmented in B-mode images instead of ARFI images because the B-mode images provided high image contrast between prostatic tissue and surrounding extraprostatic fat, and better signal-to-noise ratio (SNR) in the anterior capsule region. ARFI images were used for CG segmentation due to their better contrast over B-mode images. Prior to segmentation, both the B-mode and ARFI image stacks were down-sampled along the sagittal axis to a slice thickness of 3 mm to reduce the number of manually segmented frames (18 vs. 360 slices/image stack) and match the MRI slice thickness.
Figure 6.
Representative ultrasound prostate models from this study. Top rows: Prostate capsule 3D model (magenta) rendered from manual segmentation of the B-mode images, with the 3D model outlines superimposed on the central axial, sagittal, and coronal B-mode images. The primary segmentation plane was sagittal; however, the axial and coronal planes were used to guide the segmentation to ensure 3D continuity of the capsule structure. Bottom rows: Prostate central gland 3D model (blue) inside the prostate capsule 3D model (magenta) rendered from manual segmentation of the ARFI images, with the prostate central gland 3D model outlines superimposed on the central axial, sagittal, and coronal ARFI images. The coronal ARFI imaging plane was the primary orientation used for image segmentation, but like capsule segmentation, the orthogonal planes were used to ensure continuity of the central gland in all three dimensions. ARFI = Acoustic Radiation Force Impulse.
While segmentations were performed along the sagittal plane, label map intersections in the axial and coronal views were used during active creation of the sagittal segmentation to further improve segmentation accuracy. Parameters used for 3D model rendering were identical to those used for MR modeling (Table 1). The modeled capsule helped guide the CG segmentation by enabling capsule model intersections in the three orthogonal planes during CG segmentation (Figure 6). The capsule provided an outer boundary for the CG segmentation. The capsule and CG models dimensions were then measured using the same procedure as the MR images. All B-mode and ARFI image segmentations were reviewed by two experienced ARFI imaging researchers (M.L.P. and K.R.N.).
Results
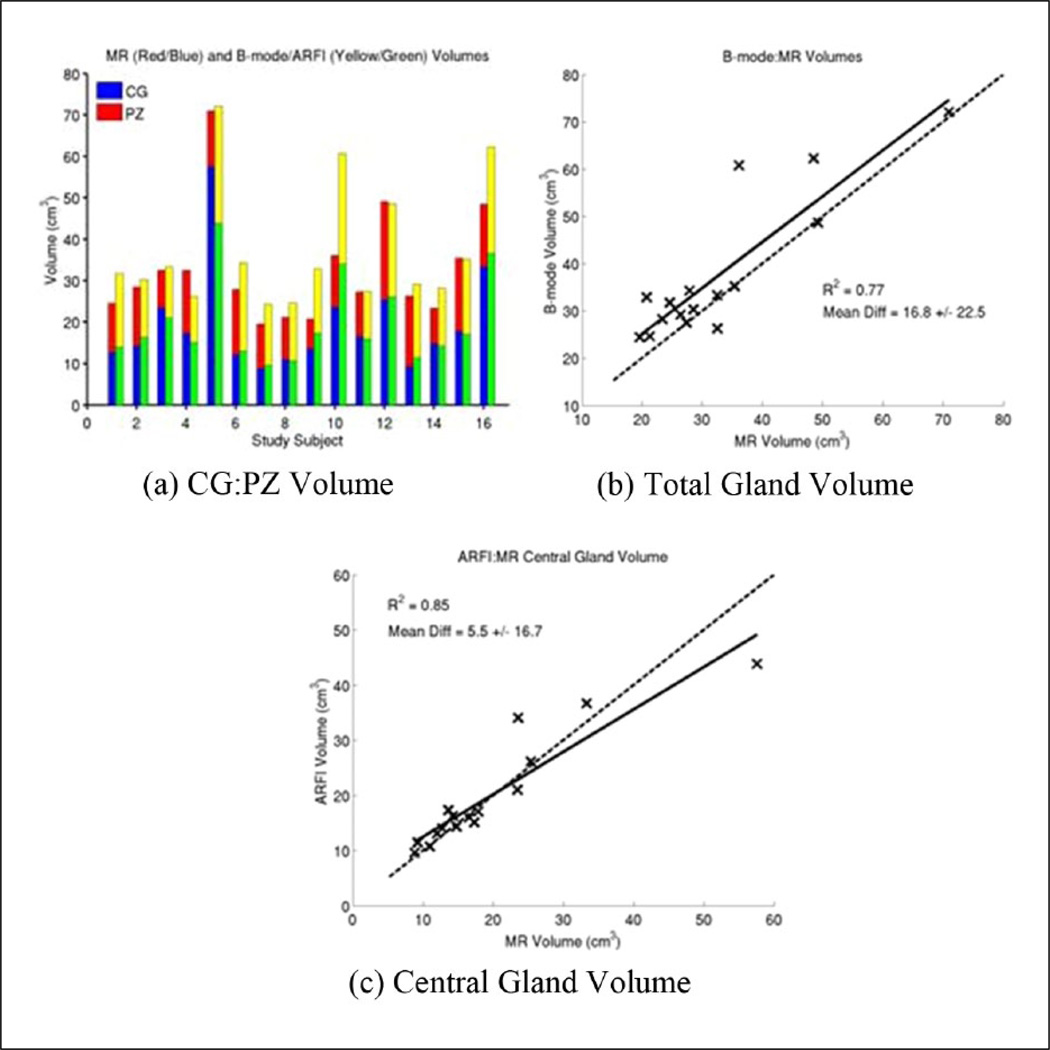
The subvolumes associated with the zonal anatomy in each imaging modality were measured (Figure 7(a)), with good correlation between the ultrasound and MR total prostate gland volumes (R2 = 0.77), with a mean overestimation of 16.82% ± 22.45% by ultrasound imaging compared with MR volumes (Figure 7(b)). Central gland volumes were well correlated between ARFI and MR images (R2 = 0.85) with no significant mean over-/under-estimation (5.46% ± 16.75%), but significant variability between the cases (Figure 7(c)). Table A1 of the appendix has the individually measured volumes for MR and B-mode/ARFI imaging for each study subject.
Figure 7.
Comparison of MR and B-mode/ARFI zonal anatomy volume estimates from manually segmented images. Total prostate gland volumes ranged from 19.6 to 71.0 cm3 based on MR image models (a), with good correlation between MR and ultrasound imaging for both the total gland volume (R2 = 0.77, (b)) and the central gland (R2 = 0.85, (c)). The B-mode total gland volumes had a positive bias compared with the MR volumes (16.82% ± 22.45% (b)), while the ARFI central gland volumes were on average more similar (5.46% ± 16.75%, (c)), but with some significant variability between study subjects. Table A1 of the appendix contains the individual volume estimates for the total prostate and central glands. MR = magnetic resonance; CG = Central gland; PZ = peripheral zone; ARFI = Acoustic Radiation Force Impulse.
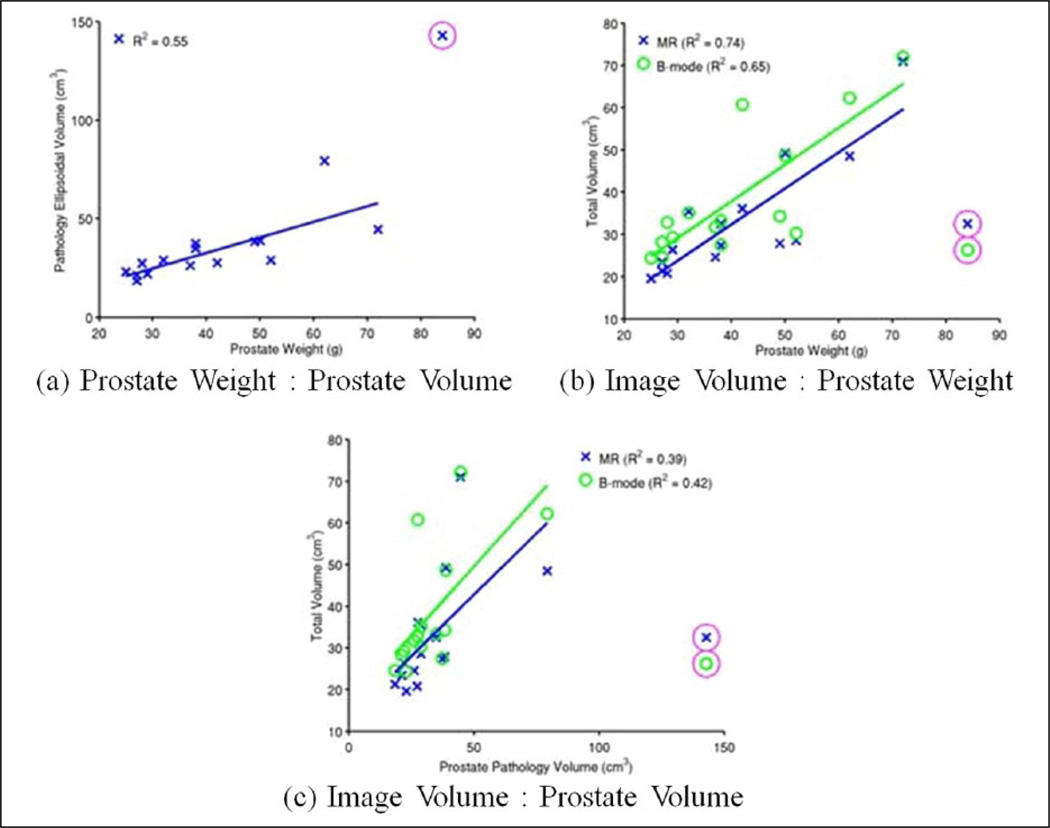
Weights and axis measurements from the gross pathology processing of the excised prostates were collected (Table A2 of the appendix), and using the axis measurements (lateral-to-lateral, anterior-to-posterior, and apex-to-base), the prostate volume was approximated as a tri-axial ellipsoid, and its volume was estimated (2). Prostate weights were moderately correlated with estimated pathology ellipsoidal prostate volumes (Figure 8(a), R2 = 0.55). There was moderate correlation between the prostate weight and the image-reconstructed prostate volumes (Figure 8(b), R2 = 0.74 (MR) and 0.65 (B-mode)), though there was weaker correlation with the ellipsoidal approximation of the measurement prostate volume and the image-reconstructed volumes (Figure 8(c), R2 = 0.39 (MR) and 0.42 (B-mode)).
Figure 8.
Tri-axial pathology measurements were used to make an ellipsoidal prostate volume approximation based on gross pathology axis measurements, which was moderately well correlated with the excised prostate weights (R2 = 0.55) (a). T2WI MR (blue, X) showed a moderate correlation between the reconstructed volumes and prostate weight (R2 = 0.74), while volumes reconstructed from B-mode images (green, O) showed weaker correlation (R2 = 0.65) (b). Weaker correlations existed between both T2WI MR and B-mode image volumes and approximated ellipsoidal prostate pathology volumes (R2 = 0.39 and 0.42, respectively) (c). There was one pathology specimen that had an erroneous prostate volume and weight recorded, which has been excluded from the linear regressions (magenta circles). MR = magnetic resonance; T2WI = T2-weighted image.
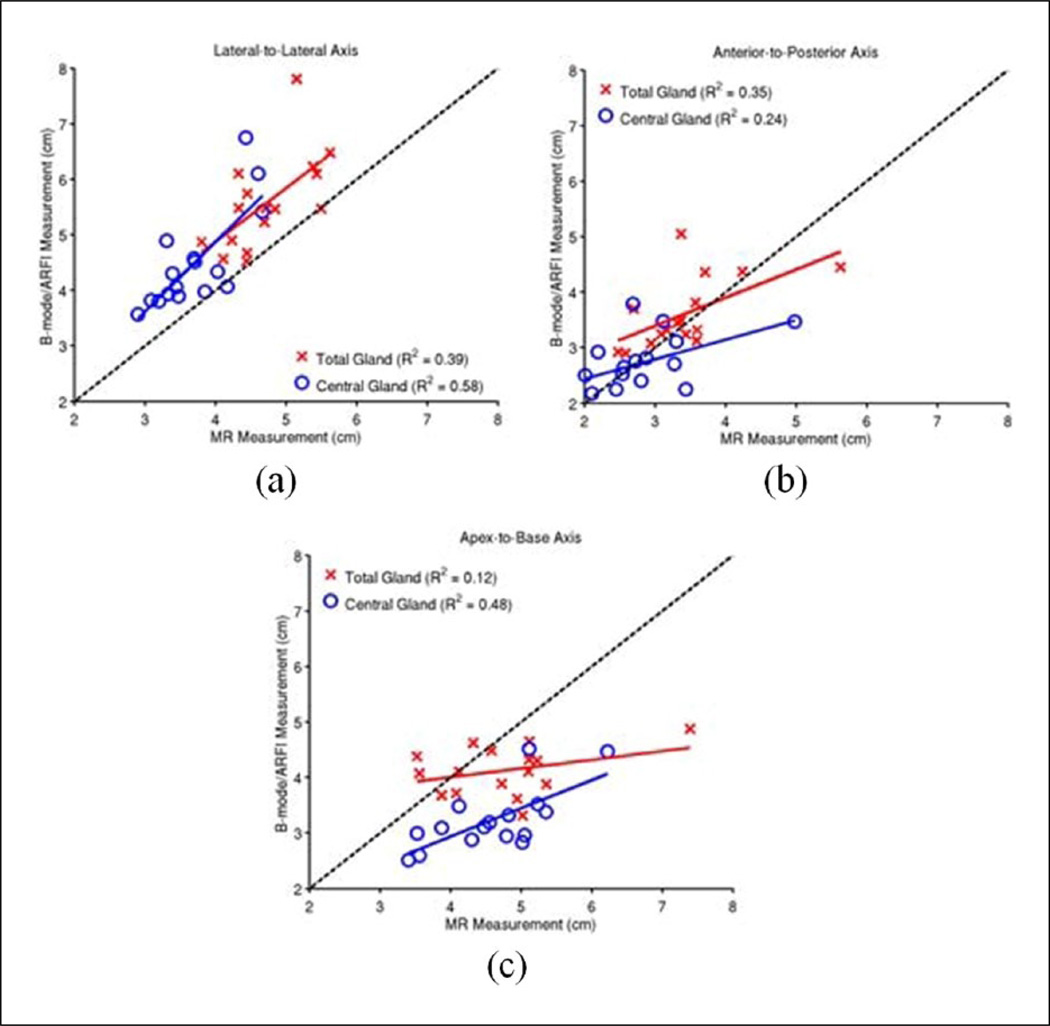
Measurements of the prostate total gland and CG dimensions along the three standard anatomic axes (apex-to-base, lateral-to-lateral, and anterior-to-posterior) were made (Table A3 of the appendix), and the correlation between the imaging axis measurements was analyzed (Figure 9). Ultrasound images were most correlated to MR in the lateral-to-lateral axis in both the total gland B-mode and CG (ARFI) (R2 = 0.39 and 0.58, respectively), with mean overestimates of 18.4% ± 13.9% and 21.5% ± 14.3%, respectively (Table 2). Ultrasound images had moderate correlation with the total prostate gland (B-mode) and CG (ARFI) axes in the anterior-to-posterior dimension (R2 = 0.35 and 0.24), respectively, with differences of 7.4% ± 17.6% and −0.6% ± 20.8%. The ultrasound images had weak correlation with MR images in the apex-to-base dimension (R2 = 0.12, total gland and R2 = 0.48, CG), with underestimates of −10.8% ± 16.8% and −28.8% ± 9.4%, respectively.
Figure 9.
Measurements of the prostate dimensions along the three standard anatomic axes: lateral-tolateral (a), anterior-to-posterior (b), and apex-to-base (c). The correlation between the MR and B-mode/ARFI imaging axis measurements was performed in each orientation for the total gland (red crosses) and central gland (blue circles). B-mode images were used for total gland measurements, and ARFI images were for central gland measurements. The black dashed-line represents the projection of perfectly correlated measurements between imaging and pathology. The over-/under-estimation of each imaging modality relative to gross pathology and each other is summarized in Table 2. MR = magnetic resonance; ARFI = Acoustic Radiation Force Impulse.
Table 2.
Difference in B-mode/ARFI Imaging Axis Measurements Relative to MR T2WI Measurements.
| B-mode: MR | ARFI: MR | |
|---|---|---|
| Total Gland (%) | Central Gland (%) | |
| Lateral-to-lateral | 18.4 ± 13.9 | 21.5 ± 14.3 |
| Anterior-to-posterior | 7.4 ± 17.6 | −0.6 ± 20.8 |
| Apex-to-base | −10.8 ± 16.8 | −28.8 ± 9.4 |
ARFI = Acoustic Radiation Force Impulse; MR = magnetic resonance; T2WI = T2-weighted image.
Discussion
B-Mode/ARFI and MR T2WI Agreement
This study demonstrated that B-mode/ARFI imaging delineates zonal anatomy of the prostate well when compared with MR T2WI with only slight overestimation of B-mode total and ARFI CG volume (Figure 7). Establishing accurate delineation of the prostate’s zonal anatomy is important because PCa has strong correlations with location in the prostate, specifically in the peripheral zone, and accurate capsule delineation will facilitate future efforts to register 3D imaging datasets between ARFI and MR imaging.
We did not expect perfect agreement between MR and ultrasound imaging volumes or tri-axial dimensions because each modality applies a different amount of external compression to the rectal wall, which results in different degrees of prostate deformation. The endorectal coil used in MRI places pressure on the prostate that is dependent on the patient’s anatomy and overall prostate size, while the pressure on the prostate during TRUS imaging is modulated by the urologist when the transducer rotation apparatus is locked into position prior to imaging. The differential prostate deformation during TRUS imaging can be easily visualized during the transducer alignment process. It was our goal to apply as little pressure while still maintaining uniform contact throughout the ultrasound image acquisition. This is critical because poor acoustic coupling to the prostate through the rectal wall can greatly diminish ARFI image displacement SNR.
The lateral boundaries of the prostate in the ultrasound dataset were overestimated relative to MR T2WI, increasing B-mode total volume relative to MR. The lateral overestimation was a result of poor contrast between the PZ and extraprostatic fat in the B-mode images, and image decimation along the lateral dimension in both ARFI and B-mode images. Without image decimation, the elevation and axial orthogonal planes can be used to correct errors introduced by the poor contrast between the PZ and extraprostatic fat. However, with image decimation, segmentation changes in the elevation, and axial orthogonal planes were limited to the lower bound on the model precision of, again, ~3 mm. While reduced decimation could improve the precision of the lateral measurements, this would have introduced significant overhead in the manual segmentation process, with diminishing returns given the spatial smoothing of the modeling algorithms that were used.
The first-order limiting parameters in our ultrasound spatial resolution to segment capsules and CGs were (a) the scan-conversion of our native radial ultrasound imaging planes to yield uniform 3D voxels of B-mode and ARFI imaging data and (b) the decimation of imaging volume datasets for manual segmentation. The scan-conversion interpolation artifact is worse at deeper depths, where native image data are more sparsely available. For these reasons, neither the native imaging plane resolution of B-mode nor ARFI imaging is considered a limiting factor in the total and CG measurements presented in this work.
The anterior aspect of the prostate can also be challenging to delineate, especially in large prostates, where SNR decreases with increasing depth away from our rectal wall imaging surface and MR images suffer from gland heterogeneity in this region,3 though we had good agreement between ultrasound and MR T2W images in the anterior-to-posterior dimension (Figure 9(b), Table 2).
B-mode/ARFI imaging consistently underestimated the extent of the prostate capsule and CG apex-to-base dimension relative to MR T2WI (Figure 9(c), Table 2). In fact, it is likely the degree of B-mode/ARFI underestimation relative to the actual apex-to-base prostate length is even greater than suggested by the MR comparison as this was the dimension with the worst spatial resolution in MR imaging, with a typical MR T2WI slice thickness of ~3 mm for these studies. While higher-resolution MR images could be obtained and analyzed for more precise comparisons in this imaging dimension, such data were not available for this study.
Limitations
This study has several limitations that should be considered when interpreting these results. Gross pathology weight and axis measurements could both be affected by the presence of extraprostatic tissue that was excised during radical prostatectomy, especially in cases where more aggressive margins may have been necessary; however, we still believe that these weights and measurements represent the best estimation of in vivo characteristics. For this reason, unlike the image-to-image measurement comparisons, all of the image metrics presented relative to pathology metrics (Figure 8) were not characterized for absolute accuracy, but instead, relative correlations were evaluated. In addition, the volumes of the prostate from gross pathologic measurements were approximated as ellipsoids, which also introduced error, most likely an overestimation of volume. Interestingly, all pathology estimates were thought to have positive biases, but both imaging modalities tended to overestimate volume relative to the pathology measurements.
It should also be noted that all of the prostates in this study contained varying amounts of PCa, BPH, and atrophy, all of which can distort the zonal anatomy, especially in the case of BPH and CG morphology. While younger, healthier prostates could have been targeted, these healthy organs would not have been excised for pathology characterization, and the zonal anatomy of a healthy (young) prostate is expected to be different from the prostate of a middle-age and older man, who is the target demographic for PCa screening imaging and PCa characterization.
This study did not evaluate user biases in image segmentation. While MR zonal anatomy delineation has some establishment in the clinical literature, this study is the first attempt to define the criteria for ARFI imaging zonal anatomy characteristics, and it is expected that such delineations will continue to be refined as we acquire more cases and continue to compare with MRI and pathology data. Given this limitation, no attempts were made to further quantify reader-to-reader variability in this work.
Future Directions
Future directions for our research include deeper analysis of our findings, especially the lateral dimension overestimation, to improve our anatomic delineation and assess further its clinical impact. Technological improvements to improve anterior prostate boundary delineation in both B-mode and ARFI imaging are also being pursued for better visualization in this region. 3D models of the prostate and CGs will be used across ARFI and MR imaging datasets to spatially register them to facilitate correlation of regions of PCa suspicion between the two modalities, and to correlate with whole-mount histology of the excised prostate specimens. Diffeomorphic image registration techniques using these 3D capsules will be used to accommodate the different prostate deformations associated with each imaging modality, allowing for a more direct, voxel-to-voxel comparison of the different imaging modalities and how they may complement each other. These efforts for improved imaging performance and multi-modality image registration will allow for the quantification of sensitivity and specificity of a combined MR/B-mode/ARFI imaging system for PCa detection and characterization. In addition, we will be pursuing quantitative measurement of the pressure being applied during imaging to help reduce prostate deformation and reduce the impact of prostate stiffness non-linearity in our displacement images. While ARFI imaging of the prostate is a constantly evolving technology, the fact that one can view the different prostatic zones on ARFI images in addition to MRI is encouraging and could lead to targeted diagnostic biopsies and therapies with real-time imaging for men with PCa.
Conclusion
The delineation of prostate zonal anatomy in B-mode/ARFI images has been compared with the established methods for identifying zonal anatomy using MR T2W images. Both imaging modalities showed moderate correlations between estimated organ volume and gross pathologic weights, and B-mode:MR total prostate gland volumes were well correlated (R2 = 0.77), but ARFI images yielded prostate volumes that were, on average, larger (16.82% ± 22.45%) than MR images, primarily due to overestimation of the lateral dimension of the prostate total gland (18.4% ± 13.9%), while differences in the other dimensions were less significant contributors (7.4% ± 17.6% and −10.8% ± 16.8%). The CG volumes of ARFI and MR images were also well correlated (R2= 0.85), with minimal volume bias between the imaging modalities, but significant variability case-to-case (5.46% ± 16.75%). Central gland volume differences were, again, strongly attributed to overestimation of the lateral dimension (21.5% ± 14.3%), with a significant underestimation of the apex-to-base dimension (−0.6% ± 20.8%). Strong variability in CG volumes is believed to be related to the extent of BPH for select cases. Overall, B-mode/ARFI imaging of the prostate yielded prostate volumes and dimensions that were correlated with MR T2WI estimates, with differences in the lateral and apex-to-base dimensions. Poor image contrast between the prostate and extraprostatic fat may be one cause of these differences. B-mode imaging combined with ARFI imaging is a promising low-cost, real-time imaging modality that can complement MR imaging for diagnosis, treatment planning, and management of PCa.
Acknowledgments
The authors would like to thank Siemens Medical Solution USA, Ultrasound Division, for their in-kind technical support. Special thanks to Ned Danieley for computer system administration support, the pathology assistants in the Duke University Medical Center for their gross prostate organ processing, and Matthew Brown for his assistance in designing the optical prostate rotation feedback system.
Funding
The author(s) disclosed receipt of the following financial support for the research, authorship, and/or publication of this article: This work was supported by NIH R01CA142824 and the Duke Coulter Translational Grant Program.
Appendix
Tables A1–A3 contain the raw measurements in MR T2W imaging, gross pathology, and B-mode/ARFI imaging.
Table A1.
Comparison of Central Gland/Zone and Total Prostate Volumes in MR T2WI and B-mode/ARFI Imaging.
| Study Subject | MR Central Gland Volume (cm3) |
MR Total Volume (cm3) |
ARFI Central Gland Volume (cm3) |
B-mode Total Volume (cm3) |
|---|---|---|---|---|
| 1 | 12.74 | 24.57 | 14.30 | 19.31 |
| 2 | 14.26 | 28.51 | 8.37 | 32.90 |
| 3 | 23.47 | 32.48 | 13.29 | 24.24 |
| 4 | 17.32 | 32.49 | 10.83 | 28.98 |
| 5 | 57.56 | 70.95 | 30.37 | 65.55 |
| 6 | 12.01 | 27.84 | 15.68 | 28.71 |
| 7 | 8.82 | 19.59 | 11.78 | 23.32 |
| 8 | 10.97 | 21.28 | 16.02 | 27.72 |
| 9 | 13.63 | 20.75 | 19.28 | 27.84 |
| 10 | 23.58 | 36.11 | 33.50 | 58.07 |
| 11 | 16.57 | 27.33 | 25.22 | 32.78 |
| 12 | 25.38 | 49.21 | 18.14 | 50.35 |
| 13 | 9.25 | 26.36 | 6.14 | 32.66 |
| 14 | 14.79 | 23.36 | 11.60 | 20.68 |
| 15 | 17.87 | 35.37 | 10.15 | 35.29 |
| 16 | 33.32 | 48.50 | 19.31 | 31.76 |
T2WI = T2-weighted image; ARFI = Acoustic Radiation Force Impulse; MR = magnetic resonance.
Table A2.
Pathology Prostate Gross Specimen Metrics.
| Study Subject | Weight (g) | Lateral- Lateral (cm) |
Anterior- Posterior (cm) |
Apex-Base (cm) | Ellipsoidal Volume (cm3) |
|---|---|---|---|---|---|
| 1 | 37. | 4.3 | 4.0 | 2.9 | 26.10 |
| 2 | 52. | 4.5 | 3.5 | 3.5 | 28.85 |
| 3 | 38. | 4.5 | 4.0 | 3.7 | 34.85 |
| 4 | 84. | 7.0 | 6.5 | 6.0 | 142.87 |
| 5 | 72. | 6.6 | 4.3 | 3.0 | 44.56 |
| 6 | 49. | 4.9 | 4.4 | 3.4 | 38.36 |
| 7 | 25. | 3.7 | 3.7 | 3.2 | 22.93 |
| 8 | 27. | 4.2 | 3.1 | 2.7 | 18.40 |
| 9 | 28. | 4.4 | 3.7 | 3.2 | 27.26 |
| 10 | 42. | 4.7 | 3.5 | 3.2 | 27.55 |
| 11 | 38. | 5.4 | 4.0 | 3.3 | 37.30 |
| 12 | 50. | 5.0 | 4.0 | 3.7 | 38.73 |
| 13 | 29. | 4.0 | 3.5 | 3.0 | 21.98 |
| 14 | 27. | 4.5 | 3.0 | 3.0 | 21.20 |
| 15 | 32. | 4.5 | 3.5 | 3.5 | 28.85 |
| 16 | 62. | 5.5 | 5.3 | 5.2 | 79.33 |
Table A3.
Comparison of Central Gland / Zone (C) and Total (T) Prostate Axes in MR T2WI and B-mode/ARFI Imaging.
| Study Subject |
MR C-AB (cm) |
ARFI C-AB (cm) |
MR C-LL (cm) |
ARFI C-LL (cm) |
MR C-AP (cm) |
ARFI C-AP (cm) |
MR T-AB (cm) |
B-Mode T-AB (cm) |
MR T-LL (cm) |
B-Mode T-LL (cm) |
MR T-AP (cm) |
B-Mode T-AP (cm) |
|---|---|---|---|---|---|---|---|---|---|---|---|---|
| 1 | 4.12 | 4.34 | 2.90 | 3.51 | 2.45 | 2.28 | 4.12 | 4.65 | 3.80 | 3.75 | 3.09 | 3.10 |
| 2 | 3.87 | 4.03 | 3.39 | 3.25 | 2.80 | 1.66 | 3.87 | 4.76 | 4.45 | 5.33 | 3.59 | 3.09 |
| 3 | 4.82 | 4.53 | 3.48 | 3.23 | 3.27 | 2.29 | 5.11 | 3.94 | 4.11 | 4.93 | 3.59 | 3.39 |
| 4 | 5.35 | 3.82 | 3.08 | 2.62 | 2.87 | 2.35 | 5.36 | 4.76 | 4.45 | 5.33 | 3.37 | 3.67 |
| 5 | 6.22 | 5.20 | 4.66 | 5.06 | 4.98 | 4.22 | 7.39 | 5.36 | 5.43 | 6.01 | 5.63 | 4.28 |
| 6 | 5.05 | 4.63 | 3.44 | 3.96 | 3.44 | 2.29 | 5.10 | 4.61 | 4.84 | 4.99 | 3.44 | 2.87 |
| 7 | 4.47 | 4.77 | 3.33 | 3.42 | 2.26 | 2.40 | 4.72 | 4.64 | 4.44 | 4.85 | 2.58 | 3.07 |
| 8 | 4.30 | 5.72 | 3.20 | 4.23 | 2.10 | 2.52 | 4.32 | 4.92 | 4.23 | 4.83 | 2.48 | 2.84 |
| 9 | 3.52 | 4.73 | 3.31 | 4.90 | 2.19 | 2.69 | 3.52 | 4.61 | 4.33 | 4.81 | 2.70 | 3.65 |
| 10 | 5.24 | 5.02 | 4.43 | 7.19 | 2.69 | 2.20 | 5.23 | 5.04 | 5.15 | 7.36 | 3.37 | 4.94 |
| 11 | 5.02 | 4.24 | 3.85 | 4.31 | 2.73 | 2.72 | 5.02 | 4.82 | 5.50 | 5.29 | 3.57 | 4.20 |
| 12 | 4.55 | 4.24 | 3.70 | 4.63 | 3.30 | 2.34 | 4.58 | 5.01 | 5.38 | 6.53 | 4.24 | 4.47 |
| 13 | 3.40 | 2.84 | 4.03 | 3.29 | 2.01 | 1.91 | 4.08 | 4.17 | 4.72 | 5.32 | 2.94 | 3.64 |
| 14 | 3.56 | 5.04 | 3.69 | 4.24 | 2.54 | 3.02 | 3.56 | 4.56 | 4.33 | 5.18 | 3.17 | 2.33 |
| 15 | 4.79 | 5.00 | 4.17 | 3.78 | 2.56 | 3.08 | 4.95 | 5.38 | 4.69 | 4.95 | 3.32 | 3.71 |
| 16 | 5.11 | 4.73 | 4.60 | 4.45 | 3.11 | 3.46 | 5.12 | 4.61 | 5.62 | 6.23 | 3.71 | 3.52 |
Axes are approximated in orientation to match those specified in gross pathology: LL, AP, and AB. MR = magnetic resonance; T2WI = T2-weighted image; ARFI = Acoustic Radiation Force Impulse; LL = lateral-to-lateral; AP = anterior-to-posterior; AB = apex-to-base.
Footnotes
Some of the authors on this manuscript hold intellectual property related to ARFI imaging, and commercial licenses of this technology with Duke University exist.
Declaration of Conflicting Interests
The author(s) declared no potential conflicts of interest with respect to the research, authorship, and/or publication of this article.
References
- 1.Howlader N, Noone AM, Krapcho M, Neyman N, Aminou R, Waldron W. SEER Cancer Statistics Review, 1975–2010. Bethesda, MD: National Cancer Institute; 2013. [accessed June 8, 2013]. Available from: URL: http://seercancergov/csr/1975_2010. [Google Scholar]
- 2.Gosselaar C, Roobol MJ, Roemeling S, van der Kwast TH, Schröder FH. Screening for prostate cancer at low PSA range: the impact of digital rectal examination on tumor incidence and tumor characteristics. Prostate. 2007;67:45–154. doi: 10.1002/pros.20501. [DOI] [PubMed] [Google Scholar]
- 3.Gupta RT, Kauffman CR, Polascik TJ, Taneja SS, Rosenkrantz AB. The state of prostate MRI in 2013. Oncol (willist Park) 2013;27:262–270. [PubMed] [Google Scholar]
- 4.Hricak H, Choyke PL, Eberhardt SC, Leibel SA, Scardino PT. Imaging prostate cancer: a multidisciplinary perspective1. Radiology. 2007;243:28–53. doi: 10.1148/radiol.2431030580. [DOI] [PubMed] [Google Scholar]
- 5.Cornud F, Delongchamps NB, Mozer P, Beuvon F, Schull A, Muradyan N, et al. Value of multiparametric MRI in the work-up of prostate cancer. Curr Urol Rep. 2012;13:82–92. doi: 10.1007/s11934-011-0231-z. [DOI] [PubMed] [Google Scholar]
- 6.Mufarrij P, Sankin A, Godoy G, Lepor H. Pathologic outcomes of candidates for active surveillance undergoing radical prostatectomy. Urology. 2010;76:689–692. doi: 10.1016/j.urology.2009.12.075. [DOI] [PubMed] [Google Scholar]
- 7.Nightingale KR, Soo MS, Nightingale RW, Trahey GE. Acoustic radiation force impulse imaging: in vivo demonstration of clinical feasibility. Ultrasound Med Biol. 2002;28:227–235. doi: 10.1016/s0301-5629(01)00499-9. [DOI] [PubMed] [Google Scholar]
- 8.Zhai L, Polascik TJ, Foo WC, Rosenzweig S, Palmeri ML, Madden J, et al. Acoustic radiation force impulse imaging of human prostates: initial in vivo demonstration. Ultrasound Med Biol. 2012;38:50–61. doi: 10.1016/j.ultrasmedbio.2011.10.002. [DOI] [PMC free article] [PubMed] [Google Scholar]
- 9.Zhai L, Madden J, Foo WC, Mouraviev V, Polascik TJ, Palmeri ML, et al. Characterizing stiffness of human prostates using acoustic radiation force. Ultrason Imaging. 2010;32:201–213. doi: 10.1177/016173461003200401. [DOI] [PMC free article] [PubMed] [Google Scholar]
- 10.Mahdavi SS, Moradi M, Wen X, Morris WJ, Salcudean SE. Evaluation of visualization of the prostate gland in vibro-elastography images. Med Image Anal. 2011;15:589–600. doi: 10.1016/j.media.2011.03.004. [DOI] [PubMed] [Google Scholar]
- 11.Jung AJ, Westphalen AC. Imaging prostate cancer. Radiol Clin North Am. 2012;50:1043–1059. doi: 10.1016/j.rcl.2012.08.001. [DOI] [PubMed] [Google Scholar]
- 12.Bonekamp D, Jacobs MA, El-Khouli R, Stoianovici D, Macura KJ. Advancements in MR imaging of the prostate: from diagnosis to interventions. Radiographics. 2011;31:677–703. doi: 10.1148/rg.313105139. [DOI] [PMC free article] [PubMed] [Google Scholar]
- 13.McNeal JE. The zonal anatomy of the prostate. Prostate. 1981;2:35–49. doi: 10.1002/pros.2990020105. [DOI] [PubMed] [Google Scholar]
- 14.Barentsz JO, Richenberg J, Clements R, Choyke P, Verma S, Villeirs G, et al. ESUR prostate MR guidelines 2012. Eur Radiol. 2012;22:746–757. doi: 10.1007/s00330-011-2377-y. [DOI] [PMC free article] [PubMed] [Google Scholar]
- 15.Hegde JV, Mulkern RV, Panych LP, Fennessy FM, Fedorov A, Maier SE, et al. Multiparametric MRI of prostate cancer: an update on state-of-the-art techniques and their performance in detecting and localizing prostate cancer. J Magn Reson Imaging. 2013;37:1035–1054. doi: 10.1002/jmri.23860. [DOI] [PMC free article] [PubMed] [Google Scholar]
- 16.Turkbey B, Choyke PL. Multiparametric MRI and prostate cancer diagnosis and risk stratification. Curr Opin Urol. 2012;22:310–315. doi: 10.1097/MOU.0b013e32835481c2. [DOI] [PMC free article] [PubMed] [Google Scholar]
- 17.Bouchard RR, Dahl JJ, Hsu SJ, Palmeri ML, Trahey GE. Image quality, tissue heating, and frame rate trade-offs in acoustic radiation force impulse imaging. IEEE Trans Ultrason Ferroelectr Freq Control. 2009;56:63–76. doi: 10.1109/TUFFC.2009.1006. [DOI] [PMC free article] [PubMed] [Google Scholar]
- 18.Dumont D, Dahl J, Miller E, Allen J, Fahey B, Trahey G. Lower-limb vascular imaging with acoustic radiation force elastography: demonstration of in vivo feasibility. IEEE Trans Ultrason Ferroelectr Freq Control. 2009;56:931–944. doi: 10.1109/TUFFC.2009.1126. [DOI] [PMC free article] [PubMed] [Google Scholar]
- 19.Trahey GE, Palmeri ML, Bentley RC, Nightingale KR. Acoustic radiation force impulse imaging of the mechanical properties of arteries: in vivo and ex vivo results. Ultrasound Med Biol. 2004;30:1163–1171. doi: 10.1016/j.ultrasmedbio.2004.07.022. [DOI] [PubMed] [Google Scholar]
- 20.Dahl JJ, Dumont DM, Allen JD, Miller EM, Trahey GE. Acoustic radiation force impulse imaging for noninvasive characterization of carotid artery atherosclerotic plaques: a feasibility study. Ultrasound Med Biol. 2009;35:707–716. doi: 10.1016/j.ultrasmedbio.2008.11.001. [DOI] [PMC free article] [PubMed] [Google Scholar]
- 21.Sharma AC, Soo MS, Trahey GE, Nightingale KR, Congdon AN. Acoustic Radiation Force Impulse (ARFI) imaging of in vivo breast masses. Proceedings of the IEEE Ultrasonics Symposium; Montreal, Canada. 23–27 August 2004; pp. 728–731. [Google Scholar]
- 22.Palmeri ML, Wang MH, Rouze NC, Abdelmalek MF, Guy CD, Moser B, et al. Noninvasive evaluation of hepatic fibrosis using acoustic radiation force-based shear stiffness in patients with nonalcoholic fatty liver disease. J Hepatol. 2011;55:666–672. doi: 10.1016/j.jhep.2010.12.019. [DOI] [PMC free article] [PubMed] [Google Scholar]
- 23.Zhai L, Madden J, Foo WC, Palmeri ML, Mouraviev V, Polascik TJ, et al. Acoustic radiation force impulse imaging of human prostates ex vivo. Ultrasound Med Biol. 2010;36:576–588. doi: 10.1016/j.ultrasmedbio.2009.12.006. [DOI] [PMC free article] [PubMed] [Google Scholar]
- 24.Hsu SJ, Bouchard RR, Dumont DM, Wolf PD, Trahey GE. In vivo assessment of myocardial stiffness with acoustic radiation force impulse imaging. Ultrasound Med Biol. 2007;33:1706–1719. doi: 10.1016/j.ultrasmedbio.2007.05.009. [DOI] [PMC free article] [PubMed] [Google Scholar]
- 25.Palmeri ML, Nightingale KR. Acoustic radiation force-based elasticity imaging methods. Interface Focus. 2011;1:553–564. doi: 10.1098/rsfs.2011.0023. [DOI] [PMC free article] [PubMed] [Google Scholar]
- 26.Palmeri ML, Feltovich H, Homyk AD, Carlson LC, Hall TJ. Evaluating the feasibility of acoustic radiation force impulse shear wave elasticity imaging of the uterine cervix with an intracavity array: a simulation study. IEEE Trans Ultrason Ferroelectr Freq Control. 2013;60:2053–2064. doi: 10.1109/TUFFC.2013.2796. [DOI] [PMC free article] [PubMed] [Google Scholar]
- 27.Nyborg WLM, Litovitz T, Davis C. Acoustic streaming. In: Mason WP, editor. Physical Acoustics. IIA. New York: Academic Press; 1965. pp. 265–331. [Google Scholar]
- 28.Torr GR. The acoustic radiation force. Am J Phys. 1984;52:402–408. [Google Scholar]
- 29.Schned AR, Wheeler KJ, Hodorowski CA, Heaney JA, Ernstoff MS, Amdur RJ, et al. Tissue-shrinkage correction factor in the calculation of prostate cancer volume. Am J Surg Pathol. 1996;20:1501–1506. doi: 10.1097/00000478-199612000-00009. [DOI] [PubMed] [Google Scholar]
- 30.Bercoff J, Tanter M, Muller M, Fink M. The role of viscosity in the impulse diffraction field of elastic waves induced by the acoustic radiation force. IEEE Trans Ultrason Ferroelectr Freq Control. 2004;51:1523–1536. doi: 10.1109/tuffc.2004.1367494. [DOI] [PubMed] [Google Scholar]
- 31.Loupas T, Peterson R, Gill R. Experimental evaluation of velocity and power estimation for ultrasound blood flow imaging, by means of a two-dimensional autocorrelation approach. IEEE Trans Ultrason Contr. 1995;42:689–699. [Google Scholar]
- 32.Pinton GF, Dahl JJ, Trahey GE. Rapid tracking of small displacements with ultrasound. IEEE Trans Ultrason Ferroelectr Freq Control. 2006;53:1103–1117. doi: 10.1109/tuffc.2006.1642509. [DOI] [PubMed] [Google Scholar]
- 33.Parker KJ, Huang SR, Lerner RM. Elastic and ultrasonic properties of the prostate. Proceedings of the IEEE Ultrasonics Symposium; Baltimore, MD. 31 October–3 November 1993; pp. 1035–1038. [Google Scholar]
- 34.Yushkevich PA, Piven J, Cody Hazlett H, Gimpel Smith R, Ho S, Gee JC, et al. User-guided 3D active contour segmentation of anatomical structures: significantly improved efficiency and reliability. Neuroimage. 2006;31:1116–1128. doi: 10.1016/j.neuroimage.2006.01.015. [DOI] [PubMed] [Google Scholar]
- 35.Poon PY, McCallum RW, Henkelman MM, Bronskill MJ, Sutcliffe SB, Jewett MA, et al. Magnetic resonance imaging of the prostate. Radiology. 1985;154:143–149. doi: 10.1148/radiology.154.1.2578070. [DOI] [PubMed] [Google Scholar]
- 36.Fedorov A, Beichel R, Kalpathy-Cramer J, Finet J, Fillion-Robin JC, Pujol S, et al. 3D Slicer as an image computing platform for the quantitative imaging network. Magn Reson Imaging. 2012;30:1323–1341. doi: 10.1016/j.mri.2012.05.001. [DOI] [PMC free article] [PubMed] [Google Scholar]


