

Abstract
Challenges in demonstrating durable clinical responses to molecular-targeted therapies has sparked a re-emergence in viewing cancer as an evolutionary process. In somatic evolution, cellular variants are introduced through a random process of somatic mutation and are selected for improved fitness through a competition for survival. In contrast to Darwinian evolution, cellular variants that are retained may directly alter the fitness competition. If cell-to-cell communication is important for selection, the biochemical cues secreted by malignant cells that emerge should be altered to bias this fitness competition. To test this hypothesis, we compared the proteins secreted in vitro by two human HER2+ breast cancer cell lines (BT474 and SKBR3) relative to a normal human mammary epithelial cell line (184A1) using a proteomics workflow that leveraged two-dimensional gel electrophoresis (2DE) and MALDI-TOF mass spectrometry. Supported by the 2DE secretome maps and identified proteins, the two breast cancer cell lines exhibited secretome profiles that were similar to each other and, yet, were distinct from the 184A1 secretome. Using protein-protein interaction and pathway inference tools for functional annotation, the results suggest that all three cell lines secrete exosomes, as confirmed by scanning electron microscopy. Interestingly, the HER2+ breast cancer cell line exosomes are enriched in proteins involved in antigen processing and presentation and glycolytic metabolism. These pathways are associated with two of the emerging hallmarks of cancer: evasion of tumor immunosurveillance and deregulating cellular energetics.
Keywords: proteomics, exosomes, somatic evolution, tumor immunology, intercellular communication, selective fitness landscape
Introduction
De novo and emergent resistance to many, if not all, molecular targeted therapies in cancer prompts a re-emergence of the view of cancer as a process of somatic evolution (Merlo et al., 2006; Greaves & Maley, 2012; Klinke, 2013). Environmental mutagens alter the genome of somatic cells. Recent efforts to sequence cancer genomes highlight a prolonged period of DNA damage (e.g., (Pleasance et al., 2010)). Intracellular mechanisms aim to repair DNA damage but inevitably some mutations escape from this process. These mutations provide a rich source of neoantigens that can be recognized by the immune system of the host and, as a consequence, result in removal of the cell from the population contained within a tissue (Matsushita et al., 2012). Mutations can also alter how a cell interprets and responds to extracellular cues present within the tissue microenvironment (Klinke, 2010). As these mutations are introduced through a random process, some mutations will improve and other mutations will diminish the ability of a cell to respond appropriately to these extracellular cues. Ultimately, the fate of newly malignant cells within a multicellular tissue is determined by their ability to outcompete normal cells for survival. Conventionally, aspects of this survival competition associated with evolution include the ability to resist normal cell death signals, the ability to proliferate more rapidly, and the ability to survive using suboptimal nutrients. Malignant cells that arise have improved ability to survive given the constraints imposed on the cell by the tissue microenvironment, that is malignant cells have improved fitness. The collective aspects of this competitive selection process comprise a selective fitness landscape. In other words, the selective fitness landscape edits the phenotypic traits associated with emergent malignant variants.
Tissues are comprised of a variety of cell types, each with a finite lifespan and unique functional role, and constitute a dynamic system. Most dynamic systems contain control mechanisms to maintain stability, that is homeostasis for a tissue, in the presence of external perturbations, as introduced by mutagens (Csete & Doyle, 2002). From this dynamic control perspective, we can view the fitness landscape as being constructed of a series of intracellular and extracellular control mechanisms (Klinke, 2013). In the presence of external perturbations, intracellular control mechanisms aim to maintain the integrity of a cell’s functional programming. In contrast, extracellular control structures act at a population-level to maintain the dynamic roles that cells play within multicellular tissue structures. Extracellular control structures include innate and adaptive immunity and involve cell-to-cell communication. Conventionally, cell-to-cell communication occurs through direct cell-to-cell contact, such as the presentation of antigens, or through indirect modes that involve the release of biochemical cues and the binding of these cues to cellular receptors, such as the release of cytokines by T helper cells. The release of extracellular vesicles is also emerging as a mechanism for indirect cell-to-cell communication (Thery, 2011). Decades of research have improved our understanding of how mutations alter these intracellular control mechanism (Hanahan & Weinberg, 2011). For instance, more than half of all cancers harbor mutations in p53, a protein that helps control genomic integrity (Hollstein et al., 1991). Yet, our understanding of how malignant cells manipulate these extracellular control structures is still emerging (Hanahan & Weinberg, 2011). Selecting for cell phenotypes that manipulate the selective fitness landscape in favor of malignant cell survival may be one aspect that differentiates somatic evolution from Darwinian evolution.
To better understand how cell-to-cell communication becomes altered in cancer, a first order approximation is to assume that the biochemical cues secreted by malignant cell lines, that is the tumor secretome, reflect the editing process associated with oncogenesis. To test this assumption, we compared the biochemical cues secreted in vitro by cellular models of breast cancer relative to normal human mammary epithelial cells. For this study, we focused on two cell models of a subtype of breast cancer that overexpresses HER2, a member of the epidermal growth factor family of receptors, that is targeted therapeutically by the monoclonal antibody trastuzumab (Slamon et al., 2001). These breast cancer cell lines also vary in their expression in receptors for estrogen (ER) and progesterone (PR). The BT474 cell line was derived from a HER2+/ER+/PR+ solid invasive ductal carcinoma of the breast and exhibits high in vitro invasiveness (Lasfargues et al., 1978). The second cell line (SKBR3) was derived from a pleural effusion breast adenocarcinoma, is HER2+/ER−/PR−, and exhibits low in vitro invasiveness (Trempe, 1976). These breast cancer cell lines were compared against the 184A1 cell line, which reflects normal human mammary epithelium. This secretome comparison is to complement our proteomic analysis of whole cell lysates from these three breast cancer models (Kulkarni & Klinke, 2012). In short, we found that the two HER2+ breast cancer cell lines exhibited secretome profiles that are similar to each other and, yet, are distinct from a human mammary epithelial cell line secretome and the proteomes of the corresponding whole cell lysates, as supported by similarities and differences between the 2-D gel secretome maps and lists of identified proteins. Given the similarities in the breast cancer secretomes, we aimed to infer common mechanisms by which these cancer cells alter the selective fitness landscape using data integration sources for functional annotation and validated this functional annotation on an independent sample using scanning electron microscopy (SEM), an orthogonal approach to proteomics.
Materials and Methods
Cell culture and sample preparation
The human breast cancer and normal mammary epithelial cell lines (BT474, SKBR3, and 184A1) were cultured as described previously (Kulkarni & Klinke, 2012). In summary, BT474 cells were maintained in supplemented Roswell Park Memorial Institute (RPMI) 1640 medium (Mediatech, Inc., Herndon, VA) supplemented with 10% (v/v) heat inactivated fetal bovine serum (FBS) (Hyclone, Inc., Logan, UT), 0.3% (w/v) L-glutamine, 1% (v/v) penicillin/streptomycin (BioWhittaker, Walkersville, MD) and 10 μg/mL insulin (Sigma, St Louis, MO); SKBR3 cells were maintained in supplemented Improved Modified Eagle medium (IMEM) Zn2+ option (Invitrogen) supplemented with 10% FBS and 1% penicillin/streptomycin; and 184A1 cells were maintained in DMEM/Ham’s F-12 (1:1) medium supplemented with 5% (v/v) horse serum (Invitrogen), 20 ng/mL rhEGF (Promega Corp, Madison, WI), 10 μg/mL insulin and 0.5 μg/mL hydrocortisone (Sigma, St Louis, MO). All cell lines were cultured in a humidified incubator at 37°C and 5% (v/v) CO2. As similarly described in Kulkarni et al. (2012), serum-free media conditioned by an equal number of cells from each of the three cell lines were collected following a wash sequence in serum-free media (0 hour sample) and after 48 hours. The secretome was enriched in the conditioned media using a staged centrifugation protocol, as described in Kulkarni et al. (2012), and cleaned-up using a 2D clean-up kit from GE Healthcare (Cat. 80-6484-51).
Proteomics workflow
Secretome proteins were identified using a qualitative proteomic workflow based upon 2-D gel electrophoresis (2DE) and MALDI-TOF mass spectrometry as described previously (Kulkarni et al., 2012; Kulkarni & Klinke, 2012). For the SKBR3 and BT474 cell lines, three biological replicates were obtained for the 0h and 48h secretome each to ensure that the protein expression pattern across each sample was consistent across each replicate. For the 184A1 cell line, two technical replicates were obtained for the 48h secretome to ensure that the protein expression pattern was consistent. All the protein spots that were well focused in the Coomassie stained gels were manually excised and digested in-gel using trypsin. Using both internal and external calibration methods, a MALDI-TOF-MS system model Micromass MALDI-R (Waters) was used to obtain the peptide mass fragment spectra as recommended by the manufacturer and provided mass accuracy of 25–50 ppm. The peak lists containing the m/z ratio and corresponding intensity values were exported to Microsoft Excel for further processing. Peptide mass fingerprints obtained from MALDI-TOF MS were used to query public protein primary sequence databases for protein identification, as described previously (Kulkarni et al., 2012; Kulkarni & Klinke, 2012). For the BT474 and SKBR3 secretomes, Mascot database search engine v2.3.02 (www.matrixscience.com, Matrix Science Ltd., UK) and Expasy Aldente (version 19/03/2010) were used to query the UniProtKB/Swiss-Prot human database (Release 2010_12, 523151 sequences, 184678199 amino acids) with the following settings: peptide mass tolerance of 50 ppm, one missed cleavage site, one fixed modification of carboxymethyl cysteine, one variable modification of methionine oxidation, minimum of four peptide matches and no restrictions on protein molecular mass or isoelectric point. A protein observed in either the BT474 or SKBR3 secretomes was considered to be positively identified only when it was a hit using both algorithms. For the 184A1 secreteome, the peaks uniquely associated with each picked spot were identified using the mscalib package in R (Wolski et al., 2005). As the Aldente server is no longer available, the Mascot database search engine was used (v2.4.01) to query the UniProtKB/Swiss-Prot human database (Release 2013_6, 540261 sequences, 191876607 residues) with the filtered 184A1 secretome peak list and the following settings: peptide mass tolerance of 50 ppm, one (or two) missed cleavage site(s), one fixed modification of carboxymethyl cysteine, one variable modification of methionine oxidation, minimum of four peptide matches and no restrictions on isoelectric point. In contrast to the proteomic analyses of BT474 and SKBR3 secretomes, a protein in the 184A1 secretome was considered to be positively identified only when Mascot match exhibited a similar molecular weight as observed on the 2D-gel. Analyses of peptide mass fingerprints for all three cell lines were performed independently to minimize identification bias. Identified proteins were also validated by Western blot using primary antibodies specific for HSPA5 (MAB4846, RnD Systems Inc., Minneapolis, MN), Ezrin (610602, BD Laboratories, San Jose, CA), and ILF2 (H00003608-B01P, Abnova, Walnut, CA) and methods as described in (Kulkarni & Klinke, 2012).
Functional annotation
Functional annotation of the identified proteins was performed using a variety of data integration sources. GeneMANIA was used to query curated protein-protein interaction data sources and infer interaction networks and likely unobserved nodes based upon the observed protein data set (www.genemania.org (Mostafavi et al., 2008)). Using the default network weighting method, protein-protein interactions were identified based upon experimental evidence of protein-protein interactions in Homo sapiens (61 curated references) and predicted protein-protein interactions based upon homology with other species (50 curated references). The unobserved nodes were pruned from the network that were based solely on predicted interaction and had one edge. The remaining nodes were arranged based upon their subcellular location, as annotated in the UniProt Protein Knowledgebase (www.uniprot.org), and color coded based on association with human exosomes as cataloged in the ExoCarta database (www.exocarta.org (Mathivanan et al., 2012)). Pathway enrichment was determined using DAVID Bioinformatics Resources 6.7 (david.abcc.ncifcrf.gov (Huang et al., 2009b,a)) and Ingenuity Pathway knowledgebase (www.ingenuity.com), as described in Kulkarni et al. (2010). Briefly, the significance of enriched pathway within the identified protein data set was determined by a right-tailed Fisher’s Exact test of a 2x2 contingency table with the Benjamini-Hochberg correction for multiple hypothesis testing. The likelihood is calculated based on the number of identified proteins mapped to the pathway relative to the total number of proteins in the pathway and the total number of identified proteins relative to the total number of proteins associated with any pathway in the database. The null hypothesis tested was that the functional annotations associated with the observed proteins were likely to be observed by random chance alone. A p-value of less than 0.05 was considered statistically significant and suggests that the functional annotation was not observed by random chance alone. In using a Fisher’s Exact test for pathway enrichment, we assume that observing a protein in a secretome sample was a binary result, where the abundance of an observed protein was considered to be above minimum threshold and subsequent differences in abundance were not explicitly considered. This interpretation is consistent with the qualitative nature of our proteomic workflow.
Scanning electron microscopy
As an external validation of the proteomic results, putative exosomes were isolated from conditioned media by differential centrifugation as follows: 300 g for 10 minutes to remove cells, 2,600 g for 10 minutes to remove residual cells and debris, 10,000 g for 60 minutes to remove microparticles, and 100,000 g for 2 hours to collect exosomes in pellets. Centrifugation steps were performed using a Beckman Coulter X-14R centrifuge and a Beckman Coulter XL90 ultracentrifuge with proper rotors, open-top (Cat#: 355631) or capped (Cat#: 355618, Cat#: 355655) thickwall polycarbonate tubes (Beckman Coulter). Once isolated, the putative exosomes were resuspended in 0.2–1 ml DPBS. A solution containing the secretome isolate was dipped over clean silicon chips and liquid was evaporated after 15–60 minutes at room temperature. Silicon chips were mounted on SEM stage by carbon paste. To make surface conductive, a coating of 2–5nm gold-palladium was applied by sputtering (SPI-Module Sputtering, Argon as gas for plasma) before imaging by scanning electron microscopy (SEM Hitachi S-4700). SEM was done under low beam energies (5.0 kV). Analysis of exosome sizes were done using the SEM images via ImageJ and the density distribution of exosome diameters were obtained using R/Bioconductor Version 2.14.1.
Results
Secretomes of BT474 and SKBR3 cell lines contain many shared proteins but are different from 184A1 secretome
Proteins were concentrated from media conditioned by these three cell lines for 48 hours and separated using two-dimensional gel electrophoresis, as shown in Figure 1 and Supplemental Figures S1–S3. Conditioned media used in the final wash step was used to establish a protein background (0 hr sample) for the BT474 and SKBR3 secretomes. In the 0 hr samples, 20 spots were picked from both lines of which 12 were identified in the SKBR3 sample and 10 were identified in the BT474 sample (see Supplementary Excel Files 1 and 2). In the 48 hr samples, 91 gel spots were selected for identification from the SKBR3 cell line and 96 gel spots were selected in the BT474 cell line (see Supplementary Excel Files 3 and 4). Of the selected spots in 48 hr sample, 54 BT474 proteins and 63 SKBR3 proteins were identified, which corresponded to an overall likelihood of success in protein identification of 63%. Approximately 90% of the identified spots had sequence coverage 25% or greater.
Figure 1. 2-D gel electrophoresis maps of secretomes from SKBR3 and BT474 cell lines are similar but distinct from 184A1 cell line.
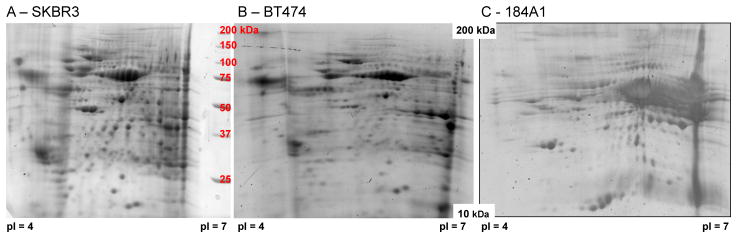
Representative results from concentrated media conditioned with SKBR3 (Panel A - 48 hour sample), BT474 (Panel B - 48 hour sample), and 184A1 (Panel C - 48 hour sample) cell lines. The horizontal axis corresponds to isoelectric focusing using a 7 cm IPG strip with pH range 4–7. The vertical axis corresponds to molecular weight separation using a 12% SDS-polyacrylamide gel with resolution between 10 to 250 kDa, as indicated by the molecular weight standard shown in panel A. Results representative of three biological replicates for SKBR3 and BT474 and two technical replicates for 184A1 cells (see Supplemental Figures S1-S3).
As an independent validation test, the predicted molecular weights of the proteins identified in the SKBR3 and BT474 secretomes showed good agreement with the observed molecular weights (see Figure 2). As expected, theoretical versus observed pI exhibited greater uncertainty, as post-translational modifications of proteins tends to shift the pI rather than the molecular weight of proteins. These post-translational modifications may be attributed to cellular differences or introduced by the 2DE protocol. For instance, protein phosphorylation typically increases the acidity resulting in a shift in the isoelectric focusing point. Similarly, carbamylation of cysteine and oxidation of methionine are two examples of protein modifications that are a result of iodoacetamide and urea in the lysis buffer and that can shift the observed pI. As an additional validation, the presence of 78 kDa glucose-regulated protein (HSPA5), Ezrin, and Interleukin enhancer-binding factor 2 (ILF2) in the BT474 and SKBR3 secretomes were confirmed by Western blot (see panel D in Figure 2). HSPA5 was identified in both BT474 (spot 77) and SKBR3 (spot 57) secretomes and was present in the 48 h but not in the 0 h BT474 samples. This suggests that HSPA5 accumulates in cell-conditioned media. In comparing the two cell lines, HSP5A appeared to be greater in the SKBR3 than the BT474 secretome, where GAPDH was used to normalize loadings. As we will discuss later, GAPDH is also an exosome-associated protein. Ezrin and ILF2 were initially selected as they were identified in only the SKBR3 and BT474 secretomes, respectively. However, Western blot results suggest that they are present in both secretomes but have different relative abundance, which is also supported by the 2DE secretome maps. ILF2 was identified in the BT474 secretome in spot 44. In the 2DE results for the SKBR3 secretome, spot 43 is the corresponding spot but was not able to be identified independently. Ezrin was identified in the SKBR3 secretome in spot 86, while the corresponding spot in the BT474 secretome map - spot 71 - was also not able to be identified independently. Collectively, the Western blot results confirm the MALDI-TOF MS protein identification results.
Figure 2. Validation of MALDI-TOF MS identification of secretome proteins.

The theoretical molecular weights of identified proteins in 48 hour SKBR3 (Panel A), BT474 (Panel B), and 184A1 (Panel C) secretomes were compared against observed molecular weights, which were estimated based upon molecular weight standards. For SKBR3 and BT474 proteins, this comparison is an independent validation test. For 184A1 proteins, molecular weight information was used to help identify proteins, as the Aldente algorithm for peptide mass fingerprinting was no longer available. The presence of three identified proteins were also confirmed by Western blot (Panel D). The 78 kDa glucose-related protein (HPSA5) and Interleukin enhancer-binding factor 2 (ILF2) were confirmed by Western blot to accumulate in BT474-conditioned media (0 h versus 48 h samples - upper left). Using GAPDH as a loading control, HSP5A appeared to be greater in the SKBR3 secretome (lower left), while ILF2 (upper right) and Ezrin (lower right) were present in both BT474 and SKBR3 secretomes.
Of the identified proteins, the BT474 secretome contained 43 unique proteins contained that did not overlap with the 0 hr sample, as summarized in Table 1. Similarly, 41 unique proteins were identified in the SKBR3 secretome. As mirrored by the similarity in 2-D secretome maps, almost 50% of the identified proteins were common to both the BT474 and SKBR3 secretomes. In comparison, 84 gel spots were picked for identification from the 184A1 secretome collected at 48 hours (see Supplementary PDF File 2). Of the 184A1 samples, 49 unique proteins were identified, as summarized in Supplementary Table S1. Among the three 48 hour secretomes, only proteasome activator complex proteins (PSME1/PSME2) were observed in all three, while only transferrin receptor protein 1 (TFRC) was shared between 184A1 and SKBR3 secretomes and only Serpin B6 (SERPINB6) was shared between 184A1 and BT474 secretomes. While culturing these three cell lines in the absence of serum may be a confounding factor, we did not see significant differences in viability during the 2 day experiment. Given the similarity between the BT474 and SKBR3 secretomes, these two sets of unique secretome proteins were used for subsequent functional annotation in the form of protein interaction network inference and pathway enrichment.
Table 1.
Proteins identified in SKBR3 and BT474 secretomes
| SKBR3 | BT474 | ||
|---|---|---|---|
| Protein Name | Symbol | Protein Name | Symbol |
| 14-3-3 protein epsilon | YWHAE‡ | 6-phosphofructo-2-kinase/fructose-2,6- biphosphatase 1 | PFKFB1 |
| 78 kDa glucose-regulated protein | HSPA5‡ | ||
| Actin, cytoplasmic 1 | ACTB‡ | 78 kDa glucose-regulated protein | HSPA5‡ |
| Alpha-enolase | ENO1‡ | Actin, cytoplasmic 1 | ACTB‡ |
| Aminoacylase-1 | ACY1‡ | ATP-dependent RNA helicase DDX3X | DDX3X‡ |
| Apolipoprotein A-I-binding protein | APOA1BP | Calreticulin | CALR‡ |
| Calreticulin | CALR‡ | Cellular retinoic acid-binding protein 2 | CRABP2‡ |
| Centrosomal protein of 63 kDa | CEP63 | Conserved oligomeric Golgi complex subunit 4 | COG4 |
| Ezrin | EZR‡ | ||
| Fructose-bisphosphate aldolase A | ALDOA‡ | Cutaneous T-cell lymphoma-associated antigen 8 | CTAGE8 |
| General transcription factor 3C polypeptide 5 | GTF3C5 | ||
| Fructose-bisphosphate aldolase A | ALDOA‡ | ||
| Glucose-6-phosphate 1-dehydrogenase | G6PD‡ | Gamma-glutamylcyclotransferase | GGCT‡ |
| Glutathione synthetase | GSS‡ | Glucose-6-phosphate isomerase | GPI‡ |
| Glyoxalase domain-containing protein 4 | GLOD4 | Glutathione synthetase | GSS‡ |
| Heat shock cognate 71 kDa protein | HSPA8‡ | Glyoxalase domain-containing protein 4 | GLOD4 |
| Heat shock protein HSP 90-alpha | HSP90AA1‡ | Heat shock cognate 71 kDa protein | HSPA8‡ |
| Hydroxymethylglutaryl-CoA synthase, cytoplasmic | HMGCS1 | Heat shock protein HSP 90-alpha | HSP90AA1‡ |
| Hydroxymethylglutaryl-CoA synthase, cytoplasmic | HMGCS1 | ||
| Isoform 2 of HLA class I histocompatibility antigen, Cw-16 alpha chain | HLA-C | ||
| Interleukin enhancer-binding factor 2 | ILF2 | ||
| Isoform MBP-1 of Alpha-enolase | ENO1‡ | Isoform 1 of Glutamate [NMDA] receptor subunit zeta-1 | GRIN1‡ |
| Lactoylglutathione lyase | GLO1‡ | ||
| N(G),N(G)-dimethylarginine dimethylaminohydrolase 2 | DDAH2‡ | Mitochondrial intermediate peptidase | MIPEP |
| NADP-dependent malic enzyme | ME1 | ||
| Nucleoside diphosphate kinase A | NME1‡ | Neprilysin | MME‡ |
| Peroxiredoxin-1 | PRDX1‡ | Nucleoside diphosphate kinase A | NME1‡ |
| Peroxiredoxin-2 | PRDX2‡ | Nucleoside diphosphate kinase B | NME2‡ |
| Phosphatidylethanolamine-binding protein 1 | PEBP1‡ | Peroxiredoxin-2 | PRDX2‡ |
| Phosphatidylethanolamine-binding protein 1 | PEBP1‡ | ||
| Phosphoglycerate mutase 1 | PGAM1‡ | ||
| Proteasome activator complex subunit 1 | PSME1 | Phosphoglycerate mutase 1 | PGAM1‡ |
| Proteasome activator complex subunit 2 | PSME2‡ | Proteasome activator complex subunit 2 | PSME2‡ |
| Proteasome subunit alpha type-3 | PSMA3‡ | Proteasome subunit alpha type-3 | PSMA3‡ |
| Proteasome subunit alpha type-6 | PSMA6 | Proteasome subunit beta type-11 | PSMB11 |
| Proteasome subunit beta type-2 | PSMB2‡ | Proteasome subunit beta type-4 | PSMB4 |
| Proteasome subunit beta type-4 | PSMB4 | Proteasome subunit beta type-6 | PSMB6‡ |
| Purine nucleoside phosphorylase | PNP | Protein disulfide-isomerase A3 | PDIA3‡ |
| Putative ubiquitin-conjugating enzyme E2 N-like | UBE2NL | Purine nucleoside phosphorylase | PNP |
| Putative protein phosphatase inhibitor 2 | PPP1R2P3 | ||
| Rab GDP dissociation inhibitor beta | GDI2‡ | Rab GDP dissociation inhibitor beta | GDI2‡ |
| Serotransferrin | TF‡ | RAC-beta serine/threonine-protein kinase | AKT2 |
| Transferrin receptor protein 1 | TFRC‡ | Ras-related protein Rab-37 | RAB37 |
| Triosephosphate isomerase | TPI1‡ | RING finger and CHY zinc finger domain-containing protein 1 | RCHY1 |
| tRNA dimethylallyltransferase, mitochondrial | TRIT1 | ||
| Serpin B6 | SERPINB6‡ | ||
| Uncharacterized protein C6orf163 | C6ORF163 | Transitional endoplasmic reticulum ATPase | VCP‡ |
| Xaa-Pro dipeptidase | PEPD‡ | ||
| Triosephosphate isomerase | TPI1‡ | ||
| Tripartite motif-containing protein 35 | TRIM35 | ||
| Tropomyosin alpha-4 chain | TPM4 | ||
indicates identified in exosomes.
BT474 and SKBR3 cell lines both secrete exosomes
To glean insight into the functional roles of these secreted proteins, GeneMANIA was used to develop a network based upon protein-protein interactions among the identified proteins. We analyzed the secretomes derived from the BT474 and SKBR3 cell lines separately (see Supplemental Figures 4 and 5) and also the combined data set (see Figure 3), given that half of the proteins were observed in common. The resulting protein-protein interaction networks include both the identified proteins and proteins that are inferred based upon known interaction with the set of observed proteins. Using the resulting protein-protein interaction network as a starting point, we also rearranged the networks to reflect the subcellular location of the proteins. Interestingly, the majority of the identified proteins have been reported to reside in the cytoplasm. Very few proteins were associated with the extracellular space or the plasma membrane. The sparse associated with the plasma membrane was expected as proteins in the plasma membrane should be lipophilic and the insolubility of lipophilic proteins limits isoelectric focusing on immobilized pH gradients (Reisinger & Eichacker, 2008). While our secretome enrichment protocol is designed to exclude cellular debris, the cytosolic proteins could reside in a number of membrane vesicles that are released by cells. These vesicles include microvesicles that are released by the outward blebbing of the cell membrane, apoptotic vesicles that are released during programmed cell death, and exosomes that originate within intracellular multivesicular compartments and are constitutively released by cells through exocytosis (van der Pol et al., 2012). We felt that apoptotic vesicles were unlikely to be a major contributor to the observed secretome as we did not observe significant differences in viability during the 48 hours that the cells conditioned the media. Given the recent interest in exosomes as a new mode of cell-to-cell communication, we used the ExoCarta database to annotate the nodes within network based upon previous reports that a particular protein has been observed in exosomes. Of the identified proteins, 28 of 41 proteins in SKBR3 and 26 of 43 proteins in BT474 secretomes had been observed in human exosomes. While not identified in the proteomic analysis but observed by Western blot, GAPDH is also associated with exosomes. In comparison to the SKBR3 and BT474 cell lines, a lower proportion of the proteins identified in the 184A1 secretome have been associated with exosomes (i.e., 20 of 49). Based upon the list of proteins currently associated with human exosomes relative to the total number of identifiable proteins, the functional annotation that many of these proteins are associated with exosomes was significant for all three secretomes (Fisher’s Exact Test: p-value < 1e-10).
Figure 3. Protein-protein interaction networks suggest that the majority of proteins identified in both SKBR3 and BT474-conditioned media are derived from exosomes.

Protein-protein interaction networks were constructed in GeneMania using the union set of all identified proteins in SKBR3 and BT474 secretomes (Panel A), using just the SKBR3 secretome (Supplemental Figure S1), and using just the BT474 secretome (Supplemental Figure S2). The proteins were arranged based upon similarity in subcellular location. Gray circles indicate identified proteins while white circles indicate proteins inferred based upon known interactions with identified proteins. The blue edges indicate experimentally observed protein-protein interactions in Homo Sapiens, while brown edges are predicted protein-protein interactions based on homology with other species. Encircled nodes are found in the Exocarta database, which suggests that they are associated with exosomes. Nodes encircled in blue are from SKBR3, in yellow from BT474, and in green are common between SKBR4 and BT474. The nodes encircled in red are inferred only in the amalgamated network and are associated with exosomes. Scanning electron microscopy was used to confirm that the secretome contained membrane vesicles (Panel B - SKBR3-conditioned media). The size and distribution of membrane vesicles were consistent with exosomes (Panel C). SEM results representative of a least two replicates.
To validate this functional annotation, we isolated secreted vesicles from media conditioned for 48 hours by SKBR3 cells using a staged centrifugation approach. We imaged the resulting isolated fraction using scanning electron microscopy (SEM). As shown in Figure 3B, the isolated fraction was rich in nanoscale vesicles. While there is no consensus on nomenclature, the different vesicles can in part be distinguished based upon their morphology. Exosomes are around 100 nm in diameter and exhibit a uniform distribution in size. In contrast, microvesicles and apoptotic vesicles exhibit heterogeneous distributions that range in size from 50 to 4000 nm in diameter. Using image segmentation, we determined that the vesicles exhibited morphology consistent with exosomes, as they were uniformly distributed with a mean diameter of 183 nm (n = 223, s.d. ± 35 nm) (see Figure 3C). While the average size may seem slightly larger than the reported range of exosomes, the SEM images were obtained using freshly isolated exosomes. If exosomes are stored in PBS at 4°C, their size is reduced by 50% within 7 days (Sokolova et al., 2011). Of the identified proteins, GDI2 and RAB37 provide support that these nanoscaled vesicles are of endosomal origin as these proteins play key roles in delivering intracellular cargo for exocytosis (Ullrich et al., 1993; Masuda et al., 2000). RAB37 is a GTPase that along with RAB3, RAB26, and RAB27A/B regulate the transport of secretory vesicle and granules (Stenmark, 2009). While their specific roles for exosome transport and release remains unclear, knock-down of RAB27A inhibits exosome production (Peinado et al., 2012) but not the release of secreted proteins (Bobrie et al., 2012). Moreover, the broad field of view in the SEM image provided better evidence of the size distribution than is typically presented (e.g., (Sokolova et al., 2011; Peinado et al., 2012)).
Functional annotation of the secretome suggests that BT474 and SKBR3 exosomes transport metabolic enzymes and present MHC class I antigens
Finally, we wanted to determine what pathways would be impacted by the transfer of exosomal proteins between cells. Using DAVID, we identified a set of common gene ontology terms that were shared across the BT474 and SKBR3 secretomes. As shown in Figure 4A, these common gene ontology terms were grouped into antigen processing and presentation pathways or metabolic pathways. In terms of enriched canonical pathways, identified proteins in both breast cancer secretomes were associated with antigen processing and presentation via the major histocompatibility class I (see Figure 4B) and glycolysis/gluconeogenesis (see Figure 4C). In contrast, no canonical pathways were identified as significantly enriched in the list of proteins identified in the 184A1 secretome. However, two 184A1 secretome proteins, HLA-B and PSME1, are associated with antigen processing and presentation. While these pathway enrichment results were obtained using uncurated sources, we also observed similar pathway enrichment using Ingenuity Pathway Analysis (IPA), a curated source of data integration (see Supplemental Figure S6). IPA results suggested that, of the top ten canonical pathways for each cell line, seven were common between the BT474 and SKBR3 secretomes.
Figure 4. Pathway enrichment suggests that the exosomes derived from both BT474 and SKBR3 cells play similar functional roles in presenting antigens and modulating metabolism.

Functional annotation of the identified proteins using enrichment of biological pathways and gene ontology (GO) terms in DAVID (Panel A: TOP - antigen presentation cluster, BOTTOM - metabolism cluster). Green block indicated that a particular gene (columns) that is associated with a given pathway/GO term (rows) was identified in the secretome (BT-474 - red, SKBR3 - black, both cell lines - blue). Black regions of the grid indicate that GO association for a gene has not been reported. Graphical summaries of the MHC class I pathway (Panel B) and the glycolysis/gluconeogenesis pathway (Panel C) obtained from the KEGG Pathway database were annotated with the identified proteins (BT-474 secretome - red star, SKBR3 secretome - black star, secretomes from both cell lines - blue star).
Discussion
A common application of proteomics for secretome analysis is to discover biomarkers associated with different molecular subtypes of cancer (e.g., (Kulasingam & Diamandis, 2007; Srirajaskanthan et al., 2010; Wu et al., 2010; Makawita et al., 2011; Sepiashvili et al., 2012; Pavlou et al., 2013; Xue et al., 2008)). Here, we aimed to identify differences in how malignant cells associated with a particular molecular subtype of breast cancer condition their environment differently from normal cells derived from the same tissue using a proteomics approach. Collectively, the secretome analysis of in vitro cultured BT474 and SKBR3, two HER2+ breast cancer cell lines, versus 184A1, a normal human mammary epithelial cell line, suggests that exosomes are a major mode by which these cancer cells condition the tumor microenvironment. The 50% overlap in the proteins identified in the BT474 and SKBR3 secretomes was particularly intriguing as this overlap was not observed in our recent proteomic analysis of whole cell lysates derived from these cell lines (Kulkarni & Klinke, 2012). In comparison, only three of the 41 SKBR3 and only four of the 43 BT474 secretome proteins are common with the observed whole cell proteome. In addition, the presence of exosomes presents challenges for separating the proteins present in the secretome by 2DE due to the increase in membrane surface area and associated lipids. Lipids present within an unfractionated secretome sample may limit the effectiveness of detergents in solubilizing proteins, as illustrated in Supplemental Figures S1–S3. As the goal of this study was to observe as many proteins as possible in the secretomes using the same proteomics workflow as our whole cell lysate study rather than to quantify differences in abundance, the results may be viewed as qualitative. An alternative approach is Stable Isotope Labeling by Amino Acids in Cell Culture (SILAC) (Ong et al., 2002, 2003; Schulze & Mann, 2004), where isotope-labeled amino acids, specifically arginine and lysine, are replaced in the culture media of the tumor cells for at least 5 population doublings prior to collecting secretome. The entire proteome of the tumor cells then incorporates SILAC encoding and newly secreted proteins contain isotope labeling. A SILAC approach improves the detection of secreted proteins from contaminating proteins like keratins and serum derived factors (Henningsen et al., 2010). Despite these caveats, the protein identification, Western blot, functional annotation, and SEM results are all consistent in suggesting that exosomes are a major mode of cell-to-cell communication. While the study of extracellular microvesicles is an area of intense interest, one of the challenges with placing our findings into biological context is that the exosome literature is controversial due to inconsistent nomenclature and isolation methods (Raposo & Stoorvogel, 2013; Simpson & Mathivanan, 2012). Overall our approach was designed to overcome common criticisms, as we used a differential centrifugation protocol coupled with SEM to characterize the size distribution and morphology of fresh samples.
As an emerging mode of cell-to-cell communication, exosomes have been reported to transfer proteins (van der Pol et al., 2012) and RNA (Valadi et al., 2007; Ratajczak et al., 2006) between cells. While exosomes are ubiquitously expressed, malignant cells derived from melanoma and ovarian cancer have been shown to secrete higher levels of exosomes as compared to normal controls (Logozzi et al., 2009; Taylor & Gercel-Taylor, 2008; Zhang et al., 2012), which may be attributed to p53-mediated stress response (Yu et al., 2006). Here the functional annotation of the identified proteins suggests that these exosomes play a role in antigen presentation. Conventionally, cell-mediated cytotoxic immunity is enforced by two different cell types: cytotoxic T lymphocytes (CTLs) and Natural Killer (NK) cells. CTLs kill tumor cells that express sufficient cognate antigens in the form of a peptide-MHC class I complex. At the other extreme, NK cells direct cytotoxic activity against cells that do not express sufficient MHC class I. In contrast to dendritic cell-derived exosomes (Thery et al., 2001), the significant enrichment of proteins associated with antigen processing and presentation via MHC class I molecules in tumor-derived exosomes suggests a possible decoy strategy whereby tumor antigens are distributed to other cells within the tumor microenvironment. Alternatively, exosomes may provide a mechanism for these malignant cells to shed MHC class I molecules as others have shown that HER2 overexpression downregulates MHC class I expression (Maruyama et al., 2010; Herrmann et al., 2004). As the tumor antigen epitopes presented by these two human breast cancer cell lines are unknown, it is difficult to assess directly how peptide-MHC class I complexes on BT474- or SKBR3-derived exosomes alter the ability of these two cell-mediated immune mechanisms to control tumor cell growth. One limitation of the study is that all three cell lines are derived from different individuals and that the observed differences may reflect natural genetic variation among an outbred population rather than oncogenesis. Although the similarities between the BT474 and SKBR3 secretomes and their collective difference from 184A1 secretome argue against that possibility, additional studies using syngeneic cell lines may be informative.
Pathway enrichment also suggests that exosomes may alter the metabolic flux within surrounding cells through the intercellular transport of metabolic enzymes associated with glycolysis. The presence of glycolytic enzymes is not unexpected as reprogramming of energy metabolism is an emerging hallmark of cancer (Hanahan & Weinberg, 2011). Cancer cells obtain their energy through glycolysis despite the presence of oxygen, a phenomenon called the “Warburg effect” (Warburg, 1956; Hsu & Sabatini, 2008; van der Heiden et al., 2009). However, the implications of transporting enzymes between cells to alter metabolic flux through entire pathways using exosomes is intriguing. In addition to altered intracellular metabolism, it is well-known that malignant cells elicit a field effect on the surrounding cells by altering the metabolic environment (e.g., Yakoub et al. (2010)). This field effect is observed outside of a direct cell-to-cell contact region. In development, spatial gradients of secreted proteins, that is morphogens, shape cell fate (Shvartsman, 2005). Given a constitutive source, spatial gradients of morphogens are regulated by the rate of consumption of the secreted protein, through receptor-mediated degradation or extracellular proteolytic degradation, and the diffusivity of a secreted protein within the tissue matrix (Kicheva et al., 2007). Following from reaction versus diffusion considerations in porous media embodied by the Thiele modulus (Thiele, 1939; Thurber et al., 2007; Goentoro et al., 2006), secreted proteins with low diffusivity promote while secreted proteins with high diffusivity inhibit the formation of spatial gradients. In addition, the diffusivity of a secreted protein within a porous matrix is dependent on the affinity of the protein for the porous matrix and the size of the secreted protein (Haller & Saltzman, 1998). Compared to oxygen, glucose and other metabolic substrates, these transport considerations imply that exosomes may contribute to field effects due to their relatively large size and potential to transport metabolic enzymes. Cells that enter the tumor microenvironment may then be forced to up regulate glycolytic metabolism, which may have a detrimental effect on the function of tumor-infiltrating cytotoxic T lymphocytes (Sukumar et al., 2013). Moreover, GAPDH, which we observed by Western blot, expressed in excess enables this glycolytic enzyme to bind to the 3′ untranslated region of the Interferon gamma (IFNg) mRNA to inhibit its expression instead of glyceraldehyde-3-phosphate, its normal metabolic substrate (Chang et al., 2013). IFNg is a cytokine produced by T lymphocytes that increases the expression of MHC class I complexes on the surface of cells. Collectively, the proteomic analysis of the secretome of two HER2+ breast cancer cell lines compared with a normal human mammary epithelial cell line suggest that tumor-derived exosomes contribute to two of the emerging hallmarks of cancer: evading tumor immunosurveillance and deregulating cellular energetics.
Supplementary Material
Identification summary of the identified proteins in the 48 hr SKBR3 secretome showing the rank and score from two different algorithms used to search the protein database. Worksheet 2 shows the sequence coverage, peptide matches, number of mass values searched and the RMS error. Worksheet 3 shows the gel image with spot identifier numbers.
This supplemental PDF file contains:
Fig. S1. Three biological replicates of 2DE map of SKBR3 secretome.
Fig. S2. Three biological replicates of 2DE map of BT474 secretome.
Fig. S3. Two technical replicates of 2DE map of 184A1 secretome.
Fig. S4. Protein-protein interaction network inferred from proteins identified in SKBR3 secretome.
Fig. S5. Protein-protein interaction network inferred from proteins identified in BT474 secretome.
Fig. S6. Significant canonical pathways enriched in the BT474 and SKBR3 secretomes.
Table S1. Proteins identified in 184A1 secretome.
Identification summary of the identified proteins in the 0 hr SKBR3 secretome showing the rank and score from two different algorithms used to search the protein database. Worksheet 2 shows the sequence coverage, peptide matches, number of mass values searched and the RMS error. Worksheet 3 shows the gel image with spot identifier numbers.
Identification summary of the identified proteins in the 0 hr BT474 secretome showing the rank and score from two different algorithms used to search the protein database. Worksheet 2 shows the sequence coverage, peptide matches, number of mass values searched and the RMS error. Worksheet 3 shows the gel image with spot identifier numbers.
Identification summary of the identified proteins in the 48 hr BT474 secretome showing the rank and score from two different algorithms used to search the protein database. Worksheet 2 shows the sequence coverage, peptide matches, number of mass values searched and the RMS error. Worksheet 3 shows the gel image with spot identifier numbers.
Identification summary of the identified proteins in the 48 hr 184A1 secretome showing the rank and score from the MASCOT algorithm used to search the protein database; the gel image with spot identifier numbers; and summary sheets for each protein identification that shows the sequence coverage, peptide matches, number of mass values searched and the RMS error.
Acknowledgments
This work was supported by grants from the National Science Foundation (NSF) CAREER 1053490 and the National Cancer Institute (NCI) R15CA123123. The content is solely the responsibility of the authors and does not necessarily represent the official views of the NSF, the NCI, or the National Institutes of Health. DJK conceived the study, YK performed the proteomic analysis, YW performed exosome validation, CBH performed Western blot validation, DJK and YK analyzed the data, DJK drafted the manuscript, and all authors revised and approved the final version. The authors thank Kisheon Alexander for assistance with data analysis and Jacob Kaiser for assistance with Western blot. The results were presented in accordance with MIAPE guidelines.
Footnotes
The authors declare that they have no financial/commercial conflicts of interest.
References
- Bobrie A, Krumeich S, Reyal F, Recchi C, Moita LF, Seabra MC, Ostrowski M, Thery C. Rab27a supports exosome-dependent and -independent mechanisms that modify the tumor microenvironment and can promote tumor progression. Cancer Res. 2012;72(19):4920–4930. doi: 10.1158/0008-5472.CAN-12-0925. [DOI] [PubMed] [Google Scholar]
- Chang CH, Curtis JD, Maggi LB, Faubert B, Villarino AV, O’Sullivan D, Huang SC, van der Windt GJ, Blagih J, Qiu J, Weber JD, Pearce EJ, Jones RG, Pearce EL. Posttranscriptional control of T cell effector function by aerobic glycolysis. Cell. 2013;153(6):1239–1251. doi: 10.1016/j.cell.2013.05.016. [DOI] [PMC free article] [PubMed] [Google Scholar]
- Csete ME, Doyle JC. Reverse engineering of biological complexity. Science. 2002;295(5560):1664–1669. doi: 10.1126/science.1069981. [DOI] [PubMed] [Google Scholar]
- Goentoro LA, Reeves GT, Kowal CP, Martinelli L, Schupbach T, Shvartsman SY. Quantifying the Gurken morphogen gradient in Drosophila oogenesis. Dev Cell. 2006;11(2):263–272. doi: 10.1016/j.devcel.2006.07.004. [DOI] [PMC free article] [PubMed] [Google Scholar]
- Greaves M, Maley CC. Clonal evolution in cancer. Nature. 2012;481(7381):306–313. doi: 10.1038/nature10762. [DOI] [PMC free article] [PubMed] [Google Scholar]
- Haller MF, Saltzman WM. Localized delivery of proteins in the brain: can transport be customized? Pharm Res. 1998;15(3):377–385. doi: 10.1023/a:1011911912174. [DOI] [PubMed] [Google Scholar]
- Hanahan D, Weinberg RA. Hallmarks of cancer: the next generation. Cell. 2011;144(5):646–674. doi: 10.1016/j.cell.2011.02.013. [DOI] [PubMed] [Google Scholar]
- Henningsen J, Rigbolt KT, Blagoev B, Pedersen BK, Kratchmarova I. Dynamics of the skeletal muscle secretome during myoblast differentiation. Mol Cell Proteomics. 2010;9(11):2482–2496. doi: 10.1074/mcp.M110.002113. [DOI] [PMC free article] [PubMed] [Google Scholar]
- Herrmann F, Lehr HA, Drexler I, Sutter G, Hengstler J, Wollscheid U, Seliger B. HER-2/neu-mediated regulation of components of the MHC class I antigen-processing pathway. Cancer Res. 2004;64(1):215–220. doi: 10.1158/0008-5472.can-2522-2. [DOI] [PubMed] [Google Scholar]
- Hollstein M, Sidransky D, Vogelstein B, Harris CC. p53 mutations in human cancers. Science. 1991;253(5015):49–53. doi: 10.1126/science.1905840. [DOI] [PubMed] [Google Scholar]
- Hsu PP, Sabatini DM. Cancer cell metabolism:Warburg and beyond. Cell. 2008;134:703–707. doi: 10.1016/j.cell.2008.08.021. [DOI] [PubMed] [Google Scholar]
- Huang DW, Sherman BT, Lempicki RA. Bioinformatics enrichment tools: paths toward the comprehensive functional analysis of large gene lists. Nucleic Acids Res. 2009a;37(1):1–13. doi: 10.1093/nar/gkn923. [DOI] [PMC free article] [PubMed] [Google Scholar]
- Huang DW, Sherman BT, Lempicki RA. Systematic and integrative analysis of large gene lists using DAVID bioinformatics resources. Nat Protoc. 2009b;4(1):44–57. doi: 10.1038/nprot.2008.211. [DOI] [PubMed] [Google Scholar]
- Kicheva A, Pantazis P, Bollenbach T, Kalaidzidis Y, Bittig T, Julicher F, Gonzalez-Gaitan M. Kinetics of morphogen gradient formation. Science. 2007;315(5811):521–525. doi: 10.1126/science.1135774. [DOI] [PubMed] [Google Scholar]
- Klinke DJ. Signal Transduction Networks in Cancer: Quantitative Parameters Influence Network Topology. Cancer Res. 2010;70(5):1773–1782. doi: 10.1158/0008-5472.CAN-09-3234. [DOI] [PMC free article] [PubMed] [Google Scholar]
- Klinke DJ. An evolutionary perspective on anti-tumor immunity. Front Oncol. 2013;2:202. doi: 10.3389/fonc.2012.00202. [DOI] [PMC free article] [PubMed] [Google Scholar]
- Kulasingam V, Diamandis EP. Proteomics analysis of conditioned media from three breast cancer cell lines: a mine for biomarkers and therapeutic targets. Mol Cell Proteomics. 2007;6(11):1997–2011. doi: 10.1074/mcp.M600465-MCP200. [DOI] [PubMed] [Google Scholar]
- Kulkarni YM, Klinke DJ. Protein-based identification of quantitative trait loci associated with malignant transformation in two HER2+ cellular models of breast cancer. Proteome Sci. 2012;10(1):11. doi: 10.1186/1477-5956-10-11. [DOI] [PMC free article] [PubMed] [Google Scholar]
- Kulkarni YM, Suarez V, Klinke DJ. Inferring predominant pathways in cellular models of breast cancer using limited sample proteomic profiling. BMC Cancer. 2010;10:291. doi: 10.1186/1471-2407-10-291. [DOI] [PMC free article] [PubMed] [Google Scholar]
- Kulkarni YM, Chambers E, McGray AJ, Ware JS, Bramson JL, Klinke DJ. A quantitative systems approach to identify paracrine mechanisms that locally suppress immune response to Interleukin-12 in the B16 melanoma model. Integr Biol (Camb) 2012;4(8):925–936. doi: 10.1039/c2ib20053h. [DOI] [PMC free article] [PubMed] [Google Scholar]
- Lasfargues EY, Coutinho WG, Redfield ES. Isolation of two human tumor epithelial cell lines from solid breast carcinomas. J Natl Cancer Inst. 1978;61(4):967–978. [PubMed] [Google Scholar]
- Logozzi M, De Milito A, Lugini L, Borghi M, Calabro L, Spada M, Perdicchio M, Marino ML, Federici C, Iessi E, Brambilla D, Venturi G, Lozupone F, Santinami M, Huber V, Maio M, Rivoltini L, Fais S. High levels of exosomes expressing CD63 and caveolin-1 in plasma of melanoma patients. PLoS ONE. 2009;4(4):e5219. doi: 10.1371/journal.pone.0005219. [DOI] [PMC free article] [PubMed] [Google Scholar]
- Makawita S, Smith C, Batruch I, Zheng Y, Ruckert F, Grutzmann R, Pilarsky C, Gallinger S, Diamandis EP. Integrated proteomic profiling of cell line conditioned media and pancreatic juice for the identification of pancreatic cancer biomarkers. Mol Cell Proteomics. 2011;10(10) doi: 10.1074/mcp.M111.008599. M111.008599. [DOI] [PMC free article] [PubMed] [Google Scholar]
- Maruyama T, Mimura K, Sato E, Watanabe M, Mizukami Y, Kawaguchi Y, Ando T, Kinouchi H, Fujii H, Kono K. Inverse correlation of HER2 with MHC class I expression on oesophageal squamous cell carcinoma. Br J Cancer. 2010;103(4):552–559. doi: 10.1038/sj.bjc.6605772. [DOI] [PMC free article] [PubMed] [Google Scholar]
- Masuda ES, Luo Y, Young C, Shen M, Rossi AB, Huang BC, Yu S, Bennett MK, Payan DG, Scheller RH. Rab37 is a novel mast cell specific GTPase localized to secretory granules. FEBS Lett. 2000;470(1):61–64. doi: 10.1016/s0014-5793(00)01288-6. [DOI] [PubMed] [Google Scholar]
- Mathivanan S, Fahner CJ, Reid GE, Simpson RJ. ExoCarta 2012: database of exosomal proteins, RNA and lipids. Nucleic Acids Res. 2012;40(Database issue):D1241–1244. doi: 10.1093/nar/gkr828. [DOI] [PMC free article] [PubMed] [Google Scholar]
- Matsushita H, Vesely MD, Koboldt DC, Rickert CG, Uppaluri R, Magrini VJ, Arthur CD, White JM, Chen YS, Shea LK, Hundal J, Wendl MC, Demeter R, Wylie T, Allison JP, Smyth MJ, Old LJ, Mardis ER, Schreiber RD. Cancer exome analysis reveals a T-cell-dependent mechanism of cancer immunoediting. Nature. 2012;482(7385):400–404. doi: 10.1038/nature10755. [DOI] [PMC free article] [PubMed] [Google Scholar]
- Merlo LM, Pepper JW, Reid BJ, Maley CC. Cancer as an evolutionary and ecological process. Nat Rev Cancer. 2006;6(12):924–935. doi: 10.1038/nrc2013. [DOI] [PubMed] [Google Scholar]
- Mostafavi S, Ray D, Warde-Farley D, Grouios C, Morris Q. GeneMANIA: a real-time multiple association network integration algorithm for predicting gene function. Genome Biol. 2008;9(Suppl 1):S4. doi: 10.1186/gb-2008-9-s1-s4. [DOI] [PMC free article] [PubMed] [Google Scholar]
- Ong SE, Blagoev B, Kratchmarova I, Kristensen DB, Steen H, Pandey A, Mann M. Stable isotope labeling by amino acids in cell culture, SILAC, as a simple and accurate approach to expression proteomics. Mol Cell Proteomics. 2002;1(5):376–386. doi: 10.1074/mcp.m200025-mcp200. [DOI] [PubMed] [Google Scholar]
- Ong SE, Kratchmarova I, Mann M. Properties of 13C-substituted arginine in stable isotope labeling by amino acids in cell culture (SILAC) J Proteome Res. 2003;2(2):173–181. doi: 10.1021/pr0255708. [DOI] [PubMed] [Google Scholar]
- Pavlou MP, Dimitromanolakis A, Diamandis EP. Coupling proteomics and transcriptomics in the quest of subtype-specific proteins in breast cancer. Proteomics. 2013;13(7):1083–1095. doi: 10.1002/pmic.201200526. [DOI] [PubMed] [Google Scholar]
- Peinado H, Ale?kovi? M, Lavotshkin S, Matei I, Costa-Silva B, Moreno-Bueno G, Hergueta-Redondo M, Williams C, Garcia-Santos G, Ghajar C, Nitadori-Hoshino A, Hoffman C, Badal K, Garcia BA, Callahan MK, Yuan J, Martins VR, Skog J, Kaplan RN, Brady MS, Wolchok JD, Chapman PB, Kang Y, Bromberg J, Lyden D. Melanoma exosomes educate bone marrow progenitor cells toward a pro-metastatic phenotype through MET. Nat Med. 2012;18(6):883–891. doi: 10.1038/nm.2753. [DOI] [PMC free article] [PubMed] [Google Scholar]
- Pleasance ED, Cheetham RK, Stephens PJ, McBride DJ, Humphray SJ, Greenman CD, Varela I, Lin ML, Ordonez GR, Bignell GR, Ye K, Alipaz J, Bauer MJ, Beare D, Butler A, Carter RJ, Chen L, Cox AJ, Edkins S, Kokko-Gonzales PI, Gormley NA, Grocock RJ, Haudenschild CD, Hims MM, James T, Jia M, Kingsbury Z, Leroy C, Marshall J, Menzies A, Mudie LJ, Ning Z, Royce T, Schulz-Trieglaff OB, Spiridou A, Stebbings LA, Szajkowski L, Teague J, Williamson D, Chin L, Ross MT, Campbell PJ, Bentley DR, Futreal PA, Stratton MR. A comprehensive catalogue of somatic mutations from a human cancer genome. Nature. 2010;463(7278):191–196. doi: 10.1038/nature08658. [DOI] [PMC free article] [PubMed] [Google Scholar]
- Raposo G, Stoorvogel W. Extracellular vesicles: exosomes, microvesicles, and friends. J Cell Biol. 2013;200(4):373–383. doi: 10.1083/jcb.201211138. [DOI] [PMC free article] [PubMed] [Google Scholar]
- Ratajczak J, Miekus K, Kucia M, Zhang J, Reca R, Dvorak P, Ratajczak MZ. Embryonic stem cell-derived microvesicles reprogram hematopoietic progenitors: evidence for horizontal transfer of mRNA and protein delivery. Leukemia. 2006;20(5):847–856. doi: 10.1038/sj.leu.2404132. [DOI] [PubMed] [Google Scholar]
- Reisinger V, Eichacker LA. Solubilization of Membrane Protein Complexes for blue Native PAGE. J Proteomics. 2008;71:277–283. doi: 10.1016/j.jprot.2008.05.004. [DOI] [PubMed] [Google Scholar]
- Schulze WX, Mann M. A novel proteomic screen for peptide-protein interactions. J Biol Chem. 2004;279(11):10756–10764. doi: 10.1074/jbc.M309909200. [DOI] [PubMed] [Google Scholar]
- Sepiashvili L, Hui A, Ignatchenko V, Shi W, Su S, Xu W, Huang SH, O’Sullivan B, Waldron J, Irish JC, Perez-Ordonez B, Liu FF, Kislinger T. Potentially novel candidate biomarkers for head and neck squamous cell carcinoma identified using an integrated cell line-based discovery strategy. Mol Cell Proteomics. 2012;11(11):1404–1415. doi: 10.1074/mcp.M112.020933. [DOI] [PMC free article] [PubMed] [Google Scholar]
- Shvartsman SY. Quantitative analysis of developing tissues. AIChE J. 2005;51(5):1312–1318. [Google Scholar]
- Simpson RJ, Mathivanan S. Extracellular microvesicles: the need for internationally recognized nomenclature and stringent purification criteria. J Proteomics Bioinform. 2012;5:2. [Google Scholar]
- Slamon DJ, Leyland-Jones B, Shak S, Fuchs H, Paton V, Bajamonde A, Fleming T, Eiermann W, Wolter J, Pegram M, Baselga J, Norton L. Use of chemotherapy plus a monoclonal antibody against HER2 for metastatic breast cancer that overexpresses HER2. N Engl J Med. 2001;344:783–792. doi: 10.1056/NEJM200103153441101. [DOI] [PubMed] [Google Scholar]
- Sokolova V, Ludwig AK, Hornung S, Rotan O, Horn PA, Epple M, Giebel B. Characterisation of exosomes derived from human cells by nanoparticle tracking analysis and scanning electron microscopy. Colloids Surf B Biointerfaces. 2011;87(1):146–150. doi: 10.1016/j.colsurfb.2011.05.013. [DOI] [PubMed] [Google Scholar]
- Srirajaskanthan R, Caplin ME, Waugh MG, Watkins J, Meyer T, Hsuan JJ, Beaumont NJ. Identification of Mac-2-binding protein as a putative marker of neuroendocrine tumors from the analysis of cell line secretomes. Mol Cell Proteomics. 2010;9(4):656–666. doi: 10.1074/mcp.M900401-MCP200. [DOI] [PMC free article] [PubMed] [Google Scholar]
- Stenmark H. Rab GTPases as coordinators of vesicle traffic. Nat Rev Mol Cell Biol. 2009;10(8):513–525. doi: 10.1038/nrm2728. [DOI] [PubMed] [Google Scholar]
- Sukumar M, Liu J, Ji Y, Subramanian M, Crompton JG, Yu Z, Roychoudhuri R, Palmer DC, Muranski P, Karoly ED, Mohney RP, Klebanoff CA, Lal A, Finkel T, Restifo NP, Gattinoni L. Inhibiting glycolytic metabolism enhances CD8+ T cell memory and antitumor function. J Clin Invest. 2013;123(10):4479–4488. doi: 10.1172/JCI69589. [DOI] [PMC free article] [PubMed] [Google Scholar]
- Taylor DD, Gercel-Taylor C. MicroRNA signatures of tumor-derived exosomes as diagnostic biomarkers of ovarian cancer. Gynecol Oncol. 2008;110(1):13–21. doi: 10.1016/j.ygyno.2008.04.033. [DOI] [PubMed] [Google Scholar]
- Thery C, Boussac M, Veron P, Ricciardi-Castagnoli P, Raposo G, Garin J, Amigorena S. Proteomic analysis of dendritic cell-derived exosomes: a secreted subcellular compartment distinct from apoptotic vesicles. J Immunol. 2001;166(12):7309–7318. doi: 10.4049/jimmunol.166.12.7309. [DOI] [PubMed] [Google Scholar]
- Thery C. Exosomes: secreted vesicles and intercellular communications. F1000 Biol Rep. 2011;3:15. doi: 10.3410/B3-15. [DOI] [PMC free article] [PubMed] [Google Scholar]
- Thiele EW. Relation between catalytic activity and size of particle. Ind Eng Chem. 1939;31(7):916–920. [Google Scholar]
- Thurber GM, Zajic SC, Wittrup KD. Theoretic criteria for antibody penetration into solid tumors and micrometastases. J Nucl Med. 2007;48(6):995–999. doi: 10.2967/jnumed.106.037069. [DOI] [PubMed] [Google Scholar]
- Trempe GL. Human breast cancer in culture. Recent Results Cancer Res. 1976:33–41. doi: 10.1007/978-3-642-81043-5_5. [DOI] [PubMed] [Google Scholar]
- Ullrich O, Stenmark H, Alexandrov K, Huber LA, Kaibuchi K, Sasaki T, Takai Y, Zerial M. Rab GDP dissociation inhibitor as a general regulator for the membrane association of rab proteins. J Biol Chem. 1993;268(24):18143–18150. [PubMed] [Google Scholar]
- Valadi H, Ekstrom K, Bossios A, Sjostrand M, Lee JJ, Lotvall JO. Exosome-mediated transfer of mRNAs and microRNAs is a novel mechanism of genetic exchange between cells. Nat Cell Biol. 2007;9(6):654–659. doi: 10.1038/ncb1596. [DOI] [PubMed] [Google Scholar]
- van der Heiden MG, Cantley LC, Thompson CB. Understanding the Warburg effect: The metabolic requirements of cell proliferation. Science. 2009;324:1029–1033. doi: 10.1126/science.1160809. [DOI] [PMC free article] [PubMed] [Google Scholar]
- van der Pol E, Boing AN, Harrison P, Sturk A, Nieuwland R. Classification, functions, and clinical relevance of extracellular vesicles. Pharmacol Rev. 2012;64(3):676–705. doi: 10.1124/pr.112.005983. [DOI] [PubMed] [Google Scholar]
- Warburg O. On the origins of cancer cells. Science. 1956;123(3191):309–314. doi: 10.1126/science.123.3191.309. [DOI] [PubMed] [Google Scholar]
- Wolski WE, Lalowski M, Jungblut P, Reinert K. Calibration of mass spectrometric peptide mass fingerprint data without specific external or internal calibrants. BMC Bioinformatics. 2005;6:203. doi: 10.1186/1471-2105-6-203. [DOI] [PMC free article] [PubMed] [Google Scholar]
- Wu CC, Hsu CW, Chen CD, Yu CJ, Chang KP, Tai DI, Liu HP, Su WH, Chang YS, Yu JS. Candidate serological biomarkers for cancer identified from the secretomes of 23 cancer cell lines and the human protein atlas. Mol Cell Proteomics. 2010;9(6):1100–1117. doi: 10.1074/mcp.M900398-MCP200. [DOI] [PMC free article] [PubMed] [Google Scholar]
- Xue H, Lu B, Lai M. The cancer secretome: a reservoir of biomarkers. J Transl Med. 2008;6:52. doi: 10.1186/1479-5876-6-52. [DOI] [PMC free article] [PubMed] [Google Scholar]
- Yakoub D, Keun HC, Goldin R, Hanna GB. Metabolic profiling detects field effects in nondysplastic tissue from esophageal cancer patients. Cancer Res. 2010;70(22):9129–9136. doi: 10.1158/0008-5472.CAN-10-1566. [DOI] [PubMed] [Google Scholar]
- Yu X, Harris SL, Levine AJ. The regulation of exosome secretion: a novel function of the p53 protein. Cancer Res. 2006;66(9):4795–4801. doi: 10.1158/0008-5472.CAN-05-4579. [DOI] [PubMed] [Google Scholar]
- Zhang HG, Zhuang X, Sun D, Liu Y, Xiang X, Grizzle WE. Exosomes and immune surveillance of neoplastic lesions: a review. Biotech Histochem. 2012;87(3):161–168. doi: 10.3109/10520291003659042. [DOI] [PMC free article] [PubMed] [Google Scholar]
Associated Data
This section collects any data citations, data availability statements, or supplementary materials included in this article.
Supplementary Materials
Identification summary of the identified proteins in the 48 hr SKBR3 secretome showing the rank and score from two different algorithms used to search the protein database. Worksheet 2 shows the sequence coverage, peptide matches, number of mass values searched and the RMS error. Worksheet 3 shows the gel image with spot identifier numbers.
This supplemental PDF file contains:
Fig. S1. Three biological replicates of 2DE map of SKBR3 secretome.
Fig. S2. Three biological replicates of 2DE map of BT474 secretome.
Fig. S3. Two technical replicates of 2DE map of 184A1 secretome.
Fig. S4. Protein-protein interaction network inferred from proteins identified in SKBR3 secretome.
Fig. S5. Protein-protein interaction network inferred from proteins identified in BT474 secretome.
Fig. S6. Significant canonical pathways enriched in the BT474 and SKBR3 secretomes.
Table S1. Proteins identified in 184A1 secretome.
Identification summary of the identified proteins in the 0 hr SKBR3 secretome showing the rank and score from two different algorithms used to search the protein database. Worksheet 2 shows the sequence coverage, peptide matches, number of mass values searched and the RMS error. Worksheet 3 shows the gel image with spot identifier numbers.
Identification summary of the identified proteins in the 0 hr BT474 secretome showing the rank and score from two different algorithms used to search the protein database. Worksheet 2 shows the sequence coverage, peptide matches, number of mass values searched and the RMS error. Worksheet 3 shows the gel image with spot identifier numbers.
Identification summary of the identified proteins in the 48 hr BT474 secretome showing the rank and score from two different algorithms used to search the protein database. Worksheet 2 shows the sequence coverage, peptide matches, number of mass values searched and the RMS error. Worksheet 3 shows the gel image with spot identifier numbers.
Identification summary of the identified proteins in the 48 hr 184A1 secretome showing the rank and score from the MASCOT algorithm used to search the protein database; the gel image with spot identifier numbers; and summary sheets for each protein identification that shows the sequence coverage, peptide matches, number of mass values searched and the RMS error.