Abstract
Chemical exchange saturation transfer (CEST) MRI holds great promise for imaging pH. However, routine CEST measurement varies not only with pH-dependent chemical exchange rate but also with CEST agent concentration, providing pH-weighted information. Conventional ratiometric CEST imaging normalizes the confounding concentration factor by analyzing the relative CEST effect from different exchangeable groups, requiring CEST agents with multiple chemically distinguishable labile proton sites. Recently, an RF power-based ratiometric CEST MRI approach has been developed for concentration-independent pH MRI using CEST agents with a single exchangeable group. To facilitate quantification and optimization of the new ratiometric analysis, we quantitated RF power-based ratiometric CEST ratio (rCESTR) and derived its signal-to-noise and contrast-to-noise ratio. Using creatine as a representative CEST agent containing a single exchangeable site, our study demonstrated that optimized RF power-based ratiometric analysis provides good pH sensitivity. We showed that rCESTR follows a base-catalyzed exchange relationship with pH independent of creatine concentration. The pH accuracy of RF power-based ratiometric MRI was within 0.15–0.20 pH unit. Furthermore, absolute exchange rate can be obtained from the proposed ratiometric analysis. To summarize, RF power-based ratiometric CEST analysis provides concentration-independent pH-sensitive imaging and complements conventional multiple labile proton groups-based ratiometric CEST analysis.
Keywords: chemical exchange saturation transfer (CEST), MRI, pH, quantitative CEST analysis (qCEST), ratiometric CEST analysis
1. Introduction
Chemical exchange saturation transfer (CEST) MRI is sensitive to dilute CEST agents and physiochemical properties, and has been increasingly applied in vivo (1–5). Specifically, the CEST effect is sensitive to the exchange rate, which is often pH-dependent, therefore permitting minimally invasive or noninvasive pH imaging (6). Indeed, CEST MRI has been applied to investigate pH change in disorders such as acute stroke and renal injury (7–12). However, in addition to pH dependence, the CEST effect strongly varies with the CEST agent concentration, relaxation rates and experimental conditions, limiting pH specificity of routine CEST MRI (13–20). Conventional ratiometric CEST analysis ratios the CEST effects from different exchangeable groups to simplify pH determination, which, however, requires CEST agents with multiple chemically distinguishable labile proton sites such as 5,6-dihydrouracil and iopamidol (21–29). Recently, RF-power based ratiometric imaging has been developed, enabling concentration-independent pH imaging from CEST agents with a single exchangeable group, alleviating stringent requirements of conventional ratiometric CEST imaging on CEST agent properties (30).
Our work aims to quantitate and optimize the recently proposed RF power-based ratiometric CEST imaging. The dependence of CEST measurement on RF power can be described empirically by two factors: labeling coefficient, which denotes the radio frequency (RF) saturation efficiency of exchangeable protons, and spillover factor, which measures the concomitant direct saturation of bulk water signal (31–36). Because both labeling coefficient and spillover factor depend on RF power level, it is necessary to elucidate the effect of experimental parameters on the RF power-based ratiometric analysis (26). We postulated that RF power-based ratiometric index (rCESTR) can reasonably remove contributions from relaxation and labile proton concentration variables, permitting pH measurement. To achieve this, we derived rCESTR and solved its signal-to-noise ratio (SNR) and contrast-to-noise ratio (CNR). We evaluated the derivations with numerical simulation and further verified it experimentally using concentration and pH CEST phantoms. Our results quantitatively described the recently proposed RF power-based ratiometric CEST MRI, aiding its experimental optimization and translation.
2. Theory
The CEST effect can be described by an empirical solution as a multiplication of simplistic CEST effect , labeling coefficient (α) and spillover factor (1-σ) (13):
| [1] |
where ksw is the chemical exchange rate from labile protons to bulk water, fr is labile proton fraction ratio, and R1w is bulk water longitudinal relaxation rate (33,37). We have , where ω1=2πγB1,γ is the gyromagnetic ratio and B1 is the irradiation RF amplitude, and , in which kws=fr·ksw (37). Moreover, r1w,s=R1w,s+kws,sw and r2w,s=R2w,s+kws,sw, respectively. The spillover factor is equal to , where θ=tan−1(ω1/Δωs), rzw=r1w cos2θ/2+r2w sin2θ/2, rzs=r1s cos2θ+r2s sin2θ and Δωs is the labile proton chemical shift.
The RF power-based ratiometric analysis ratios CEST effects obtained under two RF power levels,
| [2] |
where ω1a and ω1b are two RF power levels. Because the simplistic CEST effect term is normalized, rCESTR is sensitive to exchange rate, not the labile proton ratio. For dilute CEST agents with typical relaxation rates, we have p≈R2s+ksw and q≈ksw. rCESTR can be shown to be
| [3] |
In order to solve the exchange rate, we simplified Eq. 3 and showed that
| [4] |
The exchange rate term can be shown to be
| [5] |
, and the exchange rate can be solved as
| [6] |
We also derived the SNR and CNR of the proposed RF power-based rCESTR index. Briefly, we have previously shown that SNR for CESTR derived from the asymmetry analysis is (38)
| [7] |
where SNRI0 is SNR of the control image without RF irradiation. For the RF power-based ratiometric analysis, its SNR can be derived based on error propagation theory (Appendix) and we have
| [8] |
and
| [9] |
The standard deviation of the pH-sensitive rCESTR contrast (ΔrCESTR) can be derived as,
| [10] |
where pHa and pHb refer to two pH values of interest. The contrast to noise ratio (CNR) can be shown to be
| [11] |
Eq. 11 decouples CNR into rCNR and SNR(I0). rCNR largely depends on CEST effect under the influence of parameters such as RF irradiation level and duration. In addition, SNR(I0) mainly depends on parameters such as TR, TE, flip angle, number of average, field strength and voxel size etc.
3. Materials and methods
Phantom
Two phantoms were prepared with creatine and phosphate buffer solution. For the pH phantom, the creatine concentration was fixed to 60 mM while its pH was titrated to 5.99, 6.48, 6.75, 7.02 and 7.24 (EuTech Instrument, Singapore). For the concentration phantom, we varied creatine concentration from 100, 80, 60, 40 to 20 mM, and titrated their pH to 6.75. The solution was transferred into centrifuge tubes and inserted into two separate phantom containers. The containers were then filled with 1% low gelling point agarose solution and solidified at room temperature to fixate the creatine-PBS tubes.
Simulation
CEST MRI effect was simulated using the Bloch-McConnell 2-pool exchange model in Matlab (Mathworks, Natick MA), as described previously (31). We assumed typical T1w and T2w of 2 s and 100 ms, and T1s and T2s of 1s and 15 ms, respectively, with the labile proton chemical shift of 1.9 ppm at 4.7 T. Exchange rate was varied from 20 to 1,000 s−1 (20). In addition, to elucidate the SNR and CNR dependence upon selection of RF power levels, we simulated rCESTR with RF irradiation levels from 0 to 4 µT.
MRI
All images were obtained from a 4.7 T MRI scanner (Bruker Biospec, Billerica, MA). We collected single-shot echo planar imaging (EPI) with an acquisition bandwidth of 200 kHz. We chose a slice thickness of 5 mm, field of view (FOV) of 76×76 mm and imaging matrix of 64×64. We acquired CEST MRI with continuous wave (CW) RF irradiation applied at ±1.9 ppm (± 375 Hz at 4.7 Tesla) from the bulk water resonance, in addition to a control scan without RF irradiation (repetition time (TR)/echo time (TE)=22,000/28 ms, time of saturation (TS) =10,000 ms, number of average (NSA)=2). The RF power level was varied from 0.3 to 3 µT: from 0.3 to 1 µT with an increment step of 0.1 µT, followed by 1.25, 1.5, 1.75, 2, 2.5 and 3 µT. In addition, T1-weighted inversion recovery MRI was obtained with inversion intervals (TI) from 250 to 10,000 ms (recovery time/TE =12s/28 ms, NSA=2). T2-weighted MRI was acquired using spin echo images with TE from 50 to 500 ms (TR=12s, NSA=2) (39). The B0 map was obtained using phase images with off-centered echo time of 1, 3, 5 and 7 ms. The B1 field was calibrated by varying the pre-pulse flip angle (θ) from 10 to 180°, with intervals of 10°.
Data Processing
Data were processed in Matlab (Mathworks, Natick, MA). The T1 map was obtained by least-squares fitting of the signal (I) as a function of the inversion time (I=I0⌊1−(1+η)e−TI/T1⌋), where η is the inversion efficiency and I0 is the equilibrium signal. The T2 map was derived by fitting the signal intensity as a function of TE, I0e−TI/T1. B0 map was derived by fitting the phase map (φ) against the echo time shift (Δτ) using , where γ is the gyromagnetic ratio. The magnetic field was highly homogeneous, with ΔB0 being 5 ± 5 Hz and 2 ± 4 Hz for the pH and concentration phantoms, respectively. B1 field was calibrated by fitting the image intensity using I(θ) = I0 · |cosγ (η·B1+ΔB1)·τ|, where ΔB1 and η are the offset and scaling factor, respectively. We found ΔB1=−0.21 and η=1.02. The RF power irradiation level for CEST MRI was calibrated, being 0.1, 0.2, 0.3, 0.4, 0.5, 0.6, 0.7, 0.8, 1.0, 1.3, 1.5, 1.8, 2.3 and 2.7 µT. CEST effect was calculated by taking the difference of reference (Iref) and labels scans (Ilabel), normalized by the control scan without RF irradiation
| [12] |
Results were reported as mean ± standard deviation, and P values less than 0.05 were considered statistically significant.
4. Results
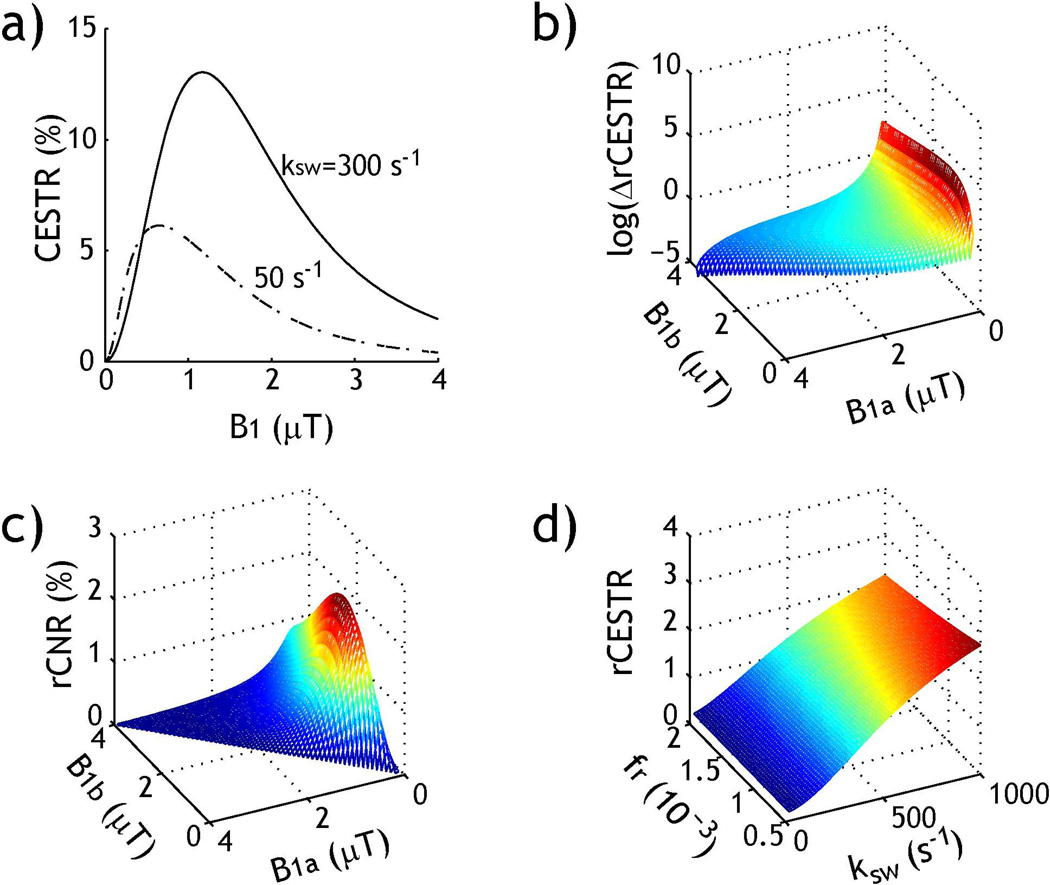
Fig. 1 shows simulated rCESTR as a function of labile proton ratio and exchange rate. Briefly, Fig. 1a shows CEST effect calculated from the asymmetry analysis as a function of B1 for two representative exchange rates of 50 (dashed dotted) and 300 s−1 (solid). CESTR initially increases with B1 due to more efficient RF saturation, but decreases at higher RF power level because of concomitant direct saturation (spillover) of the bulk water signal. Fig. 1b shows rCESTR contrast between two exchange rates under varied B1 levels (ΔrCESTR). For simplicity, we assumed B1a is stronger than B1b. Because CESTR is small under weak irradiation levels, ΔrCESTR peaks when taking the ratio of CESTR obtained under a pair of weak and strong B1 levels. Because of the broad range of ΔrCESTR, we showed logarithm of ΔrCESTR in Fig. 1b. It is necessary to note that the relative CNR (rCNR=CNR/SNRI0) has to be considered when optimizing the RF power-based ratiometric MRI. Fig. 1c shows that simulated rCNR as a function of B1 level up to 4 µT. rCNR reasonably plateaus under two moderate B1 levels, being around 0.5–1 and 1.5–2.5 µT, respectively. rCESTR was simulated for a range of labile proton concentration (1:2000 to 1:500) and exchange rate (20 to 1000 s−1), assuming two typical B1 of 0.5 and 2 µT. Fig. 1d shows rCESTR strongly depends on exchange rate with little change with labile proton ratio.
Fig. 1.
Simulation of RF power-based rCEST analysis. a) Routine asymmetry analysis (i.e., CESTR) as a function of B1 level for two representative exchange rates. b) Logarithm of rCESTR contrast (ΔrCESTR) as a function of B1 level. c) Relative contrast to noise ratio (rCNR) of rCESTR as a function of B1 level. d) Simulated rCESTR under typical B1 levels of 0.5 and 2 µT for representative labile proton ratio and exchange rate.
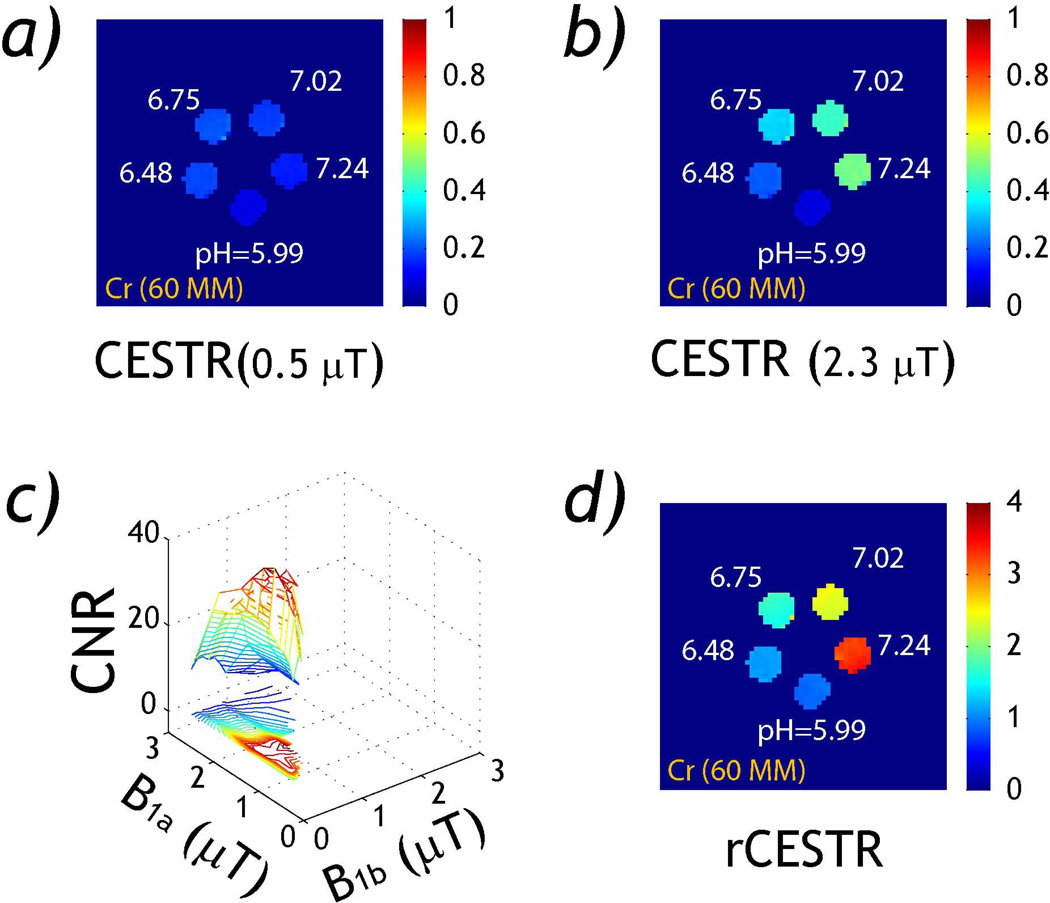
Fig. 2 evaluates the RF power-based ratiometric CEST MRI measurement in the pH phantom. Figs. 2a and 2b show CESTR maps obtained under RF power levels of 0.5 and 2.3 µT. Notably, CESTR appears slightly hyperintense for intermediate pH values under 0.5 µT, while CESTR for higher pH vials substantially increased at 2.3 µT. This is because a weak RF power of 0.5 µT is inefficient to saturate relatively fast exchangeable protons at high pH, leading to a small labeling coefficient. The saturation efficiency substantially increases for B1 of 2.3 µT, resulting in stronger CEST effect at high pH (Fig. 2b). Fig. 2c evaluates the CNR between pH compartments of 5.99 and 7.24 as a function of RF power levels. We found CNR peaks when taking the ratio of CESTR maps obtained using a moderately weak (~0.5 µT) and an intermediate RF power (~2.3 µT) levels. Although we used CNR in Fig. 2c while we showed simulated rCNR in Fig. 1c, they displayed similar trend. Fig. 2d shows rCESTR map obtained under optimal B1 levels, showing consistent increase with pH.
Fig. 2.
rCESTR analysis in a pH CEST phantom. a) CESTR map (B1=0.5 µT). b) CESTR map (B1=2.3 µT). c) CNR between pH of 5.99 and 7.24. d) rCESTR map (B1a=2.3 and B1b=0.5 µT).
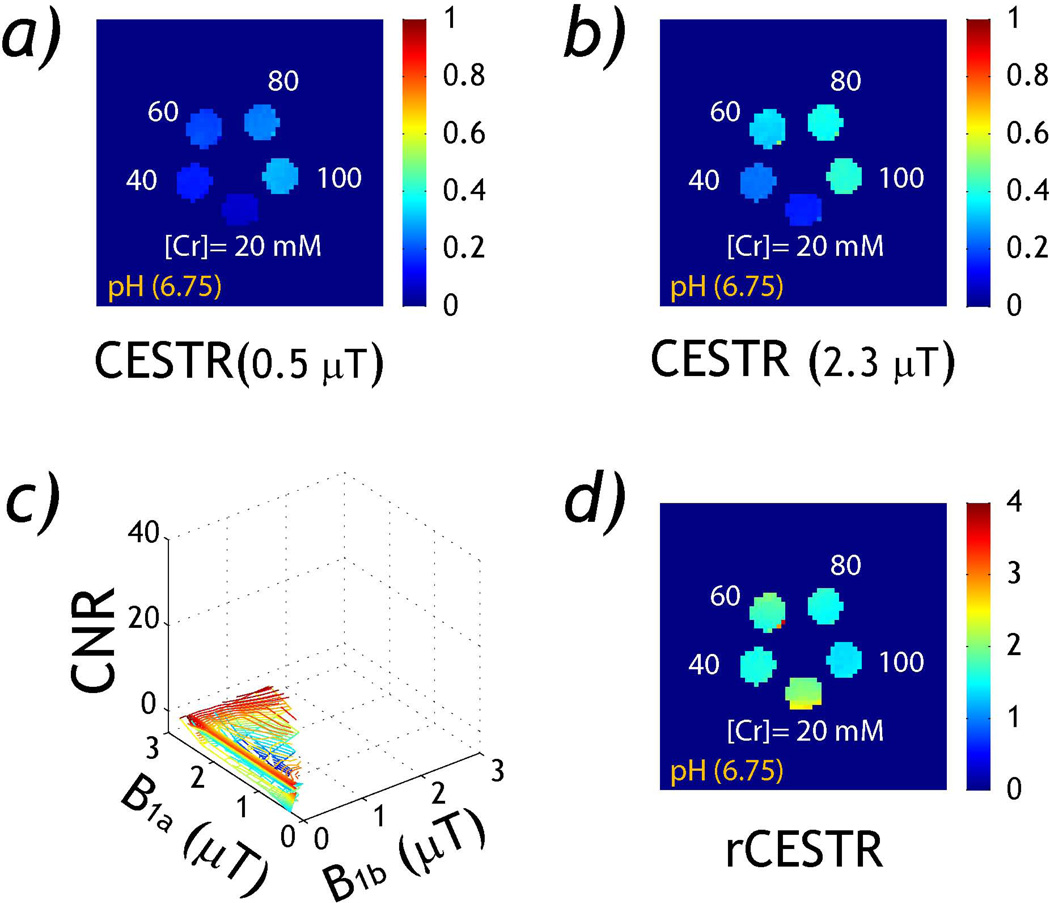
Fig. 3 evaluates the RF power-based ratiometric CEST MRI measurement in the creatine concentration phantom. Figs. 3a and 3b show CESTR maps for RF powers of 0.5 and 2.3 µT. Notably, CESTR appears relatively hyperintense for the vial of the highest creatine concentration, and CESTR increased substantially when RF power was increased from 0.5 to 2.3 µT. This is because all vials were titrated to the same pH, resulting in similar exchange rate and hence labeling coefficient. As a result, CESTR increased with labile proton concentration. Because rCESTR normalizes the confounding CEST agent concentration factor, there was little contrast between different creatine concentration vials. Fig. 3c evaluates the CNR between 20 and 100 mM creatine vials, which showed little dependence with RF power levels. Using the optimal RF power levels determined from pH phantom, rCESTR map (Fig. 3d) shows little change with creatine concentration.
Fig. 3.
rCESTR analysis in a concentration CEST phantom. a) CESTR map (B1=0.5 µT). b) CESTR map (B1=2.3 µT). c) CNR between 20 and 100 mM creatine vials. d) rCESTR map (B1a=2.3 and B1b=0.5 µT).
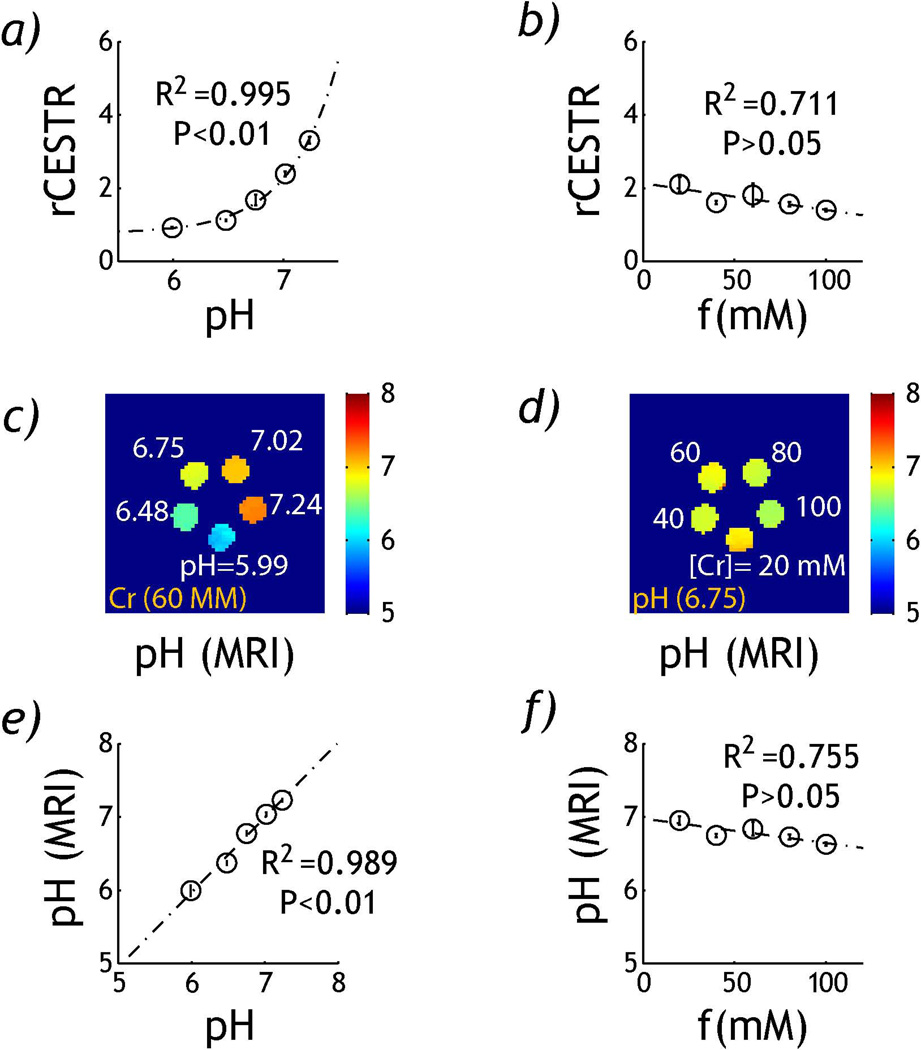
Fig. 4 compares rCESTR as a function of pH and creatine concentration from in vitro MRI measurement. Specifically, Fig. 4a shows that rCESTR increases with pH, following a base-catalyzed relationship, being rCESTR=0.76+0.87·10pH-6.76 (dash dotted line). The base-catalyzed fitting was in good agreement with rCESTR measurement, suggesting dominantly base-catalyzed amine proton exchange rate (P<0.01, linear regression t-test). In comparison, rCESTR showed little change with creatine concentration, being rCESTR =−0.007*[Cr]+2.13, where [Cr] is creatine concentration in mM (Fig. 4b). Importantly, no significant correlation between rCESTR and creatine concentration was found (P>0.05, linear regression t-test). Using the relationship between rCESTR and pH determined from Fig. 4a, pH map was derived for the pH (Fig. 4c) and concentration phantom (Fig. 4d). Fig. 4e shows pH derived from RF power-based ratiometric analysis strongly correlates with pH (P<0.01, linear regression t-test) while it showed non-significant correlation with creatine concentration (P>0.05, Fig. 4f, linear regression t-test). Particularly, for the pH phantom, pHMRI was within 0.11 pH unit from titrated pH values while for the creatine concentration phantom, pHMRI accuracy was within 0.20 pH unit.
Fig. 4.
Comparison of rCESTR from pH and concentration phantoms. a) rCESTR as a function of pH. b) rCESTR as a function of creatine concentration. c) pH map determined from rCESTR map of the pH phantom. d) pH map determined from rCESTR map of the concentration phantom. e) Regression analysis between pH determined from rCEST MRI (pHMRI) with titrated pH for the pH phantom. f) Regression analysis between pHMRI with creatine concentration for the creatine concentration phantom.
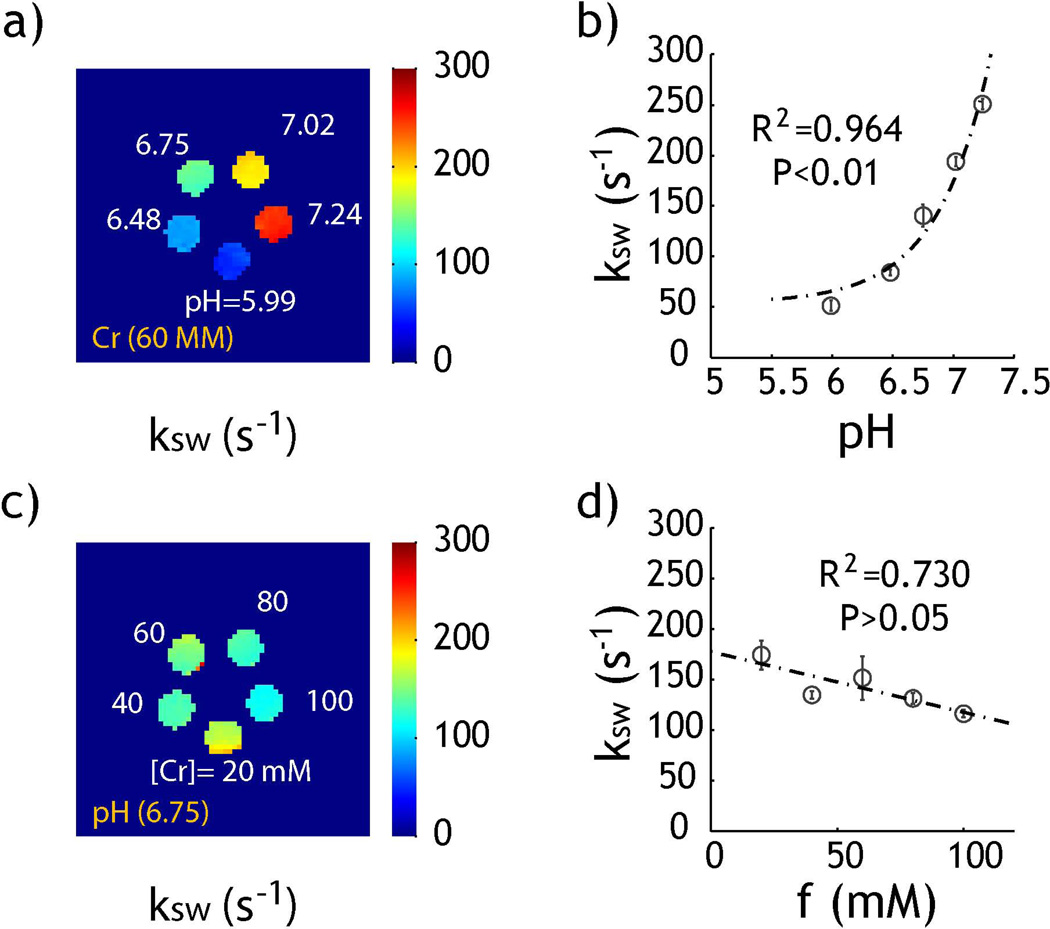
Fig. 5 shows the exchange rate derived from RF power-based ratiometric CEST MRI measurement. The bulk water T1 and T2 were obtained by extrapolating relaxation time as a function of creatine concentration, being 3.0 and 1.9 s, respectively. Fig. 5a shows that exchange rate determined from Eq. 7 for the pH phantom increases with pH, consistent with the fact that creatine amine proton chemical exchange is dominantly base-catalyzed. Fig. 5b shows that the exchange rate as a function of pH can be described by ksw=54+1.16·10pH-4.98 (R2=0.964, P<0.01, linear regression t-test). In comparison, exchange rate determined from the concentration phantom had very little change with creatine concentration (Fig. 5c). Fig. 5d shows that the exchange rate among different creatine concentration was not statistically significant (P>0.05, linear regression t-test). Indeed, the exchange rate was 140 s−1 from the pH compartment of 6.75 at 60 mM, in good agreement with the exchange rate of 142±22 s−1, determined from the concentration phantom with creatine concentration varied from 20 to 100 mM (pH=6.75).
Fig. 5.
Derivation of exchange rate from rCESTR analysis. a) Exchange rate map for the pH phantom. b) Exchange rate can be described by a dominantly base-catalyzed chemical exchange relationship. c) Exchange rate map for the creatine concentration phantom. d) Exchange rate as a function of creatine concentration.
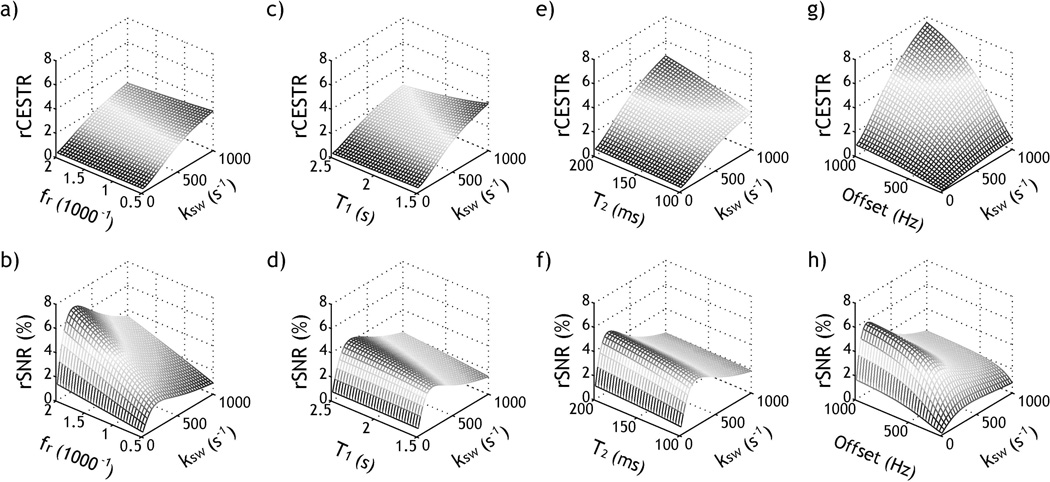
Fig. 6 evaluates the simulated effects of labile proton ratio, relaxation rate and labile proton offset on the RF power-based rCESTR analysis. We assumed two B1 levels of 0.5 and 2 µT with typical fr=1:1000, δ=400 Hz (2 ppm at 4.7 T), T1w and T2w of 2 and 0.1 s, and T1s and T2s of 1s and 15 ms respectively, and one parameter was varied for each simulation (labile proton ratio and offset, T1w and T2w). Although CESTR approximately increases linearly with the labile proton ratio, Fig. 6a shows that rCESTR decreases slightly with labile proton ratio from 1:2000 to 1:500, with the relative rCESTR difference from that of the median fr being from −10 to 12%. This is because the increase of experimental factor (i.e., α*(1-σ)) with respect to labile proton ratio is faster under dilute CEST concentration (40). Fig. 6b shows that SNR increases substantially with labile proton ratio due to higher raw CEST effect. Interestingly, SNR peaks at an intermediate exchange rate of 200 s−1 due to the choice of two moderate RF power levels (0.5 and 2 µT), and the dependence of rCESTR upon labile proton exchange rate and chemical shift is further investigated in Fig. 7. In addition, Fig. 6c shows that rCESTR decreases slightly with T1w, with the relative rCESTR difference from that of the median T1w being from −28 to 20% for T1w between 2.5 and 1.5 s. This is because the experimental factor and hence rCESTR decreases slightly with T1w. As such, T1 normalization could allow enhanced pH determination. Briefly, we calculated T1-corrected pH using first order correction of , where j refers to jth pH or creatine concentration. We showed slightly more accurate pH determination, within 0.15 instead of 0.20 pH unit (data not shown). Importantly, SNR increases substantially with T1 due to increased CEST effect at long T1 (Fig. 6d). Fig. 6e shows that rCESTR slightly increases with T2w, with the relative difference from −25% to 19% for T2w between 100 and 200 ms, with slightly increased SNR (Fig. 6f). This is because the RF spillover effect is less at longer T2, resulting in higher magnitude and sensitivity of ratiometric CEST MRI. Moreover, we showed that rCESTR increases substantially with labile proton offset, with the relative difference varying from −85% to 42% for offset from 200 to 1000 Hz. Similarly, SNR increases at large labile proton offset due to less concomitant direct RF saturation effect.
Fig. 6.
Investigation of rCESTR sensitivity. a) rCESTR as a function of labile proton ratio and exchange rate. b) rSNR as a function of labile proton ratio and exchange rate. c) rCESTR as a function of T1w and exchange rate. d) rSNR as a function of T1w and exchange rate. e) rCESTR as a function of T2w and exchange rate. f) rSNR as a function of T2w and exchange rate. g) rCESTR as a function of labile proton offset and exchange rate. h) rSNR as a function of labile proton offset and exchange rate.
Fig. 7.
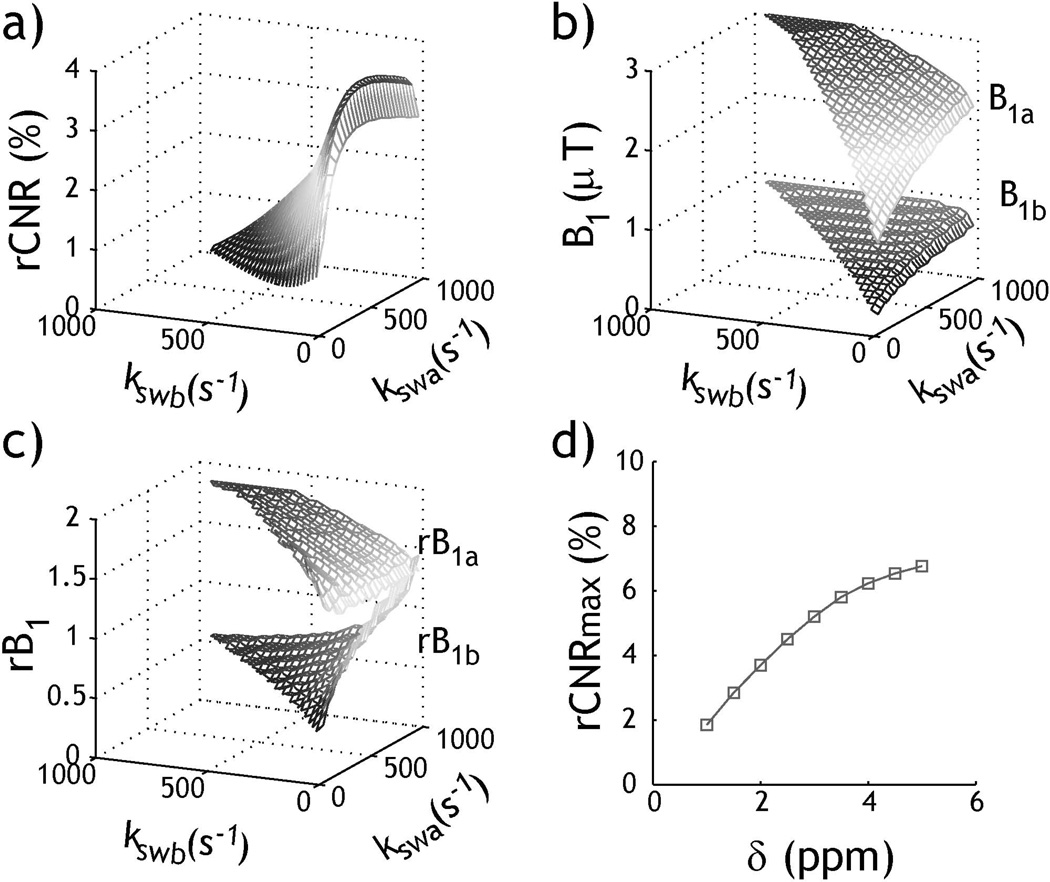
Optimization of rCESTR MRI. a) Numerically derived peak rCNR for exchange rates from 20 to 1000 s−1 (T1w/T2w=2s/100ms, δs=2 ppm at 4.7 Tesla). b) Simulated optimal B1 levels for peak rCNR. c) Optimal B1 levels for peak rCNR normalized by optimal B1 levels for each exchange rate independently. d) Peak rCNR as a function of chemical shift.
5. Discussion
Our study demonstrated that the RF-power based ratiometric CEST analysis provides a simple concentration-independent pH-sensitive MRI index. It relieves the limitation of conventional ratiometric CEST MRI that is only applicable to CEST agents containing multiple chemically distinguishable labile proton sites. By elucidating the magnitude and sensitivity of RF-power based ratiometric CEST MRI, our work aids its experimental optimization and quantification, particularly important for in vivo translation.
The proposed rCESTR solution advances prior quantitative CEST (qCEST) analysis. For example, quantification of exchange rate with saturation power (QUESP), time (QUEST), and time with ratiometric analysis (QUESTRA) have been demonstrated (16,32,41). Because these results are sensitive to labile proton ratio-weighted exchange rate, their specificity may be limited without knowledge of CEST agent concentration. We have previously shown that RF power (RFP)-CEST analysis enables delineation of labile proton ratio from exchange rate, which, however, requires multi-parameter non-linear fitting (20). We recently showed that the RF spillover effect can be estimated, the correction of which improves precision of omega plot analysis for quantification of diamagnetic CEST agents (40,41). Modified linear analysis methods have also been developed to estimate fast chemical exchange rate, providing simple alternatives (42). However, these modified quantitative CEST analysis requires reasonable estimation of bulk water relaxation rates and regression analysis. In comparison, the RF power-based ratiometric CEST analysis only requires ratioing CEST measurements obtained under two different RF power levels, which provides a pH-sensitive index that is simple to use yet reasonably accurate.
Although it takes one B1 level to optimize routine CEST imaging, the RF power-based ratiometric CEST effect depends on two RF power levels, which are related to not only the pH contrast (i.e. ΔrCESTR) but also rCESTR and CESTR of each pH compartment (Eq. 11). Because analytical solution of two optimal RF power levels requires multi-parameter optimization, and the boundary conditions such as the maximally applicable B1 level have to be considered, we solved the optimal power levels with numerical simulation. To demonstrate this, we simulated rCESTR MRI for exchange rate from 20 to 1000 s−1 at 4.7T, assuming typical T1w and T2w of 2 s and 100 ms, respectively. Fig. 7a shows that the simulated peak rCNR increases with the difference between two exchange rates. Fig. 7b plots the numerically-derived optimal B1 levels under which peak rCNR was obtained for a pair of exchange rates. Interestingly, B1a consistently increased with exchange rate while B1b remained relatively constant. On the other hand, optimal B1 level can be derived for each exchange rate independently, which typically increases with exchange rate (13). Fig. 7c shows the numerically simulated optimal B1 levels for peak rCNR normalized by optimal B1 levels for each exchange rate independently, which deviated substantially from unity. This suggests that choice of optimal B1 levels for RF power-based ratiometric CEST MRI aims to maximize SNR and/or CNR of rCESTR, different from conventional CEST MRI that optimizes each exchange rate independently. Because the RF spillover effect decreases at large chemical shift, it results in increased peak rCNR (Fig. 7d). These findings demonstrate the importance of elucidating RF power dependence of rCESTR for optimization of RF power-based ratiometric pH MRI. It is necessary to briefly discuss the effect of field strength on the ratiometric measurement. Because T1 is typically longer at higher field, CEST effect and hence sensitivity of RF power-based ratiometric CEST MRI increase with field strength. Although T2 may decrease somewhat with field strength, labile proton offset in Hz scales linearly with the field strength, resulting in less RF spillover effects and hence higher sensitivity. Furthermore, because SNR of the control image substantially increases with the field strength, it is advantageous to conduct RF power based-ratiometric CEST MRI at high field, as expected.
Our study chose a relatively simple 2-pool exchange model to elucidate the RF power-based ratiometric MRI and demonstrated it in vitro using creatine. Recent studies have investigated creatine CEST imaging in tumor (43) and muscle (44), and chosen it as an in vitro model CEST agent (40,45,46). Because creatine labile proton is relatively close to the bulk water resonance, it is susceptible to RF spillover effect. As such, in vitro demonstration of RF power-based ratiometric CEST MRI using creatine complements our prior work and further demonstrates the generality of the new ratiometric CEST MRI approach. Our in vitro study investigated creatine concentration from 20 to 100 mM, with corresponding labile proton ratio being 1:2000 and 1:400, respectively. This represents cases of dilute and reasonably concentrated CEST agents, which are of tremendous interest to the field of CEST MRI. It is important to point out that although illustrative, in vitro systems are simplistic and there is a lack of semisolid macromolecular magnetization transfer (MT) and nuclear overhauser effects (NOE). Such concomitant effects have to be taken into account when translating RF power-based ratiometric CEST imaging in vivo. For example, Longo et al. showed that in renal pH imaging, the confounding RF irradiation effects could be delineated by monitoring MRI signal difference before and after contrast agent administration (30). In addition, our study used a long saturation time to reach the steady state. It has been shown that TS-dependent CEST effect can be crudely approximated by CESTR(TS) = CESTR(∞)·(1−e−R1ρ·TS), where R1ρ is the spin locking longitudinal relaxation rate and CESTR(∞) is the steady state CEST effect (47,48). Because R1ρ increases with B1, rCESTR at high B1 approaches its steady state more quickly than that of lower B1. This means that rCESTR reaches its steady state more quickly than CESTR. In addition, the SNR and/or CNR approximately follows the time course of rCESTR (i.e., 1−e−R1ρ·TS). As such, moderate saturation time can be used for rCESTR MRI, provided that SNR is sufficient for satisfactory measurement. It is important to note that the endogenous amide proton transfer (APT) MRI effect is relatively weak due to small chemical exchange rate difference during acute stroke, and it remains somewhat challenging to directly apply RF power-based ratiometric imaging to determine tissue pH noninvasively (12,33). As such, development of sensitive acquisition schemes and novel post-processing routines is crucial for further advancing the generalized ratiometric CEST MRI for endogenous pH quantification in diseases such as stroke, tumor, and renal injury (29,45,49–52).
6. Conclusions
Our study demonstrated that RF power-based ratiometric analysis is sensitive to the exchange rate with little dependence on the CEST agent concentration. Using creatine as a representative CEST agent containing a single exchangeable site, we showed that rCESTR MRI provides pH-sensitive imaging with a pH accuracy of within 0.15-0.2 pH unit. We further elucidated the magnitude and sensitivity of rCESTR MRI, aiding its experimental optimization and in vivo translation.
ACKNOWLEDGMENTS
This study was supported in part by grants from NSFC 30930027, local government (Regione Piemonte, PIIMDMT and Nano-IGT projects), FIRB-MIUR projects "RINAME" n° RBAP114AMK, “FIRB08” n° RBFR08R7OU, NIH/NIBIB K01EB009771 and NIH/NINDS 1R01NS083654. We would like to thank Gary Boas for editorial assistance.
Abbreviations
- CEST
Chemical exchange saturation transfer
- CESTR
Chemical exchange saturation transfer ratio
- CNR
Contrast to noise ratio
- qCEST
Quantitative chemical exchange saturation transfer
- rCESTR
Ratiometric CEST ratio
- RF
radio frequency
- SNR
Signal to noise ratio
Appendix
For the recently proposed RF power-based ratiometric CEST index (rCESTR), we have
| [A.1] |
The partial derivative of rCESTR against CESTR obtained at each RF power level can be derived as
| [A.2.a] |
| [A.2.b] |
The standard deviation of rCESTR can be shown to be,
| [A.3] |
The SNR can be shown to be
| [A.4] |
To calculate CNR, we have ΔrCESTR being the difference of rCESTR of two pH values.
| [A.5] |
The standard deviation of ΔrCESTR can be derived as
| [A.6] |
We have
| [A.7] |
For small CEST effect, we have (38) and CNR can be simplified as
| [A.8] |
REFERENCES
- 1.Ward KM, Aletras AH, Balaban RS. A new class of contrast agents for MRI based on proton chemical exchange dependent saturation transfer (CEST) J Magn Reson. 2000;143:79–87. doi: 10.1006/jmre.1999.1956. [DOI] [PubMed] [Google Scholar]
- 2.van Zijl PCM, Yadav NN. Chemical exchange saturation transfer (CEST): What is in a name and what isn't? Magn Reson Med. 2011;65(4):927–948. doi: 10.1002/mrm.22761. [DOI] [PMC free article] [PubMed] [Google Scholar]
- 3.Vinogradov E, Sherry AD, Lenkinski RE. CEST: From basic principles to applications, challenges and opportunities. J Magn Reson. 2013;229(0):155–172. doi: 10.1016/j.jmr.2012.11.024. [DOI] [PMC free article] [PubMed] [Google Scholar]
- 4.Castelli DD, Terreno E, Longo D, Aime S. Nanoparticle-based chemical exchange saturation transfer (CEST) agents. NMR Biomed. 2013;26(7):839–849. doi: 10.1002/nbm.2974. [DOI] [PubMed] [Google Scholar]
- 5.Kim J, Wu Y, Guo Y, Zheng H, Sun PZ. A review of optimization and quantification techniques for chemical exchange saturation transfer (CEST) MRI toward sensitive in vivo imaging. Contrast Media Mol Imaging. 2014 doi: 10.1002/cmmi.1628. in press. [DOI] [PMC free article] [PubMed] [Google Scholar]
- 6.Sun PZ, Sorensen AG. Imaging pH using the chemical exchange saturation transfer (CEST) MRI: correction of concomitant RF irradiation effects to quantify CEST MRI for chemical exchange rate and pH. Magn Reson Med. 2008;60(2):390–397. doi: 10.1002/mrm.21653. [DOI] [PubMed] [Google Scholar]
- 7.Sun PZ, Zhou J, Sun W, Huang J, van Zijl PC. Detection of the ischemic penumbra using pH-weighted MRI. J Cereb Blood Flow Metab. 2007;27(6):1129–1136. doi: 10.1038/sj.jcbfm.9600424. [DOI] [PubMed] [Google Scholar]
- 8.Sun PZ, Cheung JS, Wang EF, Lo EH. Association between pH-weighted endogenous amide proton chemical exchange saturation transfer MRI and tissue lactic acidosis during acute ischemic stroke. J Cereb Blood Flow Metab. 2011;31(8):1743–1750. doi: 10.1038/jcbfm.2011.23. [DOI] [PMC free article] [PubMed] [Google Scholar]
- 9.Chan KWY, Liu G, Song X, Kim H, Yu T, Arifin DR, Gilad AA, Hanes J, Walczak P, van Zijl PCM, Bulte JWM, McMahon MT. MRI-detectable pH nanosensors incorporated into hydrogels for in vivo sensing of transplanted-cell viability. Nat Mater. 2013;12(3):268–275. doi: 10.1038/nmat3525. [DOI] [PMC free article] [PubMed] [Google Scholar]
- 10.Jin T, Wang P, Zong X, Kim S-G. Magnetic resonance imaging of the Amine Proton EXchange (APEX) dependent contrast. NeuroImage. 2012;16(2):1218–1227. doi: 10.1016/j.neuroimage.2011.08.014. [DOI] [PMC free article] [PubMed] [Google Scholar]
- 11.Sun PZ, Wang E, Cheung JS. Imaging acute ischemic tissue acidosis with pH-sensitive endogenous amide proton transfer (APT) MRI – Correction of tissue relaxation and concomitant RF irradiation effects toward mapping quantitative cerebral tissue pH. Neuroimage. 2012;60(1):1–6. doi: 10.1016/j.neuroimage.2011.11.091. [DOI] [PMC free article] [PubMed] [Google Scholar]
- 12.Zhou J, Payen JF, Wilson DA, Traystman RJ, van Zijl PC. Using the amide proton signals of intracellular proteins and peptides to detect pH effects in MRI. Nat Med. 2003;9(8):1085–1090. doi: 10.1038/nm907. [DOI] [PubMed] [Google Scholar]
- 13.Sun PZ, van Zijl PCM, Zhou J. Optimization of the irradiation power in chemical exchange dependent saturation transfer experiments. J Magn Reson. 2005;175(2):193–200. doi: 10.1016/j.jmr.2005.04.005. [DOI] [PubMed] [Google Scholar]
- 14.Terreno E, Dastrù W, Delli Castelli D, Gianolio E, Geninatti Crich S, Longo D, Aime S. Advances in metal-based probes for MR molecular imaging applications. Curr Med Chem. 2010;17(31):3684–3670. doi: 10.2174/092986710793213823. [DOI] [PubMed] [Google Scholar]
- 15.Wu R, Liu C, Liu P, Sun PZ. Improved measurement of labile proton concentration-weighted chemical exchange rate (kws) with experimental factor-compensated and T1-normalized quantitative chemical exchange saturation transfer (CEST) MRI. Contrast Media Mol Imaging. 2012;7(4):384–389. doi: 10.1002/cmmi.505. [DOI] [PMC free article] [PubMed] [Google Scholar]
- 16.Sun PZ. Simplified quantification of labile proton concentration-weighted chemical exchange rate (kws) with RF saturation time dependent ratiometric analysis (QUESTRA): Normalization of relaxation and RF irradiation spillover effects for improved quantitative chemical exchange saturation transfer (CEST) MRI. Magn Reson Med. 2012;67(4):936–942. doi: 10.1002/mrm.23068. [DOI] [PMC free article] [PubMed] [Google Scholar]
- 17.Zaiss M, Bachert P. Exchange-dependent relaxation in the rotating frame for slow and intermediate exchange – modeling off-resonant spin-lock and chemical exchange saturation transfer. NMR Biomed. 2013;26(5):507–518. doi: 10.1002/nbm.2887. [DOI] [PubMed] [Google Scholar]
- 18.Sun PZ. Simultaneous determination of labile proton concentration and exchange rate utilizing optimal RF power: radio frequency power (RFP) dependence of chemical exchange saturation transfer (CEST) MRI. J Magn Reson. 2010;202(2):155–161. doi: 10.1016/j.jmr.2009.10.012. [DOI] [PMC free article] [PubMed] [Google Scholar]
- 19.Zu Z, Janve VA, Li K, Does MD, Gore JC, Gochberg DF. Multi-angle ratiometric approach to measure chemical exchange in amide proton transfer imaging. Magn Reson Med. 2012;68(3):711–719. doi: 10.1002/mrm.23276. [DOI] [PMC free article] [PubMed] [Google Scholar]
- 20.Sun PZ, Wang Y, Xiao G, Wu R. Simultaneous experimental determination of labile proton fraction ratio and exchange rate with irradiation radio frequency power-dependent quantitative CEST MRI analysis. Contrast Media Mol Imaging. 2013;8(3):246–251. doi: 10.1002/cmmi.1524. [DOI] [PMC free article] [PubMed] [Google Scholar]
- 21.Ward KM, Balaban RS. Determination of pH using water protons and chemical exchange dependent saturation transfer (CEST) Magn Reson Med. 2000;44(5):799–802. doi: 10.1002/1522-2594(200011)44:5<799::aid-mrm18>3.0.co;2-s. [DOI] [PubMed] [Google Scholar]
- 22.Ali MM, Liu G, Shah T, Flask CA, Pagel MD. Using Two Chemical Exchange Saturation Transfer Magnetic Resonance Imaging Contrast Agents for Molecular Imaging Studies. Acc Chem Res. 2009;42(7):915–924. doi: 10.1021/ar8002738. [DOI] [PMC free article] [PubMed] [Google Scholar]
- 23.Liu G, Li Y, Sheth VR, Pagel MD. Imaging In Vivo Extracellular pH with a Single Paramagnetic Chemical Exchange Saturation Transfer Magnetic Resonance Imaging Contrast Agent. Molecular Imaging. 2012;11(1):47–57. [PMC free article] [PubMed] [Google Scholar]
- 24.Longo DL, Busato A, Lanzardo S, Antico F, Aime S. Imaging the pH evolution of an acute kidney injury model by means of iopamidol, a MRI-CEST pH-responsive contrast agent. Magn Reson Med. 2012;70(3):859–864. doi: 10.1002/mrm.24513. [DOI] [PubMed] [Google Scholar]
- 25.Longo DL, Dastrù W, Digilio G, Keupp J, Langereis S, Lanzardo S, Prestigio S, Steinbach O, Terreno E, Uggeri F, Aime S. Iopamidol as a responsive MRI-chemical exchange saturation transfer contrast agent for pH mapping of kidneys: In vivo studies in mice at 7 T. Magn Reson Med. 2011;65(1):202–211. doi: 10.1002/mrm.22608. [DOI] [PubMed] [Google Scholar]
- 26.Aime S, Calabi L, Biondi L, Miranda MD, Ghelli S, Paleari L, Rebaudengo C, Terreno E. Iopamidol: Exploring the potential use of a well-established x-ray contrast agent for MRI. Magn Reson Med. 2005;53(4):830–834. doi: 10.1002/mrm.20441. [DOI] [PubMed] [Google Scholar]
- 27.McVicar N, Li AX, Goncalves DF, Bellyou M, Meakin SO, Prado MAM, Bartha R. Quantitative tissue pH measurement during cerebral ischemia using amine and amide concentration-independent detection (AACID) with MRI. J Cereb Blood Flow Metab. 2014;34(4):690–698. doi: 10.1038/jcbfm.2014.12. [DOI] [PMC free article] [PubMed] [Google Scholar]
- 28.Sun PZ, Longo DL, Hu W, Xiao G, Wu R. Quantification of iopamidol multi-site chemical exchange properties for ratiometric chemical exchange saturation transfer (CEST) imaging of pH. Phys Med Biol. 2014;59(16):4493. doi: 10.1088/0031-9155/59/16/4493. [DOI] [PMC free article] [PubMed] [Google Scholar]
- 29.Chen LQ, Howison CM, Jeffery JJ, Robey IF, Kuo PH, Pagel MD. Evaluations of extracellular pH within in vivo tumors using acidoCEST MRI. Magn Reson Med. 2014;72(5):1408–1417. doi: 10.1002/mrm.25053. [DOI] [PMC free article] [PubMed] [Google Scholar]
- 30.Longo DL, Sun PZ, Consolino L, Michelotti FC, Uggeri F, Aime S. A General MRI-CEST Ratiometric Approach for pH Imaging: Demonstration of in Vivo pH Mapping with Iobitridol. J Am Chem Soc. 2014 doi: 10.1021/ja5059313. [DOI] [PMC free article] [PubMed] [Google Scholar]
- 31.Woessner DE, Zhang S, Merritt ME, Sherry AD. Numerical solution of the Bloch equations provides insights into the optimum design of PARACEST agents for MRI. Magn Reson Med. 2005;53(4):790–799. doi: 10.1002/mrm.20408. [DOI] [PubMed] [Google Scholar]
- 32.McMahon M, Gilad A, Zhou J, Sun PZ, Bulte J, van Zijl PC. Quantifying exchange rates in chemical exchange saturation transfer agents using the saturation time and saturation power dependencies of the magnetization transfer effect on the magnetic resonance imaging signal (QUEST and QUESP): Ph calibration for poly-L-lysine and a starburst dendrimer. Magn Reson Med. 2006;55(4):836–847. doi: 10.1002/mrm.20818. [DOI] [PMC free article] [PubMed] [Google Scholar]
- 33.Sun PZ, Zhou J, Huang J, van Zijl P. Simplified quantitative description of amide proton transfer (APT) imaging during acute ischemia. Magn Reson Med. 2007;57(2):405–410. doi: 10.1002/mrm.21151. [DOI] [PubMed] [Google Scholar]
- 34.Li AX, Hudson RHE, Barrett JW, Johns CK, Pasternak SH, Bartha R. Four-pool modeling of proton exchange processes in biological systems in the presence of MRI-paramagnetic chemical exchange saturation transfer (PARACEST) agents. Magn Reson Med. 2008;60(5):1197–1206. doi: 10.1002/mrm.21752. [DOI] [PubMed] [Google Scholar]
- 35.Murase K, Tanki N. Numerical solutions to the time-dependent Bloch equations revisited. Magn Reson Imaging. 2011;29(1):126–131. doi: 10.1016/j.mri.2010.07.003. [DOI] [PubMed] [Google Scholar]
- 36.Sun PZ. Simplified and scalable numerical solution for describing multi-pool chemical exchange saturation transfer (CEST) MRI contrast. J Magn Reson. 2010;205(2):235–241. doi: 10.1016/j.jmr.2010.05.004. [DOI] [PMC free article] [PubMed] [Google Scholar]
- 37.Zhou J, Wilson DA, Sun PZ, Klaus JA, van Zijl PCM. Quantitative description of proton exchange processes between water and endogenous and exogenous agents for WEX, CEST, and APT experiments. Magn Reson Med. 2004;51(5):945–952. doi: 10.1002/mrm.20048. [DOI] [PubMed] [Google Scholar]
- 38.Sun PZ, Lu J, Wu Y, Xiao G, Wu R. Evaluation of the dependence of CEST-EPI measurement on repetition time, RF irradiation duty cycle and imaging flip angle for enhanced pH sensitivity. Phys Med Biol. 2013;58:N229–N240. doi: 10.1088/0031-9155/58/17/N229. [DOI] [PMC free article] [PubMed] [Google Scholar]
- 39.Cheung JS, Wang EF, Zhang XA, Manderville E, Lo EH, Sorensen AG, Sun PZ. Fast radio-frequency enforced steady state (FRESS) spin echo MRI for quantitative T2 mapping: minimizing the apparent repetition time (TR) dependence for fast T2 measurement. NMR Biomed. 2012;25(2):189–194. doi: 10.1002/nbm.1729. [DOI] [PMC free article] [PubMed] [Google Scholar]
- 40.Sun PZ, Wang Y, Dai Z, Xiao G, Wu R. Quantitative chemical exchange saturation transfer (qCEST) MRI - RF spillover effect-corrected omega plot for simultaneous determination of labile proton fraction ratio and exchange rate. Contrast Media Mol Imaging. 2014;9(4):268–275. doi: 10.1002/cmmi.1569. [DOI] [PMC free article] [PubMed] [Google Scholar]
- 41.Dixon TW, Ren J, Lubag A, Ratnakar J, Vinogradov E, Hancu I, Lenkinski RE, Sherry AD. A concentration-independent method to measure exchange rates in PARACEST agents. Magn Reson Med. 2010;63(3):625–632. doi: 10.1002/mrm.22242. [DOI] [PMC free article] [PubMed] [Google Scholar]
- 42.Randtke EA, Chen LQ, Corrales LR, Pagel MD. The Hanes-Woolf linear QUESP method improves the measurements of fast chemical exchange rates with CEST MRI. Magn Reson Med. 2014;71(4):1603–1612. doi: 10.1002/mrm.24792. [DOI] [PMC free article] [PubMed] [Google Scholar]
- 43.Cai K, Singh A, Poptani H, Li W, Yang S, Lu Y, Hariharan H, Zhou XJ, Reddy R. CEST signal at 2 ppm (CEST@2ppm) from Z-spectral fitting correlates with creatine distribution in brain tumor. NMR Biomed. 2015;28(1):1–8. doi: 10.1002/nbm.3216. [DOI] [PMC free article] [PubMed] [Google Scholar]
- 44.Kogan F, Haris M, Singh A, Cai K, Debrosse C, Nanga RPR, Hariharan H, Reddy R. Method for high-resolution imaging of creatine in vivo using chemical exchange saturation transfer. Magn Reson Med. 2014;71(1):164–172. doi: 10.1002/mrm.24641. [DOI] [PMC free article] [PubMed] [Google Scholar]
- 45.Zaiss M, Xu J, Goerke S, Khan IS, Singer RJ, Gore JC, Gochberg DF, Bachert P. Inverse Z-spectrum analysis for spillover-, MT-, and T1-corrected steady-state pulsed CEST-MRI – application to pH-weighted MRI of acute stroke. NMR Biomed. 2014;27(3):240–252. doi: 10.1002/nbm.3054. [DOI] [PMC free article] [PubMed] [Google Scholar]
- 46.Goerke S, Zaiss M, Bachert P. Characterization of creatine guanidinium proton exchange by water-exchange (WEX) spectroscopy for absolute-pH CEST imaging in vitro. NMR Biomed. 2014;27(5):507–518. doi: 10.1002/nbm.3086. [DOI] [PubMed] [Google Scholar]
- 47.Zaiss M, Bachert P. Chemical exchange saturation transfer (CEST) and MR Z-spectroscopy in vivo: a review of theoretical approaches and methods. Phys Med Biol. 2013;58(22):221–269. doi: 10.1088/0031-9155/58/22/R221. [DOI] [PubMed] [Google Scholar]
- 48.Jin T, Kim S-G. Advantages of chemical exchange-sensitive spin-lock (CESL) over chemical exchange saturation transfer (CEST) for hydroxyl– and amine–water proton exchange studies. NMR Biomed. 2014;27(11):1313–1324. doi: 10.1002/nbm.3191. [DOI] [PMC free article] [PubMed] [Google Scholar]
- 49.Zu Z, Li K, Janve VA, Does MD, Gochberg DF. Optimizing pulsed-chemical exchange saturation transfer imaging sequences. Magn Reson Med. 2011;66(4):1100–1108. doi: 10.1002/mrm.22884. [DOI] [PMC free article] [PubMed] [Google Scholar]
- 50.Sun PZ, Wang Y, Lu J. Sensitivity-enhanced chemical exchange saturation transfer (CEST) MRI with least squares optimization of Carr Purcell Meiboom Gill multi-echo echo planar imaging. Contrast Media Mol Imaging. 2014;9(2):177–181. doi: 10.1002/cmmi.1546. [DOI] [PMC free article] [PubMed] [Google Scholar]
- 51.Xu J, Zaiss M, Zu Z, Li H, Xie J, Gochberg DF, Bachert P, Gore JC. On the origins of chemical exchange saturation transfer (CEST) contrast in tumors at 9.4 T. NMR Biomed. 2014;27(4):406–416. doi: 10.1002/nbm.3075. [DOI] [PMC free article] [PubMed] [Google Scholar]
- 52.Sheth VR, Li Y, Chen LQ, Howison CM, Flask CA, Pagel MD. Measuring in vivo tumor pHe with CEST-FISP MRI. Magn Reson Med. 2012;67(3):760–768. doi: 10.1002/mrm.23038. [DOI] [PMC free article] [PubMed] [Google Scholar]


