Background: The primary function of the abundant and highly conserved protein TCTP is not clear.
Results: TCTP binds to a conserved central acidic region of eukaryotic elongation factor 1Bα/β/δ.
Conclusion: The binding of TCTP to eukaryotic elongation factor 1B is evolutionarily conserved.
Significance: The interaction with eEF1B represents a primary function of TCTP.
Keywords: Guanine Nucleotide Exchange Factor (GEF), Nuclear Magnetic Resonance (NMR), Protein Structure, Protein-Protein Interaction, Translation Elongation Factor, HADDOCK, Eukaryotic Elongation Factor 1B (eEF1B), Translationally Controlled Tumor Protein (TCTP)
Abstract
Translationally controlled tumor protein (TCTP) is an abundant protein that is highly conserved in eukaryotes. However, its primary function is still not clear. Human TCTP interacts with the metazoan-specific eukaryotic elongation factor 1Bδ (eEF1Bδ) and inhibits its guanine nucleotide exchange factor (GEF) activity, but the structural mechanism remains unknown. The interaction between TCTP and eEF1Bδ was investigated by NMR titration, structure determination, paramagnetic relaxation enhancement, site-directed mutagenesis, isothermal titration calorimetry, and HADDOCK docking. We first demonstrated that the catalytic GEF domain of eEF1Bδ is not responsible for binding to TCTP but rather a previously unnoticed central acidic region (CAR) domain in eEF1Bδ. The mutagenesis data and the structural model of the TCTP-eEF1Bδ CAR domain complex revealed the key binding residues. These residues are highly conserved in eukaryotic TCTPs and in eEF1B GEFs, including the eukaryotically conserved eEF1Bα, implying the interaction may be conserved in all eukaryotes. Interactions were confirmed between TCTP and the eEF1Bα CAR domain for human, fission yeast, and unicellular photosynthetic microalgal proteins, suggesting that involvement in protein translation through the conserved interaction with eEF1B represents a primary function of TCTP.
Introduction
Translationally controlled tumor protein (TCTP),3 also named fortilin, histamine release factor, and p23, is a 20–25-kDa, highly conserved, and abundantly and ubiquitously expressed protein with growth- and immunity-related functions in eukaryotic cells (1–8). TCTP participates in these physiological functions via interactions with a large number of different proteins. However, many of these functions presumably only occur in limited species because the corresponding TCTP-binding partners are not well conserved in eukaryotes. For example, it was demonstrated recently that TCTP directly interacts with p53 forming a negative feedback loop (9); but p53 does not exist in plants and lower eukaryotes, although TCTP is conserved. Therefore, this function, although important in humans, clearly does not represent the primary cellular function of TCTP. Among the TCTP functions reported in the literature, one candidate for the primary function of TCTP is its involvement in protein translation by interaction with the eukaryotic elongation factor 1 (eEF1) complex (10–12), because the eEF1 complex is conserved in all eukaryotes.
The eukaryotic elongation factor 1 (eEF1) complex is responsible for transporting the aminoacyl tRNA to the ribosome during protein synthesis (13, 14). The complex consists of a G-protein named eEF1A responsible for delivering the aminoacyl tRNA to the ribosome in its GTP-bound active state, and a guanine nucleotide exchange factor (GEF) complex named eEF1B (Fig. 1). The eEF1B complex is composed of one or two GEFs (EF1Bα exists in all eukaryotes, eEF1Bδ exists only in metazoans, and eEF1Bβ exists only in plants), a scaffold component named eEF1Bγ, and a valine-tRNA synthetase additionally in metazoans. All GEFs in eEF1B share a highly conserved C-terminal catalytic GEF domain, although their N-terminal domains are less conserved and are responsible for binding with other eEF1B components (13, 14). The structures of the catalytic domain of human eEF1Bα and the yeast eEF1A-eEF1Bα complex have been reported (15–17), which reveals that a C-terminal lysine residue is the key residue for releasing GDP from eEF1A. Sequence analysis indicated that eEF1Bδ contains three domains as follows: the N-terminal domain (residues 1–153), the central acidic region (CAR) domain (residues 153–192) (pfam10587 in PFAM database), and the C-terminal catalytic GEF domain (residues 192–281). Previous studies indicate that TCTP physically interacts with the C-terminal region (CAR-GEF region; residues 153–281) of eEF1Bδ and inhibits its GEF activity (10, 11).
FIGURE 1.
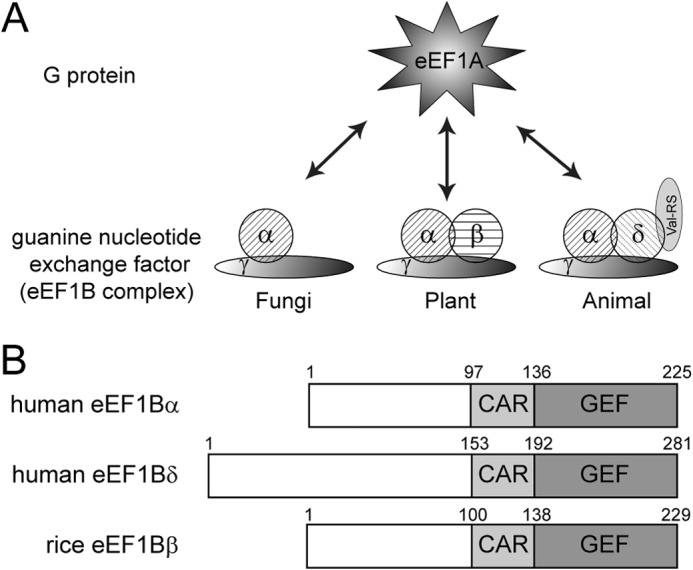
eEF1 complex. A, schematic representation of the composition of the eEF1 complex in various species. B, domain organization of various eEF1B GEFs.
Although the three-dimensional structures of TCTP homologues from different species have been solved and are shown to be highly conserved (6, 18–22), there are few reports giving structural information regarding the interaction of TCTP with its partner proteins. Furthermore, as indicated by Bommer and Thiele (5), additional very careful work is required to establish the complete array of molecular interactions of TCTP because TCTP frequently appears as an “interacting protein” in two-hybrid screens. Here, by employing various structural techniques, including NMR titration, chemical shift mapping, paramagnetic relaxation enhancement, and HADDOCK docking, as well as isothermal titration calorimetry (ITC) and site-directed mutagenesis, we identified the binding interfaces and key residues in the interaction between TCTP and eEF1Bδ. We found that TCTP unexpectedly binds to the previously unnoticed CAR domain (residues 153–192), instead of the C-terminal catalytic GEF domain of eEF1Bδ. The CAR domain is conserved in all eEF1B GEFs and is structurally independent from the GEF domain. The key residues for the interaction identified in TCTP are highly conserved in eukaryotes, and those in eEF1Bδ are conserved not only in metazoan eEF1Bδ but also in eEF1Bα as well as plant eEF1Bβ, suggesting a conserved interaction between TCTP and eEF1B GEFs. The interaction between eEF1Bα and TCTP of human, fission yeast, and unicellular photosynthetic microalgae was further confirmed, which demonstrates that the interaction of TCTP and the eEF1 complex is conserved in eukaryotes. The results in this study imply that involvement in protein translation is one of the primary cellular functions of TCTP.
EXPERIMENTAL PROCEDURES
Protein Expression and Purification
The gene of full-length human eEF1Bδ was cloned into the pGEX-6P-1 expression vector. The recombinant eEF1Bδ protein containing an N-terminal GST tag was expressed in Escherichia coli BL21 (DE3). Cells were grown at 37 °C, and the protein expression was induced for 3 h with 0.4 mm isopropyl β-d-thiogalactopyranoside when the absorbance at 600 nm reached 0.7–0.8. The cells were harvested by centrifugation at 4800 × g at 4 °C for 30 min. The cell pellets were resuspended in buffer A (20 mm Tris-HCl, pH 7.5, 200 mm NaCl) and stored at −20 °C overnight. After cell lysis by thawing and ultrasonication, the lysate was centrifuged, and the supernatant was applied onto a GST column (GE Healthcare) and washed with buffer B (140 mm NaCl, 2.7 mm KCl, 10 mm Na2HPO4, 1.8 mm KH2PO4, 2.0 mm urea, pH 7.2). The proteins were eluted with buffer C (50 mm Tris-HCl, pH 8.0, 500 mm NaCl) containing 10 mm reduced glutathione and 1 mm dl-dithiothreitol (DTT). After that, the protein was purified by gel filtration chromatography using a Superdex G200 column (GE Healthcare), with buffer C containing 1 m urea to avoid severe aggregation. During the whole purification process, protease inhibitor mixture (Calbiochem) was added according to the manual, and all experiments were carried out at low temperature.
The N-terminal domain (residues 1–153), CAR domain (residues 153–192), catalytic GEF domain (residues 192–281), and a fragment containing the CAR domain plus GEF domain (CAR-GEF region; residues 153–281) of human eEF1Bδ were cloned into a modified pET28a expression vector, with a His-tagged GB1 domain followed by a PreScission protease cleavage site at the N terminus. All eEF1Bδ domains (except the N-terminal domain) were purified by a similar protocol. The proteins were first purified using a Ni2+ column (chelating Sepharose Fast Flow), and then were digested with PreScission protease. The digested product was applied onto the Ni2+ column again. Flow-through solutions containing desired proteins were collected, concentrated, and further purified by gel filtration chromatography using a Superdex 75 column (GE Healthcare). The eEF1Bδ N-terminal domain was expressed mainly in inclusion bodies, and the yield purified from the supernatant was quite low. To purify sufficient eEF1Bδ N-terminal domain, 8 m urea was added into buffer A to resuspend the inclusion bodies. After Ni2+-affinity purification, the eluted fraction was dialyzed to remove urea and imidazole, then concentrated, and further purified by gel filtration. Circular dichroism spectroscopy was used to confirm its refolding (as for proteins purified from the supernatant). The purified protein was collected and digested with 2 mg of PreScission protease, and then a Ni2+ column was used again to separate eEF1Bδ N-terminal domain from GB1 domain.
The human eEF1Bα CAR domain (residues 97–136) and the CAR-GEF region (residues 97–225) were cloned into a modified pET28a expression vector, with a His-tagged SMT3 protein in the N terminus instead of the GB1 domain. These domains were purified by a protocol similar to that in the previous paragraph, except that the His-tagged SMT3 protein was removed by digestion with ULP1 protease.
Wild-type human TCTP was expressed and purified as reported previously (6). The construction of different mutants of the eEF1Bδ CAR domain and TCTP (except the TCTP mutants for paramagnetic relaxation enhancement (PRE) experiments) was carried out by the QuikChange method (23). After PCR with mutagenic primers, DpnI was added to digest the methylated nonmutated parental template. The product was transformed into E. coli TOP10 competent cells. The purification of mutant proteins was similar to that of the wild-type proteins. For the TCTP mutants used in PRE experiments, including C172S, C28S/C172S, C28S/C172S/T116C, C28S/C172S/A127C, and C28S/C172S/D143C, the coding sequence of mutant TCTP was cloned into pET11a or pET30a expression vector without any tag. After expression in E. coli BL21 (DE3), the cells were resuspended in buffer A without NaCl. After cell lysis and centrifugation, the lysate was loaded onto a DEAE column. The mutant TCTP was eluted with 150 mm NaCl. The eluate was dialyzed to remove NaCl followed by Q-Sepharose high performance column (GE Healthcare) purification. The mutant TCTP was eluted with a gradient of NaCl concentrations from 50 to 300 mm. The eluate was concentrated and further purified using a Superdex 75 gel filtration column.
TCTP, eEF1Bα CAR domain, and the CAR-GEF region from fission yeast Schizosaccharomyces pombe and photosynthetic microalga Nannochloropsis oceanica IMET1 were cloned into pET30a for protein expression. The same procedure was used for expression and purification of these two proteins. The plasmid was transformed into E. coli BL21(DE3). Cells were grown at 37 °C, and the protein expression was induced for 5 h with 0.5 mm isopropyl β-d-thiogalactopyranoside when the absorbance at 600 nm reached 1.0. The proteins were first purified using a Ni2+ column (chelating Sepharose Fast Flow) and further purified by gel filtration chromatography using a Superdex 75 column (GE Healthcare). The buffer for gel filtration and final protein storage was 50 mm sodium phosphate buffer, pH 7.0, containing 200 mm KCl, 5 mm DTT, and 5 mm EDTA.
Peptides EDDDIDLFGSDNE, DLFGS, and LFG were synthesized by Sangon Biotech (Shanghai, China). 15N- and 15N-13C-labeled proteins were prepared using the same procedures except cells were grown in M9 minimal media containing 15NH4Cl and [13C]glucose as the sole nitrogen and carbon sources, respectively.
NMR Spectroscopy
NMR experiments were performed at 298 K on Bruker DMX, AVANCE, and Agilent DD2 600 MHz NMR spectrometers equipped with cryo-probes. All NMR samples contained 0.2–0.8 mm 15N- or 15N/13C-labeled protein in 20 mm Tris-HCl, pH 7.5, 200 mm NaCl, 0.01% 2,2-dimethyl-2-silapentane-5-sulfonate, and 10% (v/v) D2O.
Two-dimensional 1H-15N and 1H-13C HSQC and three-dimensional CBCA(CO)NH, HNCACB, HNCO, HN(CA)CO, HBHA(CO)NH, HBHANH, HCCH-TOCSY, CCH-COSY, and CCH-TOCSY experiments were performed for backbone and side chain assignments of the eEF1Bδ CAR domain in free and TCTP-bound states. Three-dimensional 1H-15N and 1H-13C NOESY-HSQC spectra with mixing times of 300 ms were collected to generate distance restraints. All data were processed with FELIX (Accelrys Inc.) or NMRPipe (24) and analyzed with NMRViewJ (25).
Heteronuclear steady-state 1H-15N NOE experiments and CLEANEX-PM experiments (26) were performed using standard pulse programs. Samples of 15N-labeled human eEF1Bδ CAR-GEF region in free and TCTP-bound states were used in the experiments. The mixing times for CLEANEX-PM experiments ranged from 5 to 500 ms, and the data acquired using short mixing times (5, 10, 15 and 20 ms) were used to estimate the amide-water exchange rates.
Paramagnetic Relaxation Enhancement Experiments
PRE experiments were performed using proteins labeled with 1-oxyl-2,2,5,5-tetramethyl-Δ3-pyrroline-3-methyl methanethiosulfonate (MTSL) (Toronto Research Chemicals, Toronto, Canada) on one free cysteine. Native cysteines on the surface of proteins were mutated to serine to avoid undesired MTSL labeling. The eEF1Bδ CAR domain contains no cysteines, whereas TCTP contains two cysteines, Cys-28p and Cys-172p. (The residues and the mutants of human eEF1Bδ and TCTP are designated by a subscripted suffix δ and p for eEF1Bδ and TCTP, respectively, e.g. Pro-150 of eEF1Bδ will be represented as Pro-150δ, and the C172S mutant of TCTP will be represented as C172Sp.) Because the two cysteines are far away from the binding surface, the C28S/C172S double mutant of TCTP was used in the PRE experiments without interfering with the interaction. Different TCTP or eEF1Bδ cysteine mutants were incubated with MTSL for 16 h at 25 °C in nonreducing buffer, and excess MTSL was removed by dialysis against 20 mm Tris-HCl buffer, pH 7.5, 200 mm NaCl for 6 h at 4 °C. Spin-labeled protein was added to other 15N-labeled protein for NMR experiments. The reduced compound was generated by incubation with 1.5 mm ascorbic acid for 1 h at 25 °C. The two-dimensional 1H-15N HSQC spectra of 15N-labeled proteins were acquired at a 1:1 molar ratio in the oxidized and reduced states (27).
Structural Calculations
The structures of the eEF1Bδ CAR domain in the free and TCTP-bound states were initially calculated with the program CYANA (28), and then refined using CNS (29) and RECOORDScript (30) in explicit water with manual assignments. Backbone dihedral angle restraints obtained using TALOS+ (31) and hydrogen bond restraints of the α-helix were also incorporated into the structural calculation in the later stages of refinement. From 100 initial structures, 50 lowest energy conformers were selected for refinement in explicit water, and the 20 lowest energy conformers represent the final ensemble of structures. The quality of the structural analysis and related statistics were obtained using the programs MOLMOL (32) and PROCHECK-NMR (33). The structures have been deposited in the Protein Data Bank with accession codes 2MVM and 2MVN for the eEF1Bδ CAR domain in free and TCTP-bound states, respectively.
HADDOCK Docking
The structure of the TCTP-eEF1Bδ CAR domain complex was calculated on the HADDOCK webserver (34). The x-ray structure of TCTP (Protein Data Bank code 1YZ1) and NMR structure of TCTP-bound eEF1Bδ CAR domain were used as the starting structures. The CSP data were used to construct the ambiguous constraints of the binding surface. PRE and mutagenesis constraints were used as unambiguous constraints. PRE constraints were derived from the PRE data of MTSL-labeled T116Cp, A127Cp, D143Cp, K169Cδ, E177Cδ, and K186Cδ. Mutagenesis constraints were set up for residues whose mutation caused significant changes in the binding (site I, Ile-92p, Met-96p, Met-115p, Ala-118p, Ile-122p, Leu-159δ, and Phe-160δ; site II, Phe-83p, Met-140p, and Tyr-182δ). During the calculation, residues 155–165 of eEF1B were set to be fully flexible.
NMR Titration Experiments
The concentration of 15N-labeled proteins in all titration experiments was 0.1–0.3 mm. The concentration of stock solution of ligands was 1–5 mm in the same buffer. All experiments were performed at 25 °C in 20 mm Tris-HCl buffer, pH 7.5, 200 mm NaCl, except for the high salt experiment which contained 400 mm NaCl. The values of chemical shift perturbations (CSP) were calculated using Equation 1,
 |
where ΔHN and ΔN are the changes in 1HN and 15N chemical shifts, respectively.
The equilibrium dissociation constants (KD) were estimated by fitting the observed CSPs Equation 2
 |
where CSPmax is the CSP at the theoretical saturated condition obtained from the fit; r is the molar ratio of ligand to protein; Cpro is the concentration of initial protein solution; and Clig is the stock concentration of ligand.
Isothermal Titration Calorimetry
ITC measurements were performed on an iTC-200 calorimeter (MicroCal Inc.). All experiments were carried out in 20 mm Tris-HCl buffer, pH 7.5, 200 mm NaCl. 0.05–0.1 mm TCTP was placed in the 200-μl sample chamber, and eEF1Bδ CAR domain (2 mm) or eEF1Bδ CAR-GEF region (1 mm) in the syringe was added in 20 successive additions of 2 μl each taking 4 s (with an initial injection of 0.5 μl). The interval between each injection lasted 150 s. Control experiments were performed under identical conditions to determine the heat signals that arise from addition of the eEF1Bδ into the buffer. Data were fitted using the single-site binding model within the Origin software package (MicroCal Inc.). To determine the heat capacity change ΔCp, ITC experiments were carried out at 10, 15, 20, 25, and 30 °C. The ΔCp value was estimated by linear fitting of the ΔH values obtained against temperature.
RESULTS
CAR Domain of eEF1Bδ Is the Region Responsible for TCTP Binding
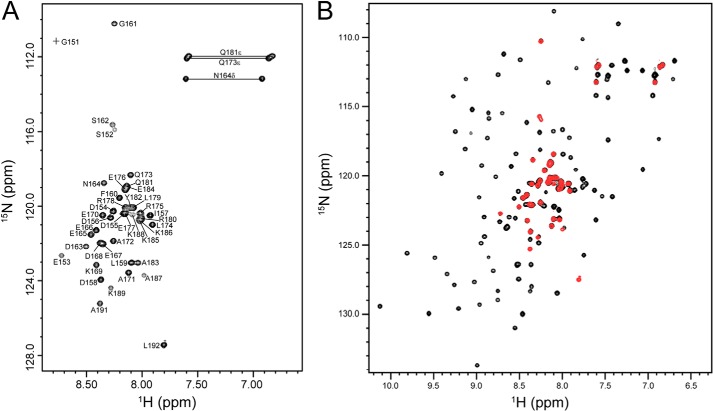
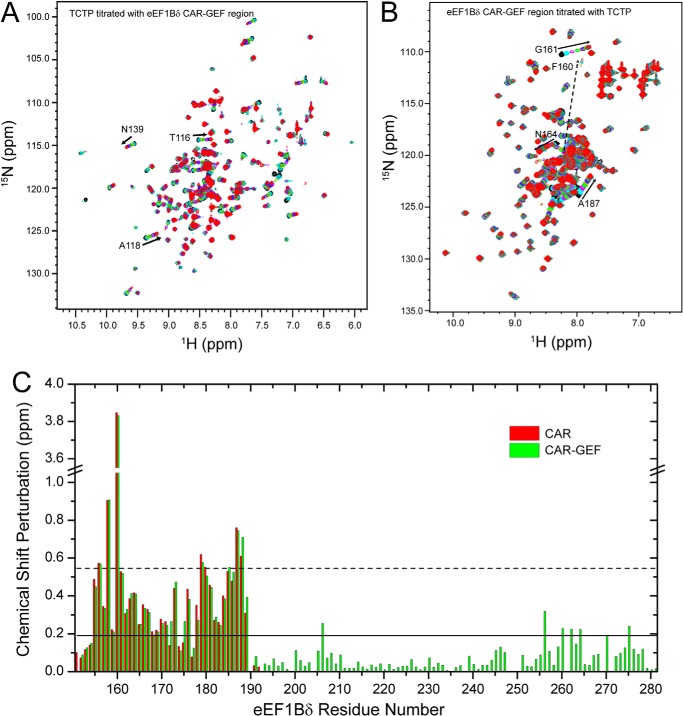
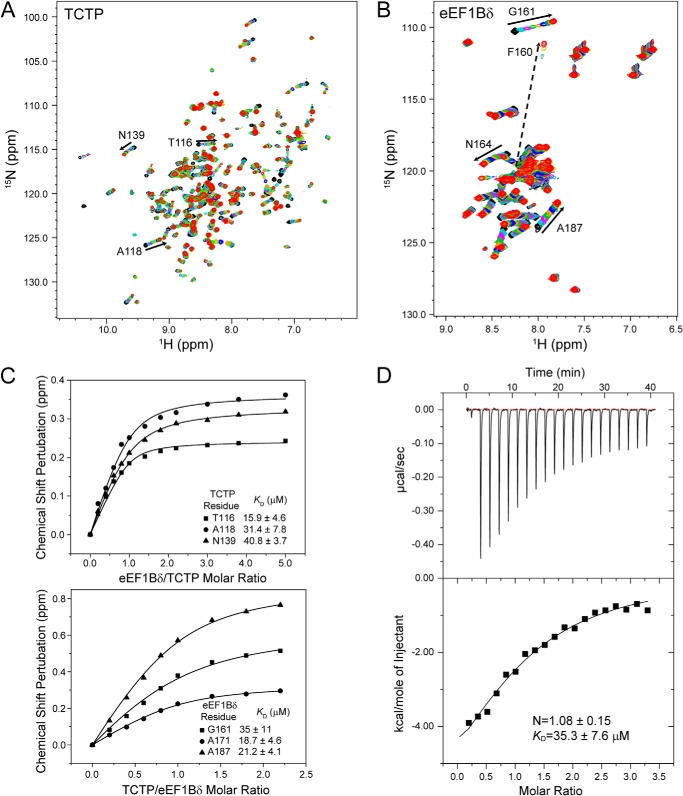
The C-terminal region (residues 153–281) containing the CAR and GEF domains of eEF1Bδ was previously identified as the TCTP binding region (10, 11). However, we found that the CAR domain and the GEF domain are in fact independent structural domains, as the peaks in the 1H-15N HSQC spectrum of the isolated CAR domain overlay well with the corresponding peaks in the 1H-15N HSQC spectrum of the CAR-GEF region (Fig. 2). In the NMR titration of 15N-labeled TCTP with the eEF1Bδ CAR-GEF region (Fig. 3A) and isolated CAR domain (Fig. 4A) as well as full-length eEF1Bδ (data not shown), almost identical chemical shift perturbations were observed for peaks in the 1H-15N HSQC spectra of 15N-labeled TCTP. Interestingly, no chemical shift perturbations were observed when TCTP was titrated with the GEF domain alone (data not shown). Furthermore, no interaction was observed between the N-terminal domain of eEF1Bδ and TCTP (data not shown). In the reverse titration of the 15N-labeled CAR-GEF region with TCTP (Fig. 3B), the peaks from the CAR domain in the 1H-15N HSQC spectrum showed significant chemical shift perturbations, the same as when the 15N-labeled isolated CAR domain was titrated with TCTP (Fig. 4B), although the peaks from the GEF domain showed no change during the titration (Fig. 3C). Therefore, this indicates that the CAR domain is the region responsible for TCTP binding.
FIGURE 2.
NMR characterization of the human eEF1Bδ C-terminal region. A, 1H-15N HSQC spectrum of the human eEF1Bδ CAR domain with assignments. B, overlaid 1H-15N HSQC spectra of the human eEF1Bδ CAR domain (red) and the CAR-GEF region (black).
FIGURE 3.
NMR titration between human TCTP and the human eEF1Bδ CAR-GEF region (residues 153–281). A, 1H-15N HSQC spectra of human TCTP titrated with the human eEF1Bδ CAR-GEF region. B, 1H-15N HSQC spectra of the human eEF1Bδ CAR-GEF region during the titration with human TCTP. C, chemical shift perturbations of the human eEF1Bδ CAR-GEF region (green) and CAR domain (red) titrated with human TCTP.
FIGURE 4.
Interaction between TCTP and eEF1Bδ detected by NMR titration and ITC. A, 1H-15N HSQC spectra of 0.2 mm 15N-labeled TCTP titrated with eEF1Bδ CAR domain. B, 1H-15N HSQC spectra of 0.5 mm 15N-labeled eEF1Bδ CAR domain titrated with TCTP. C, dissociation constants obtained by fitting the titration curves. D, ITC experiments of TCTP titrated with EF1δ CAR domain.
The equilibrium dissociation constants (KD) between TCTP and the eEF1Bδ CAR domain or the CAR-GEF region estimated by fitting the chemical shift changes during the titration were around 30 μm (Fig. 4C and Table 1), indicating low-to-medium binding affinity between TCTP and eEF1Bδ. ITC experiments showed similar values for the binding affinity of TCTP for the eEF1Bδ CAR domain or the CAR-GEF region (Fig. 4D and Table 1). Moreover, the thermodynamic parameters obtained from ITC experiments showed that the binding is dominated by the enthalpy change (Table 2), and the heat capacity change of binding obtained from ITC experiments carried out at different temperatures ranging from 10 to 30 °C was −272 ± 49 cal/mol/K, indicating the removal of solvating water molecules upon binding. Based on the above experimental results, we can conclude that the independent CAR domain is the structural region of eEF1Bδ involved in binding to TCTP.
TABLE 1.
Dissociation constants for binding of TCTP to different eEF1Bδ domains
| KD values | |
|---|---|
| μm | |
| NMR titration | |
| TCTP titrated with eEF1Bδ CAR domain | 29 ± 12 |
| TCTP titrated with eEF1Bδ CAR-GEF region | 30 ± 10 |
| eEF1Bδ CAR domain titrated with TCTP | 25 ± 10 |
| eEF1Bδ CAR-GEF region titrated with TCTP | 16.8 ± 9.0 |
| TCTP titrated with eEF1Bδ CAR domain in high salt buffer | 214 ± 78 |
| C172S TCTP titrated with eEF1Bδ CAR domain | 15.8 ± 8.8 |
| eEF1Bδ CAR domain titrated with C28S/C172S TCTP | 51.8 ± 8.2 |
| TCTP titrated with eEF1Bα CAR domain | 25 ± 11 |
| TCTP titrated with eEF1Bα CAR-GEF region | 8.2 ± 4.3 |
| ITC experiments | |
| TCTP titrated with eEF1Bδ CAR domain | 35.3 ± 7.6 |
| TCTP titrated with eEF1Bδ CAR-GEF region | 12.2 ± 2.0 |
TABLE 2.
Thermodynamic parameters for binding of TCTP to the eEF1Bδ CAR domain measured by ITC
| T | ΔG | ΔH | ΔS | KD | ΔCp |
|---|---|---|---|---|---|
| °C | cal/mol | cal/mol | cal/mol/K | μm | cal/mol/K |
| 10 | −6633 ± 106 | −3973 ± 185 | 9.3 ± 1.0 | 8.0 ± 1.5 | |
| 15 | −6869 ± 195 | −5288 ± 396 | 5.6 ± 2.0 | 6.5 ± 2.2 | |
| 20 | −6262 ± 177 | −7717 ± 1714 | −5.0 ± 6.4 | 22.5 ± 6.8 | −272 ± 49 |
| 25 | −6101 ± 128 | −8328 ± 1546 | −7.6 ± 5.6 | 35.3 ± 7.6 | |
| 30 | −6074 ± 195 | −9042 ± 1422 | −9.9 ± 5.3 | 44 ± 14 |
Solution Structure of eEF1δ CAR Domain in Free and TCTP-bound States
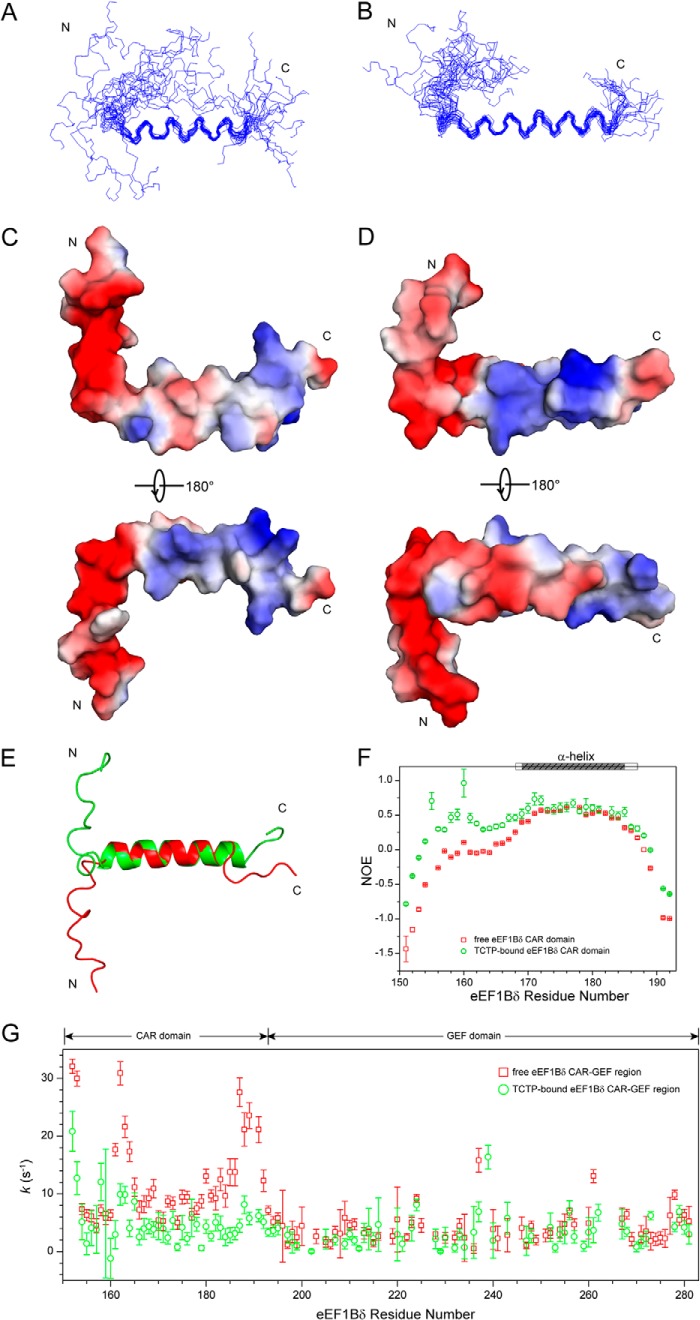
All peaks in the 1H-15N HSQC spectrum of the eEF1Bδ CAR domain, including the significantly overlapped peaks (Lys-185δ, Lys-186δ, and Arg-180δ; Glu-176δ, Glu-184δ, and Gln-181δ), were unambiguously assigned using triple resonance experiments (Fig. 2A). The structure of the eEF1Bδ CAR domain was calculated based on the nearly complete assignments and various restraints (Table 3). The final structure of the eEF1Bδ CAR domain (Fig. 5, A and C) shows an α-helical structure comprising one helix for residues 169–185 and two flexible loops for the residues of both terminal regions. The steady-state 1H-15N NOE experiment indicated that the α-helix is a relatively rigid structure indicated by larger NOE values, whereas the flexible loops have smaller NOE values (Fig. 5F). Negatively charged residues are mainly located in the N-terminal loop and the N-terminal part of the α-helix, whereas positively charged residues are mainly located in the C-terminal loop and the C-terminal part of the α-helix. Hydrophobic residues are sparsely distributed along the N-terminal loop and the whole α-helix (Fig. 5C).
TABLE 3.
Restraints and structure statistics for 20 lowest energy conformers of free and TCTP-bound EEF1Bδ CAR domain
| Free | TCTP-bound | |
|---|---|---|
| Distance restraints | ||
| Intra-residue | 102 | 226 |
| Sequential | 44 | 115 |
| Medium | 10 | 67 |
| Long range | 0 | 0 |
| Ambiguous | 42 | 76 |
| Total | 198 | 484 |
| Hydrogen bond restraints | 26 | 30 |
| Dihedral angle restraints | ||
| φ | 25 | 28 |
| ψ | 25 | 27 |
| total | 50 | 55 |
| Violations | ||
| Maximum distance violations (Å) | 0.145 | 0.155 |
| Maximum torsion angle violation (°) | 0 | 0 |
| PROCHECK statistics (%) | ||
| Most favored regions | 78.2 | 85.1 |
| Additional allowed regions | 19.9 | 11.8 |
| Generously allowed regions | 1.1 | 0.9 |
| Disallowed regions | 0.9 | 2.1 |
| Root mean square deviation from mean structure (Å) | ||
| All residues | ||
| Backbone heavy atoms | 6.42 ± 1.20 | 4.14 ± 1.07 |
| All heavy atoms | 6.91 ± 1.21 | 4.44 ± 0.88 |
| Regular secondary structure residuesa | ||
| All heavy atoms | 1.49 ± 0.24 | 1.13 ± 0.19 |
| Backbone atoms | 0.54 ± 0.17 | 0.56 ± 0.20 |
a Regular secondary structure regions are residues 169–185 and 168–187 of the eEF1Bδ CAR domain in free and TCTP-bound states, respectively.
FIGURE 5.
Structures of eEF1Bδ CAR domain in free and TCTP-bound states. A and B, backbone ensemble of the 20 lowest energy structures for free (A) and TCTP-bound (B) states. C and D, electrostatic surface for free (C) and TCTP-bound (D) states. E, superimposed structures of free (red) and TCTP-bound (green) eEF1Bδ CAR domains. F, heteronuclear steady-state 1H-15N NOEs of free (red) and TCTP-bound (green) eEF1Bδ CAR domain. G, amide-water hydrogen exchange rates k of free (red) and TCTP-bound (green) eEF1Bδ CAR-GEF region determined by CLEANEX-PM experiments.
To probe the structural changes in the eEF1Bδ CAR domain upon TCTP binding, we determined the structure of the eEF1Bδ CAR domain in the TCTP-bound state (Fig. 5, B and D). Comparing the structures of the eEF1Bδ CAR domain in the bound and free states, the helix in the bound state was extended at both the N and C termini (from residues 169–185 to 168–187), and the N-terminal loop becomes more convergent (Fig. 5, B, D, and E). The flexible-to-rigid transition in the structure was also revealed by the increased heteronuclear steady-state 1H-15N NOE values of the N-terminal loop and further evidenced by the larger number of observable 1H-1H NOEs available for use in the structural calculation (Fig. 5F and Table 3). This flexible-to-rigid transition upon TCTP binding was further evidenced by CLEANEX-PM experiments of the eEF1Bδ CAR-GEF region, which measured the amide-water hydrogen exchange rates (Fig. 5G). The eEF1Bδ CAR domain showed a significant decrease in the exchange rates upon TCTP binding, whereas the rates of the GEF domain were largely unchanged.
Binding Surfaces on TCTP and eEF1Bδ CAR Domain
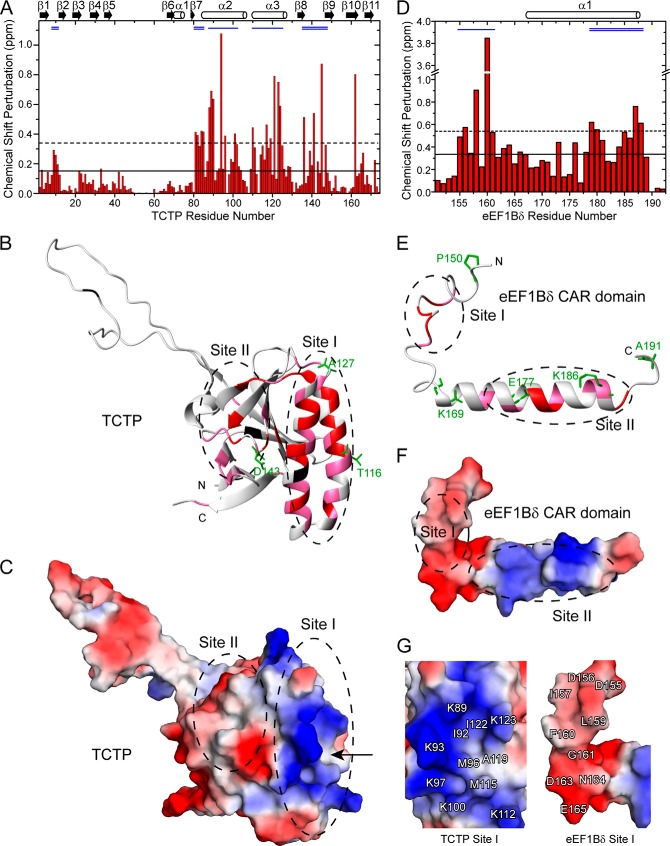
The binding surfaces on TCTP and the eEF1Bδ CAR domain were determined by mapping the CSPs onto the protein structures (Fig. 6). Structural regions containing residues with significant CSPs (larger than average value plus 1 S.D.) when TCTP was titrated with the eEF1Bδ CAR domain, and vice versa, were identified as the binding surfaces of the proteins. TCTP contains two binding surfaces as follows: the α-hairpin region, including helices α2 and α3 of TCTP (TCTP site I), and one side of the β-core (TCTP site II), including loops Lβ1β2, Lβ7α2, Lβ8β9, and strands β1, β2, β8, and β9 (Fig. 6, A and B). TCTP site I contains many positively charged residues surrounding a hydrophobic pocket on the surface (Fig. 6, C and G), and TCTP site II is a hydrophobic patch surrounded by a few negatively charged residues in loop Lβ8β9 (Fig. 6C).
FIGURE 6.
Mapping the binding surfaces of TCTP and eEF1Bδ CAR domain. A, CSPs of TCTP titrated with eEF1Bδ CAR domain (molar ratio 1:2.2). B, structural mapping of CSPs on TCTP. C, electrostatic surface of TCTP. D, CSPs of eEF1Bδ CAR domain titrated with TCTP (molar ratio 1:2.2). E, structural mapping of CSPs on the eEF1Bδ CAR domain. F, electrostatic surface of the eEF1Bδ CAR domain. G, close-up view of electrostatic surfaces of sites I of TCTP (left) and the eEF1Bδ CAR domain (right). A and D, solid and dashed lines represent the average value and average value plus 1 S.D. of total CSPs, respectively; the blue single and doubles lines on the top indicate the binding sites I and II of each protein, respectively; secondary structure elements are shown on the top. B and E, residues with a CSP value more than the average value plus 1 S.D. are shown in red; those with a CSP value between the average value and average value plus 1 S.D. are shown in pink. Unassigned residues are shown in black. Residues for MTSL labeling in PRE experiments are shown as green sticks with label. The arrow in C indicates the hydrophobic pocket in site I of TCTP.
The eEF1Bδ CAR domain also has two binding surfaces as follows: residues 155–161 in the N-terminal loop (eEF1Bδ site I), and residues 179–188 mainly in the α-helix (eEF1Bδ site II) (Fig. 6, D and E). EEF1Bδ site I is highly negatively charged (Fig. 6, F and G) with a few hydrophobic residues (Ile-157δ, Leu-159δ, and Phe-160δ). This site may undergo a significant conformational/environmental change upon binding because residue Phe-160δ showed an extraordinarily high CSP value (Fig. 6D). EEF1Bδ site II contains both hydrophobic and positively charged residues (Fig. 6F). Interestingly, in terms of electrostatic and hydrophobic interactions, eEF1Bδ sites I and II are complementary with TCTP sites I and II, respectively.
Intermolecular Orientation Probed by PRE
Because structural determination of the TCTP-eEF1Bδ complex was not possible because of the weak interaction between TCTP and eEF1Bδ, the following strategy was adopted to obtain the structure of the complex. First, PRE experiments were conducted to obtain the orientation of the two proteins in the complex. Second, the key residues in the interaction were identified by titration of proteins with various single point mutations on the binding surfaces. Third, HADDOCK combined with CSP, PRE, and mutagenesis data was used to calculate the structure of the complex. (The second and third approaches are described in the subsequent sections.)
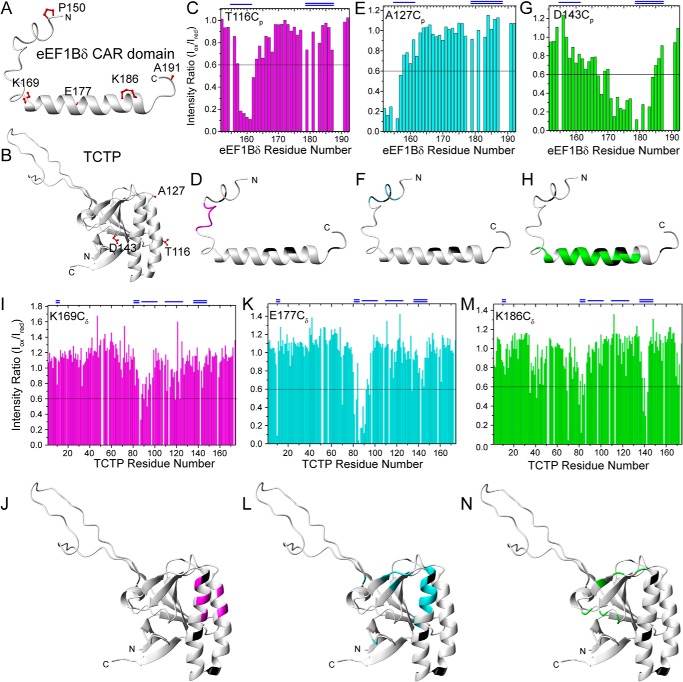
For PRE experiments, three residues of TCTP (Thr-116p, Ala-127p, and Asp-143p) were chosen as MTSL-labeling sites to detect interactions with the eEF1Bδ CAR domain. Thr-116p and Ala-127p are located, respectively, at the N- and C-terminal parts of helix α3 around TCTP site I; and Asp-143p is close to TCTP site II (Figs. 6B and 7B). To further investigate the interactions between the two proteins, five residues of the eEF1Bδ CAR domain were chosen as MTSL-labeling sites as follows: Pro-150δ and Ala-191δ at the N and C termini, respectively, and Lys-169δ, Glu-177δ, and Lys-186δ in the α-helix (Figs. 6E and 7A). MTSL-labeled T116Cp caused attenuation of the signals from the eEF1Bδ site I (Fig. 7, C and D), whereas MTSL-labeled A127Cp affected the N-terminal residues in the HSQC spectrum of the eEF1Bδ CAR domain (Fig. 7, E and F). Signals from residues at eEF1Bδ site II were broadened by MTSL-labeled D143Cp (Fig. 7, G and H), whereas MTSL-labeled K169Cδ caused specific signal attenuation for residues from TCTP site I (Fig. 7, I and J). The PRE effect of MTSL-labeled E177Cδ was observed as signal attenuation of residues located between TCTP sites I and II as well as some residues within the sites (Fig. 7, K and L), whereas MTSL-labeled K186Cδ reduced signals from TCTP site II (Fig. 7, M and N). No PRE effect of MTSL-labeled P150Cδ and A191Cδ was observed (data not shown). These results indicate that eEF1Bδ sites I and II interact with TCTP sites I and II, respectively.
FIGURE 7.
PRE results of TCTP-eEF1Bδ CAR domain interaction. A and B, MTSL-labeling sites of eEF1Bδ CAR domain (A) and TCTP (B). The side chains of labeled residues are shown as red balls and sticks. C–H, PRE effects and structural mapping on eEF1Bδ CAR domain by MTSL-labeled TCTP. I–N, PRE effects and structural mapping on TCTP by MTSL-labeled eEF1Bδ CAR domain. The blue single and doubles lines on the top indicate the binding sites I and II of each protein, respectively. In the structural mapping, the residues with more than 40% peak intensity attenuation were indicated by different colors for different labeling sites. Unassigned residues are shown in black.
The above PRE data allow a model of the intermolecular orientation to be generated. The N-terminal loop of the eEF1Bδ CAR domain (eEF1Bδ CAR site I) is close to the α-hairpin of TCTP (TCTP site I), whereas the N terminus of the eEF1Bδ CAR domain is toward the C terminus of helix α3 of the α-hairpin of TCTP. The α-helix of the eEF1Bδ CAR domain (eEF1Bδ site II) is close to the β-core of TCTP (TCTP site II), whereas the region connecting eEF1Bδ sites I and II is close to the structural region between the α-hairpin and the β-core of TCTP.
Key Residues Drive Interaction between TCTP and eEF1Bδ CAR Domain
According to the above data, electrostatic and/or hydrophobic interactions may drive the binding of the eEF1Bδ CAR domain to TCTP. The question is whether hydrophobic or charged residues play the most important role in the interaction. NMR titration performed with mutant proteins containing various single mutations in the binding site of each protein (Table 4 and Fig. 8) was adopted to identify the key residues for binding in the two proteins.
TABLE 4.
Dissociation constants for binding of TCTP to mutants and fragments of the eEF1Bδ CAR domain
| TCTP titrated with eEF1Bδ CAR domain | KD values | eEF1Bδ CAR domain titrated with TCTP | KD values |
|---|---|---|---|
| μm | μm | ||
| WT | 29 ± 12 | WT | 25 ± 10 |
| D155K | 30 ± 24 | F83A | 97 ± 16 |
| D156K | 18.6 ± 7.4 | E86Q | 17 ± 12 |
| I157A | 205 ± 68 | K89Q | 138 ± 66 |
| D158K | 203 ± 84 | K90Q | 72 ± 22 |
| L159A | Not detected | I92A | 251 ± 62 |
| F160A/L/Y | Not detected | K93Q | 693 ± 260 |
| G161K | 190 ± 24 | D94Q | 8.0 ± 4.6 |
| S162K | 14 ± 11 | M96A | 13.2 ± 4.2 |
| D163K | 20 ± 15 | M96N | 792 ± 125 |
| E165A | 30 ± 13 | K97Q | 111 ± 19 |
| E166A | 13.0 ± 8.5 | M115D | Not detected |
| E167K | 149 ± 75 | A118D | Not detected |
| E170A | 12.8 ± 6.5 | A119E | 31 ± 10 |
| E176K | 13.2 ± 7.1 | A119K | 60 ± 10 |
| R178D | 49 ± 28 | I122A | 90 ± 19 |
| L179A | 7.1 ± 4.1 | K123E | 231 ± 91 |
| Y182A | 91 ± 33 | M140A | 60 ± 13 |
| K186D | 40 ± 16 | P142A | 21.5 ± 6.9 |
| K189D | 26 ± 15 | ||
| EDDDIDLFGSDNE (residues 153–165) | 307 ± 86 | ||
| DLFGS (residues 158–162) | ≫1000 |
FIGURE 8.
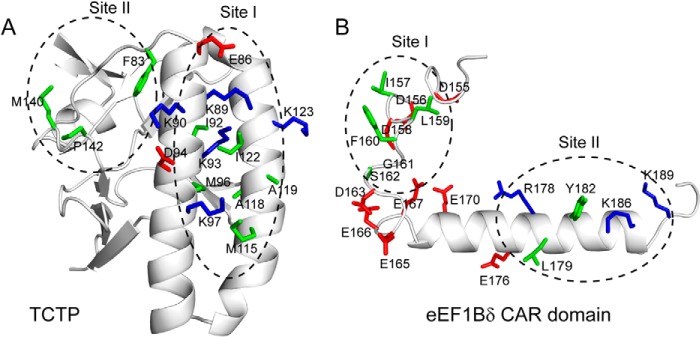
Mutation sites on the structure of human TCTP (A) and the human eEF1Bδ CAR domain (B). The side chains of mutated residues are shown as sticks. Neutral, positively charged, and negatively charged residues are shown in green, blue, and red, respectively.
The hydrophobic pocket of TCTP site I could accommodate the hydrophobic residues of eEF1Bδ site I. Consistent with this, mutants L159Aδ, F160Aδ, M115Dp, and A118Dp showed no binding with their wild-type binding partner, whereas M96Ap and A119Ep did not change the binding, showing KD values similar to that of wild type. It is likely that residues Leu-159δ and Phe-160δ of the eEF1Bδ CAR domain insert into the hydrophobic pocket of TCTP site I, because Phe-160δ showed an extraordinarily high CSP value in the NMR titration. We confirmed that Phe-160δ indeed plays a vital role in the interaction, because replacement of phenylalanine with leucine or tyrosine instead of alanine at residue 160 also prevents binding between the two proteins. In addition, mutants I92Ap, M96Np, A119Kp, I122Ap, and I157Aδ as well as G161Kδ decreased the binding affinity about 3–30-fold. Meanwhile, mutation of charged residues D158Kδ, K89Qp, K93Qp, K97Qp, and K123Ep caused a severalfold decrease in affinity, whereas mutants D155Kδ, D156Kδ, S162Kδ, D163Kδ, and E86Qp showed KD values similar to that of wild type (Table 4). In TCTP site II and eEF1Bδ site II, mutations of hydrophobic residues Y182Aδ, F83Ap, and M140Ap decreased binding affinities by severalfold, whereas L179Aδ and P142Ap showed affinities similar to that of wild type. Analysis of TCTP CSP values caused by Y182Aδ and eEF1Bδ CSP values caused by F83Ap and M140Ap revealed that most residues in TCTP site II and eEF1Bδ site II failed to show significant chemical shift changes. Meanwhile, mutations of charged residues K186Dδ and K189Dδ had almost no effect on the interaction. All these data suggest that hydrophobic rather than electrostatic interactions between the binding sites on the two proteins play a crucial role in the binding, and the eEF1Bδ site I is critical for binding with TCTP. However, the binding affinity in 400 mm NaCl decreased about 7-fold compared with that in 200 mm NaCl (30 versus 214 μm) (Table 1). Therefore, hydrophobic interactions dominate the binding between TCTP and the eEF1Bδ CAR domain, whereas electrostatic interactions also contribute to the binding affinity.
To further confirm the importance of eEF1Bδ site I for interaction with TCTP, TCTP was titrated with peptides EDDDIDLFGSDNE, DLFGS, and LFG corresponding to residues 153–165 (containing all residues of eEF1Bδ site I), 158–162, and 159–161 of the eEF1Bδ CAR domain, respectively. All peptides showed interaction with site I of TCTP, and longer peptides showed stronger affinity (Table 4). Therefore, the two hydrophobic residues Leu-159δ and Phe-160δ in cooperating with other residues from eEF1Bδ site I play key roles in the binding.
Structural Model of the TCTP-eEF1Bδ CAR Domain Complex
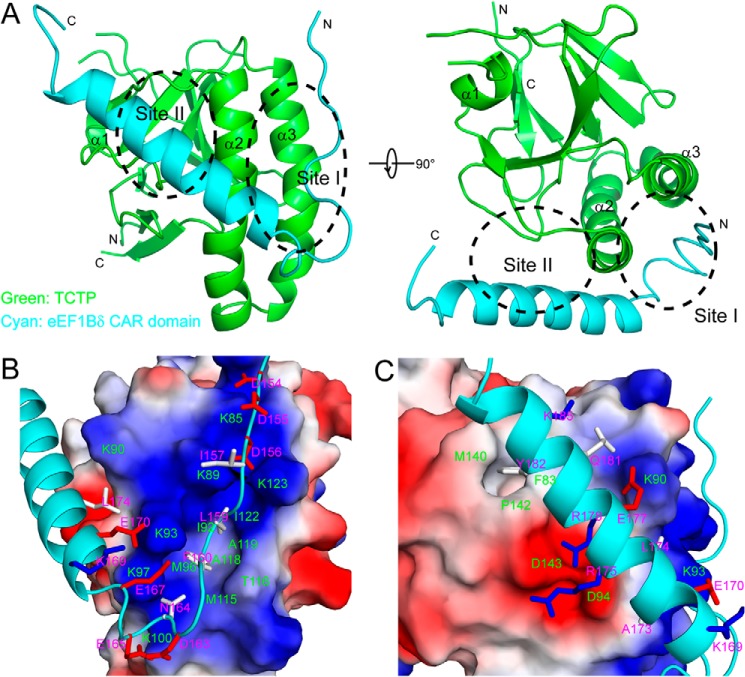
The structural model of the TCTP-eEF1Bδ CAR domain complex was determined by HADDOCK docking computation (34). The structural model obtained demonstrates a large buried interacting surface area (2337.4 ± 87.2 Å2) (Table 5 and Fig. 9A). The two hydrophobic residues Leu-159δ and Phe-160δ in eEF1Bδ site I insert into the hydrophobic pocket of TCTP site I between the two helices α2 and α3, although surrounding charged residues form salt bridges (Fig. 9B). Tyr-182δ of eEF1Bδ site II contacts with two hydrophobic residues Phe-83p and Met-140p of TCTP site II (Fig. 9C). The helix of the eEF1Bδ CAR domain forms 119.6 ± 3.3 and 49.8 ± 2.7° angles with the helices α2 and α3 of TCTP, respectively.
TABLE 5.
Statistics for the complex of TCTP and the eEF1Bδ CAR domain obtained by HADDOCK docking
| No. of clusters | 3 | |
| Cluster | 1st | 2nd |
| Structure number | 179 | 6 |
| HADDOCK score | −206.7 ± 4.1 | −172.9 ± 3.9 |
| RMSD from lowest energy structure | 1.2 ± 0.7 | 2.5 ± 0.2 |
| Restraints violation energy | 138 ± 36 | 160 ± 49 |
| Buried surface area | 2337 ± 87 | 2212 ± 121 |
| Z-score | −1.2 | −0.1 |
| PROCHECK statistics (%) | ||
| Most favored regions | 83.3 | 83.6 |
| Additional allowed regions | 16.1 | 14.5 |
| Generously allowed regions | 0.2 | 1.1 |
| Disallowed regions | 0.5 | 0.8 |
FIGURE 9.
Structure of TCTP-eEF1Bδ CAR domain complex obtained by HADDOCK. A, ribbon representation of the structure of the TCTP-eEF1Bδ CAR domain complex. TCTP and the eEF1Bδ CAR domain are colored in green and cyan, respectively. B, close-up view of the site I-binding sites of both proteins in the complex. C, close-up view of the site II-binding sites of both proteins in the complex. B and C, TCTP is represented as electrostatic surfaces, in which positively and negatively charged surfaces are in blue and red, respectively; the eEF1Bδ CAR domain is represented as cyan ribbons and the side chains of residues contacting with TCTP are shown as sticks (positively charged, negatively charged, and neutral residues are in blue, red, and gray, respectively). Residues of TCTP and the eEF1Bδ CAR domain are labeled in green and red, respectively.
The docking model of the complex of TCTP and the eEF1Bδ CAR domain shows continuous interacting surfaces, including sites I and II as well as the region between the two sites of each protein. A number of charged residues in the region form salt bridges, including Lys-97p–Glu-167δ–Lys-93p–Glu-170δ, Lys-90p–Glu-177δ, Lys-100p–Glu-165δ, and Asp-94p–Arg-178δ contributing to the buried binding interface. To confirm the role of these residues in the binding, a number of mutants were constructed and used for NMR titration. Mutants including E165Aδ, E166Aδ, E170Aδ, E176Kδ, and D94Qp showed KD values similar to wild type, and E167Kδ, R178Dδ, and K90Qp showed a decrease in affinity of severalfold (Table 4). This demonstrates that electrostatic interactions in the region between sites I and II of each protein, forming a continuous interacting surface together with sites I and II of each protein, also contribute to the binding affinity.
The structure model of the complex is in agreement with the thermodynamic parameters obtained from ITC experiments. The large buried interaction surface area in the structure of the complex suggests that a significant decrease in hydration should occur during binding, which is in agreement with the large negative value of the heat capacity change estimated by ITC experiments (Table 2). A large number of electrostatic interactions in the structure of the complex is consistent with the dominant enthalpy change observed in ITC experiments. The apparent thermodynamic parameters obtained from the ITC experiments also reveal that the entropy change is relatively small. Although hydrophobic interactions and dehydration during binding will result in a positive entropy change, the significant change in dynamics (flexible-to-rigid) of the eEF1Bδ CAR domain upon binding to TCTP produces a negative entropy change, which results in the small total entropy change.
Interaction of TCTP and eEF1B GEFs Is Conserved in Eukaryotes
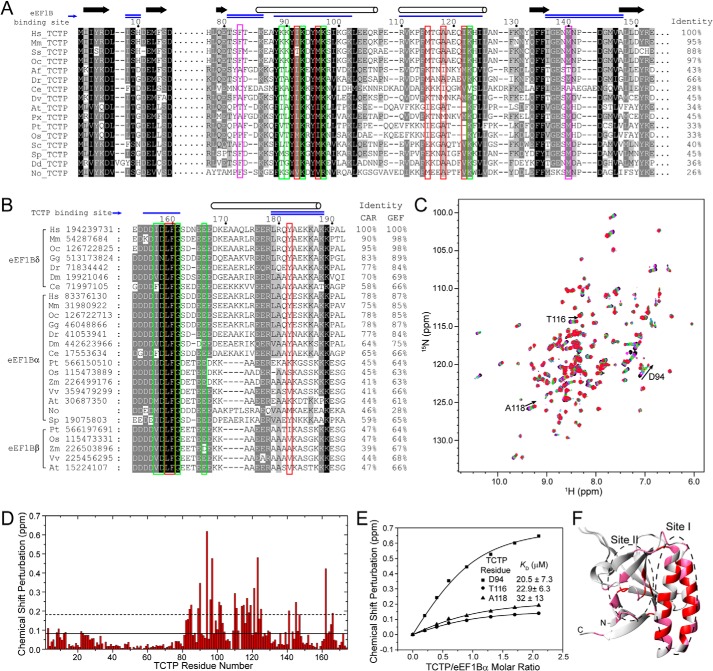
TCTP is highly conserved in eukaryotes. Sequence alignment of TCTPs (Fig. 10A) showed the key residues for binding eEF1Bδ are largely conserved in various species. Four of five hydrophobic residues (Ile-92p, Met-96p, Met-115p, Ala-118p, and Ile-122p) except Met-115 in human TCTP site I are hydrophobic residues in all TCTPs. The positively charged residues are also largely conserved, particularly Lys-93p (whose mutation causes the most significant affinity loss with eEF1Bδ) is completely conserved in TCTPs. In TCTP site II, the two key hydrophobic residues (Phe-83 and Met-140 in human TCTP) are always hydrophobic residues in TCTPs. The sequence alignment of various GEFs in the eEF1B complex (including eEF1Bα, which exists in all eukaryotes, eEF1Bδ, which exists only in metazoans, and eEF1Bβ, which exists only in plants (Figs. 1 and 10B)) indicates that all of these proteins have the conserved CAR domain at the N terminus of the GEF domain. Furthermore, the key residues Leu-Phe and surrounding negatively charged residues in eEF1Bδ site I are completely conserved in all eEF1B GEF CAR domains. In eEF1Bδ site II, the hydrophobic residue Tyr-182δ is largely but not completely conserved in all CAR domains. Therefore, both site I of TCTP and site I of all eEF1B GEF CAR domains are conserved in eukaryotes, although site II of each of the proteins is less well conserved. Because it is site I in each protein that is crucial for the interaction, we can therefore speculate that the interaction between TCTP and eEF1B GEFs is conserved in all eukaryotes.
FIGURE 10.
Conserved interaction between TCTP and eEF1B GEF CAR domains. A, sequence alignment of TCTP from various species. The sequences distant from the binding sites are not displayed. Key hydrophobic residues in TCTP site I and site II are indicated by red and magenta boxes, respectively. Charged residues in TCTP that contribute to the binding affinity are indicated by green boxes. Sequence identity to human TCTP is indicated to the right of the alignment. B, sequence alignment of CAR domains of eEF1B GEFs. Key hydrophobic residues are indicated by red boxes. The residues that contributed to the binding affinity are indicated by green boxes. The blue single and doubles lines on the top indicate the TCTP-binding sites I and II, respectively. The proteins are labeled with two-letter abbreviations of the species name and the NCBI GI number. The abbreviations of species are as: Hs, Homo sapiens; Mm, Mus musculus; Ss, Sus scrofa; Oc, Oryctolagus cuniculus; Af, Artemia franciscana; Dr, Danio rerio; Ce, Caenorhabditis elegans; Dv, Drosophila virilis; At, Arabidopsis thaliana; Px, Plutella xylostella; Pt, Populus trichocarpa; Os, Oryza sativa; Sc, Saccharomyces cerevisiae; Sp, S. pombe; Dd, Dictyostelium discoideum; No, N. oceanica; Gg, Gallus gallus; Dm, Drosophila melanogaster; Zm, Zea mays; Vv, Vitis vinifera. Sequence identity to human CAR and GEF domains is indicated to the right of the alignment. C, 1H-15N HSQC spectra of human TCTP titrated with human eEF1Bα CAR domain. D, CSPs of TCTP titrated with eEF1Bα CAR domain (molar ratio 1:1.3). E, dissociation constants obtained from fitting the curves of the NMR titration. F, mapping of CSPs onto the structure of TCTP.
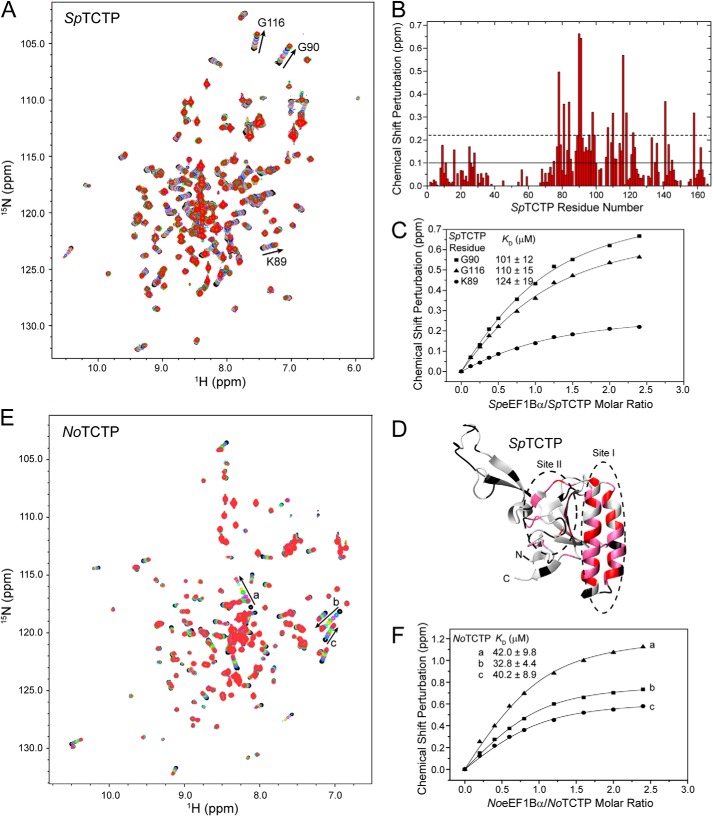
To test the conservation of the interaction between TCTP and eEF1B GEFs, we first checked the interaction between human TCTP and eEF1Bα. NMR titration experiments showed that the CAR domain and the CAR-GEF region of eEF1Bα interact with TCTP, and the CSPs of TCTP and KD values were very similar to those from the titration experiments with eEF1Bδ (Fig. 10, C–F). These results demonstrate that TCTP interacts with eEF1Bα at the same sites as with eEF1Bδ. Such interactions were also detected for TCTP and eEF1Bα from lower eukaryotes, including the fission yeast S. pombe and the unicellular photosynthetic microalga N. oceanica (Fig. 11). The binding sites on fission yeast TCTP identified by CSP mapping, according to the previous chemical shift assignments of fission yeast TCTP (35), include both site I and site II, the same as the sites on human TCTP. The binding affinities (112 ± 18 μm for S. pombe and 38.4 ± 9.0 μm for N. oceanica) derived from NMR titration are similar (slightly lower) to those for human TCTP-eEF1Bα/δ interactions. These results imply that the interaction between TCTP and eEF1B GEFs is conserved in all eukaryotes.
FIGURE 11.
Interaction of eEF1Bα CAR domain and TCTP in fission yeast S. pombe and photosynthetic microalga N. oceanica. A, 1H-15N HSQC spectra of S. pombe TCTP (SpTCTP) titrated with S. pombe eEF1Bα CAR domain. B, CSPs of SpTCTP. Solid and dashed lines represent the average value and average value plus 1 S.D. of total CSPs, respectively. C, titration curve fitting of CSPs of SpTCTP to obtain dissociation constants. D, structural mapping of CSPs on SpTCTP. Residues with a CSP value more than the average value plus 1 S.D. are shown in red; those with a CSP value between the average value and average value plus 1 S.D. are shown in pink. E, 1H-15N HSQC spectra of N. oceanica TCTP (NoTCTP) titrated with N. oceanica eEF1Bα CAR domain. F, dissociation constants obtained by fitting the curves from the NMR titration of NoTCTP.
DISCUSSION
In this study, we demonstrate that the CAR domain of eEF1Bδ (residues 153–192), which is structurally independent of the C-terminal GEF domain, is responsible for binding to TCTP through conserved hydrophobic and electrostatic interactions. The interactions are conserved for TCTP and all GEFs of the eEF1B complex, including eukaryotically conserved eEF1Bα and plant-specific eEF1Bβ. Thus, the CAR domain is a pivotal region for the regulation of different eEF1B subunits in performing GEF activity, and the involvement of TCTP in the protein translation machinery likely represents one of the primary cellular functions of TCTP in all eukaryotes.
The finding that TCTP binds to the CAR domain instead of the GEF domain of eEF1Bδ raises the question of how TCTP inhibits the GEF activity of eEF1Bδ. According to the structure of the eEF1Bα-eEF1A complex (Protein Data Bank codes 1F60 and 1IJF) (16, 17), the catalytic residues of eEF1Bα are located at the C terminus, and a conserved lysine residue at the second position from the C terminus of eEF1Bα disrupts the interaction of Mg2+ with eEF1A and GDP, resulting in the release of Mg2+ and GDP from eEF1A. The C and N termini of the eEF1Bα GEF domain form an antiparallel β-sheet; thus, the CAR domain, which is at the N terminus of the GEF domain, is also spatially close to the GDP/Mg2+-binding site of eEF1A domain I. When the 20-kDa TCTP protein binds to the CAR domain of eEF1Bα, TCTP will likely impede the release of GDP by steric hindrance. This inhibition mechanism is different from classic guanine nucleotide dissociation inhibitors that inhibit the nucleotide release from GTPases by competing with the nucleotide exchange factors (36, 37).
Our data demonstrate that the α-hairpin-containing site I of TCTP plays a key role in the interaction with eEF1B GEFs. It has been proposed that the α-hairpin of TCTP plays a key role in many interactions and functions of TCTP (9, 12, 38–41). However, all of these reports lack structural information about the interaction, and some of them are contradictory. For example, several researchers reported that TCTP physically interacts with p53 (9, 39, 42). However, one paper reported that p53 binds to the α-hairpin of TCTP (39), although another paper reported that p53 binds to the N- and C-terminal regions of TCTP (42). All of them used fragments of TCTP to detect the interacting regions, which are probably problematic because structural studies indicate that TCTP is a single domain protein and fragments are unlikely to fold well or reflect the real interactions of the intact protein (6, 18, 22). Many other studies of TCTP-protein interactions also used fragments of TCTP to identify the binding regions (12, 38, 43–47), and most of them assume a “three-domain” view of TCTP consisting of an N-terminal β “domain,” a central helical domain and a C-terminal domain. The binding regions identified in these studies probably also need further confirmation by NMR or crystallographic methods using intact TCTP because the fragments may be incorrectly folded or unfolded.
The conserved interaction of TCTP with the eEF1B complex suggests the involvement of TCTP in the protein translation machinery. In fact, by carefully analyzing the literature, we found several additional pieces of evidence for the involvement of TCTP in protein translation. In 2000, before discovery of the interaction between TCTP and the eEF1 complex, Brown et al. (48) used support vector machines to classify budding yeast genes based on microarray gene expression, which classified TCTP as the cytoplasmic ribosome class, suggesting that TCTP expression is co-regulated with the ribosome. Later, in 2006, Fleischer et al. (49) screened 77 uncharacterized proteins, including TCTP, associated with the ribosome in yeast. Recently, Atkinson et al. (50) reported that eEF1A and eEF1B are not completely conserved in eukaryotes, and some species contain an EF1A-like protein (EFL) that replaces eEF1A and eEF1B. Interestingly, when we searched TCTP homologues in these eEF1A-lacking species, we found that none of them contains a TCTP-homologue gene, except Emiliania huxleyi. For those “intermediate” species containing both EFL and eEF1A (11 species reported), most of them lack both eEF1B and TCTP, except the following three species: Symbiodinium sp. CladeC that contains a TCTP homologue only and Guillardia theta and Thecamonas trahens that contain both eEF1B and TCTP homologues. Therefore, it is likely that TCTP and the eEF1A-eEF1B complex have co-evolved, which suggests that they are tightly correlated in function.
Our study demonstrates for the first time that TCTP is involved in a conserved eukaryotic cellular function by interacting with GEFs of the eEF1B complex. The structural and interaction data provide insight into the mechanism of TCTP function. Many interactions have been reported for TCTP without structural information. Our study provides a paradigm for further studies of the structural mechanism of these interactions.
Acknowledgments
NMR experiments were carried out at the Core Facility for Protein Research, Institute of Biophysics, Chinese Academy of Sciences, and the Beijing NMR Center or the NMR Facility of the National Center for Protein Sciences at Peking University. We thank Dr. Xuehui Liu and Dr. Yuanyuan Chen, both from the Core Facility for Protein Research, Institute of Biophysics, for help with CLEANEX-PM and ITC experiments, respectively.
This work was supported by National Basic Research Program, Ministry of Science and Technology of China (973 Program) Grants 2012CB911000 and 2013CB910700 (to S. P.), National High-tech R&D Program, Ministry of Science and Technology of China (863 Program) Grant 2012AA02A707 (to Y. F.), National Natural Science Foundation of China Grants 30800179 and 31170701 (to Y. F.), 31200578 and 31470747 (to W. G.), and 31110103914 (to S. P.), and Beijing Natural Science Foundation Grant 5092018 (to Y. F.).
The atomic coordinates and structure factors (codes 2MVM and 2MVN) have been deposited in the Protein Data Bank (http://wwpdb.org/).
- TCTP
- translationally controlled tumor protein
- eEF1
- eukaryotic elongation factor 1
- GEF
- guanine nucleotide exchange factor
- CAR
- central acidic region
- ITC
- isothermal titration calorimetry
- PRE
- paramagnetic relaxation enhancement
- MTSL
- 1-oxyl-2,2,5,5-tetramethyl-Δ3-pyrroline-3-methyl methanethiosulfonate
- CSP
- chemical shift perturbation
- HSQC
- heteronuclear single quantum coherence.
REFERENCES
- 1. Norbeck J., Blomberg A. (1997) Two-dimensional electrophoretic separation of yeast proteins using a nonlinear wide range (pH 3–10) immobilized pH gradient in the first dimension; reproducibility and evidence for isoelectric focusing of alkaline (pI > 7) proteins. Yeast 13, 1519–1534 [DOI] [PubMed] [Google Scholar]
- 2. Velculescu V. E., Madden S. L., Zhang L., Lash A. E., Yu J., Rago C., Lal A., Wang C. J., Beaudry G. A., Ciriello K. M., Cook B. P., Dufault M. R., Ferguson A. T., Gao Y., He T. C., et al. (1999) Analysis of human transcriptomes. Nat. Genet. 23, 387–388 [DOI] [PubMed] [Google Scholar]
- 3. Thiele H., Berger M., Skalweit A., Thiele B. J. (2000) Expression of the gene and processed pseudogenes encoding the human and rabbit translationally controlled tumour protein (TCTP). Eur. J. Biochem. 267, 5473–5481 [DOI] [PubMed] [Google Scholar]
- 4. Thompson H. G., Harris J. W., Wold B. J., Quake S. R., Brody J. P. (2002) Identification and confirmation of a module of coexpressed genes. Genome Res. 12, 1517–1522 [DOI] [PMC free article] [PubMed] [Google Scholar]
- 5. Bommer U. A., Thiele B. J. (2004) The translationally controlled tumour protein (TCTP). Int. J. Biochem. Cell Biol. 36, 379–385 [DOI] [PubMed] [Google Scholar]
- 6. Feng Y., Liu D., Yao H., Wang J. (2007) Solution structure and mapping of a very weak calcium-binding site of human translationally controlled tumor protein by NMR. Arch. Biochem. Biophys. 467, 48–57 [DOI] [PubMed] [Google Scholar]
- 7. Kawakami T., Ando T., Kawakami Y. (2012) HRF-interacting molecules. Open Allergy J. 5, 41–46 [Google Scholar]
- 8. Bommer U.-A. (2012) Cellular function and regulation of the translationally controlled tumour protein TCTP. Open Allergy J. 5, 19–32 [Google Scholar]
- 9. Amson R., Pece S., Lespagnol A., Vyas R., Mazzarol G., Tosoni D., Colaluca I., Viale G., Rodrigues-Ferreira S., Wynendaele J., Chaloin O., Hoebeke J., Marine J. C., Di Fiore P. P., Telerman A. (2012) Reciprocal repression between P53 and TCTP. Nat. Med. 18, 91–99 [DOI] [PubMed] [Google Scholar]
- 10. Cans C., Passer B. J., Shalak V., Nancy-Portebois V., Crible V., Amzallag N., Allanic D., Tufino R., Argentini M., Moras D., Fiucci G., Goud B., Mirande M., Amson R., Telerman A. (2003) Translationally controlled tumor protein acts as a guanine nucleotide dissociation inhibitor on the translation elongation factor eEF1A. Proc. Natl. Acad. Sci. U.S.A. 100, 13892–13897 [DOI] [PMC free article] [PubMed] [Google Scholar]
- 11. Langdon J. M., Vonakis B. M., MacDonald S. M. (2004) Identification of the interaction between the human recombinant histamine releasing factor/translationally controlled tumor protein and elongation factor-1δ (also known as eElongation factor-1Bβ). Biochim. Biophys. Acta 1688, 232–236 [DOI] [PubMed] [Google Scholar]
- 12. Rid R., Onder K., Trost A., Bauer J., Hintner H., Ritter M., Jakab M., Costa I., Reischl W., Richter K., MacDonald S., Jendrach M., Bereiter-Hahn J., Breitenbach M. (2010) H2O2-dependent translocation of TCTP into the nucleus enables its interaction with VDR in human keratinocytes: TCTP as a further module in calcitriol signalling. J. Steroid Biochem. Mol. Biol. 118, 29–40 [DOI] [PubMed] [Google Scholar]
- 13. Le Sourd F., Boulben S., Le Bouffant R., Cormier P., Morales J., Belle R., Mulner-Lorillon O. (2006) eEF1B: At the dawn of the 21st Century. Biochim. Biophys. Acta 1759, 13–31 [DOI] [PubMed] [Google Scholar]
- 14. Sasikumar A. N., Perez W. B., Kinzy T. G. (2012) The many roles of the eukaryotic elongation factor 1 complex. WIREs RNA 3, 543–555 [DOI] [PMC free article] [PubMed] [Google Scholar]
- 15. Pérez J. M., Siegal G., Kriek J., Hård K., Dijk J., Canters G. W., Möller W. (1999) The solution structure of the guanine nucleotide exchange domain of human elongation factor 1β reveals a striking resemblance to that of EF-Ts from Escherichia coli. Structure 7, 217–226 [DOI] [PubMed] [Google Scholar]
- 16. Andersen G. R., Pedersen L., Valente L., Chatterjee I., Kinzy T. G., Kjeldgaard M., Nyborg J. (2000) Structural basis for nucleotide exchange and competition with tRNA in the yeast elongation factor complex eEF1A:eEF1Bα. Mol. Cell 6, 1261–1266 [DOI] [PubMed] [Google Scholar]
- 17. Andersen G. R., Valente L., Pedersen L., Kinzy T. G., Nyborg J. (2001) Crystal structures of nucleotide exchange intermediates in the eEF1A-eEF1Bα complex. Nat. Struct. Biol. 8, 531–534 [DOI] [PubMed] [Google Scholar]
- 18. Thaw P., Baxter N. J., Hounslow A. M., Price C., Waltho J. P., Craven C. J. (2001) Structure of TCTP reveals unexpected relationship with guanine nucleotide-free chaperones. Nat. Struct. Biol. 8, 701–704 [DOI] [PubMed] [Google Scholar]
- 19. Dong X., Yang B., Li Y., Zhong C., Ding J. (2009) Molecular basis of the acceleration of the GDP-GTP exchange of human ras homolog enriched in brain by human translationally controlled tumor protein. J. Biol. Chem. 284, 23754–23764 [DOI] [PMC free article] [PubMed] [Google Scholar]
- 20. Vedadi M., Lew J., Artz J., Amani M., Zhao Y., Dong A., Wasney G. A., Gao M., Hills T., Brokx S., Qiu W., Sharma S., Diassiti A., Alam Z., Melone M., et al. (2007) Genome-scale protein expression and structural biology of Plasmodium falciparum and related Apicomplexan organisms. Mol. Biochem. Parasitol. 151, 100–110 [DOI] [PubMed] [Google Scholar]
- 21. Eichhorn T., Winter D., Büchele B., Dirdjaja N., Frank M., Lehmann W. D., Mertens R., Krauth-Siegel R. L., Simmet T., Granzin J., Efferth T. (2013) Molecular interaction of artemisinin with translationally controlled tumor protein (TCTP) of Plasmodium falciparum. Biochem. Pharmacol. 85, 38–45 [DOI] [PubMed] [Google Scholar]
- 22. Susini L., Besse S., Duflaut D., Lespagnol A., Beekman C., Fiucci G., Atkinson A. R., Busso D., Poussin P., Marine J. C., Martinou J. C., Cavarelli J., Moras D., Amson R., Telerman A. (2008) TCTP protects from apoptotic cell death by antagonizing bax function. Cell Death Differ. 15, 1211–1220 [DOI] [PubMed] [Google Scholar]
- 23. Hemsley A., Arnheim N., Toney M. D., Cortopassi G., Galas D. J. (1989) A simple method for site-directed mutagenesis using the polymerase chain reaction. Nucleic Acids Res. 17, 6545–6551 [DOI] [PMC free article] [PubMed] [Google Scholar]
- 24. Delaglio F., Grzesiek S., Vuister G. W., Zhu G., Pfeifer J., Bax A. (1995) NMRPipe: a multidimensional spectral processing system based on UNIX pipes. J. Biomol. NMR 6, 277–293 [DOI] [PubMed] [Google Scholar]
- 25. Johnson B. A., Blevins R. A. (1994) NMR View: A computer program for the visualization and analysis of NMR data. J. Biomol. NMR 4, 603–614 [DOI] [PubMed] [Google Scholar]
- 26. Hwang T. L., van Zijl P. C., Mori S. (1998) Accurate quantitation of water-amide proton exchange rates using the phase-modulated CLEAN chemical EXchange (CLEANEX-PM) approach with a Fast-HSQC (FHSQC) detection scheme. J. Biomol. NMR 11, 221–226 [DOI] [PubMed] [Google Scholar]
- 27. Battiste J. L., Wagner G. (2000) Utilization of site-directed spin labeling and high-resolution heteronuclear nuclear magnetic resonance for global fold determination of large proteins with limited nuclear overhauser effect data. Biochemistry 39, 5355–5365 [DOI] [PubMed] [Google Scholar]
- 28. Herrmann T., Güntert P., Wüthrich K. (2002) Protein NMR structure determination with automated NOE assignment using the new software CANDID and the torsion angle dynamics algorithm DYANA. J. Mol. Biol. 319, 209–227 [DOI] [PubMed] [Google Scholar]
- 29. Brünger A. T., Adams P. D., Clore G. M., DeLano W. L., Gros P., Grosse-Kunstleve R. W., Jiang J. S., Kuszewski J., Nilges M., Pannu N. S., Read R. J., Rice L. M., Simonson T., Warren G. L. (1998) Crystallography & NMR system: A new software suite for macromolecular structure determination. Acta Crystallogr. D Biol. Crystallogr. 54, 905–921 [DOI] [PubMed] [Google Scholar]
- 30. Nederveen A. J., Doreleijers J. F., Vranken W., Miller Z., Spronk C. A., Nabuurs S. B., Güntert P., Livny M., Markley J. L., Nilges M., Ulrich E. L., Kaptein R., Bonvin A. M. (2005) RECOORD: A recalculated coordinate database of 500+ proteins from the PDB using restraints from the BioMagResBank. Proteins 59, 662–672 [DOI] [PubMed] [Google Scholar]
- 31. Shen Y., Delaglio F., Cornilescu G., Bax A. (2009) TALOS+: a hybrid method for predicting protein backbone torsion angles from NMR chemical shifts. J. Biomol. NMR 44, 213–223 [DOI] [PMC free article] [PubMed] [Google Scholar]
- 32. Koradi R., Billeter M., Wüthrich K. (1996) MOLMOL: a program for display and analysis of macromolecular structures. J. Mol. Graph. 14, 51–55 [DOI] [PubMed] [Google Scholar]
- 33. Laskowski R. A., Rullmannn J. A., MacArthur M. W., Kaptein R., Thornton J. M. (1996) AQUA and PROCHECK-NMR: programs for checking the quality of protein structures solved by NMR. J. Biomol. NMR 8, 477–486 [DOI] [PubMed] [Google Scholar]
- 34. de Vries S. J., van Dijk M., Bonvin A. M. (2010) The HADDOCK web server for data-driven biomolecular docking. Nat. Protoc. 5, 883–897 [DOI] [PubMed] [Google Scholar]
- 35. Baxter N. J., Thaw P., Higgins L. D., Sedelnikova S. E., Bramley A. L., Price C., Waltho J. P., Craven C. J. (2000) Backbone NMR assignment of the 19-kDa translationally controlled tumor-associated protein p23fyp from Schizosaccharomyces pombe. J. Biomol. NMR 16, 83–84 [DOI] [PubMed] [Google Scholar]
- 36. Olofsson B. (1999) Rho guanine dissociation inhibitors: pivotal molecules in cellular signalling. Cell. Signal. 11, 545–554 [DOI] [PubMed] [Google Scholar]
- 37. Scheffzek K., Stephan I., Jensen O. N., Illenberger D., Gierschik P. (2000) The Rac-RhoGDI complex and the structural basis for the regulation of Rho proteins by RhoGDI. Nat. Struct. Biol. 7, 122–126 [DOI] [PubMed] [Google Scholar]
- 38. Gachet Y., Tournier S., Lee M., Lazaris-Karatzas A., Poulton T., Bommer U. A. (1999) The growth-related, translationally controlled protein P23 has properties of a tubulin binding protein and associates transiently with microtubules during the cell cycle. J. Cell Sci. 112, 1257–1271 [DOI] [PubMed] [Google Scholar]
- 39. Rho S. B., Lee J. H., Park M. S., Byun H. J., Kang S., Seo S. S., Kim J. Y., Park S. Y. (2011) Anti-apoptotic protein TCTP controls the stability of the tumor suppressor p53. FEBS Lett. 585, 29–35 [DOI] [PubMed] [Google Scholar]
- 40. Funston G., Goh W., Wei S. J., Tng Q. S., Brown C., Jiah Tong L., Verma C., Lane D., Ghadessy F. (2012) Binding of translationally controlled tumour protein to the N-terminal domain of HDM2 is inhibited by nutlin-3. PLoS One 7, e42642. [DOI] [PMC free article] [PubMed] [Google Scholar]
- 41. Kashiwakura J. C., Ando T., Matsumoto K., Kimura M., Kitaura J., Matho M. H., Zajonc D. M., Ozeki T., Ra C., MacDonald S. M., Siraganian R. P., Broide D. H., Kawakami Y., Kawakami T. (2012) Histamine-releasing factor has a proinflammatory role in mouse models of asthma and allergy. J. Clin. Invest. 122, 218–228 [DOI] [PMC free article] [PubMed] [Google Scholar]
- 42. Chen Y., Fujita T., Zhang D., Doan H., Pinkaew D., Liu Z., Wu J., Koide Y., Chiu A., Lin C. C., Chang J. Y., Ruan K. H., Fujise K. (2011) Physical and functional antagonism between tumor suppressor protein p53 and fortilin, an anti-apoptotic protein. J. Biol. Chem. 286, 32575–32585 [DOI] [PMC free article] [PubMed] [Google Scholar]
- 43. Kim M., Jung Y., Lee K., Kim C. (2000) Identification of the calcium binding sites in translationally controlled tumor protein. Arch. Pharm. Res. 23, 633–636 [DOI] [PubMed] [Google Scholar]
- 44. Yang Y., Yang F., Xiong Z., Yan Y., Wang X., Nishino M., Mirkovic D., Nguyen J., Wang H., Yang X. F. (2005) An N-terminal region of translationally controlled tumor protein is required for its antiapoptotic activity. Oncogene 24, 4778–4788 [DOI] [PMC free article] [PubMed] [Google Scholar]
- 45. Jung J., Kim M., Kim M. J., Kim J., Moon J., Lim J. S., Kim M., Lee K. (2004) Translationally controlled tumor protein interacts with the third cytoplasmic domain of Na,K-ATPase α subunit and inhibits the pump activity in HeLa cells. J. Biol. Chem. 279, 49868–49875 [DOI] [PubMed] [Google Scholar]
- 46. Hong S. T., Choi K. W. (2013) TCTP directly regulates ATM activity to control genome stability and organ development in Drosophila melanogaster. Nat. Commun. 4, 2986. [DOI] [PubMed] [Google Scholar]
- 47. Zhang F., Liu B., Wang Z., Yu X. J., Ni Q. X., Yang W. T., Mukaida N., Li Y. Y. (2013) A novel regulatory mechanism of Pim-3 kinase stability and its involvement in pancreatic cancer progression. Mol. Cancer Res. 11, 1508–1520 [DOI] [PubMed] [Google Scholar]
- 48. Brown M. P., Grundy W. N., Lin D., Cristianini N., Sugnet C. W., Furey T. S., Ares M., Jr., Haussler D. (2000) Knowledge-based analysis of microarray gene expression data by using support vector machines. Proc. Natl. Acad. Sci. U.S.A. 97, 262–267 [DOI] [PMC free article] [PubMed] [Google Scholar]
- 49. Fleischer T. C., Weaver C. M., McAfee K. J., Jennings J. L., Link A. J. (2006) Systematic identification and functional screens of uncharacterized proteins associated with eukaryotic ribosomal complexes. Genes Dev. 20, 1294–1307 [DOI] [PMC free article] [PubMed] [Google Scholar]
- 50. Atkinson G. C., Kuzmenko A., Chicherin I., Soosaar A., Tenson T., Carr M., Kamenski P., Hauryliuk V. (2014) An evolutionary ratchet leading to loss of elongation factors in eukaryotes. BMC Evol. Biol. 14, 35. [DOI] [PMC free article] [PubMed] [Google Scholar]


