

Background: There is a growing discrepancy between the putative identification and the empirical characterization of carbohydrate-active enzymes (CAZymes).
Results: We have developed a new versatile and high throughput microarray-based method for screening CAZymes.
Conclusion: The method is a powerful addition to the enzyme screening toolbox.
Significance: The technique enables the rapid screening of CAZymes and facilitates our biological understanding and industrial utilization.
Keywords: Glycoside Hydrolase, High Throughput Screening (HTS), Microarray, Monoclonal Antibody, Plant Cell Wall, CAZy Database, Carbohydrate-active Enzymes (CAZymes), Carbohydrate-binding Module, Enzyme Activity, Polysaccharide Degradation
Abstract
Carbohydrate-active enzymes have multiple biological roles and industrial applications. Advances in genome and transcriptome sequencing together with associated bioinformatics tools have identified vast numbers of putative carbohydrate-degrading and -modifying enzymes including glycoside hydrolases and lytic polysaccharide monooxygenases. However, there is a paucity of methods for rapidly screening the activities of these enzymes. By combining the multiplexing capacity of carbohydrate microarrays with the specificity of molecular probes, we have developed a sensitive, high throughput, and versatile semiquantitative enzyme screening technique that requires low amounts of enzyme and substrate. The method can be used to assess the activities of single enzymes, enzyme mixtures, and crude culture broths against single substrates, substrate mixtures, and biomass samples. Moreover, we show that the technique can be used to analyze both endo-acting and exo-acting glycoside hydrolases, polysaccharide lyases, carbohydrate esterases, and lytic polysaccharide monooxygenases. We demonstrate the potential of the technique by identifying the substrate specificities of purified uncharacterized enzymes and by screening enzyme activities from fungal culture broths.
Introduction
Almost all plant cells are encased in a cell wall composed primarily of complex polysaccharides (1). Load-bearing components, principally cellulose and hemicelluloses, are embedded in a matrix of pectic polysaccharides, and in mature secondary walls, further reinforcement is provided by the phenolic polymer lignin (2–4). Cell walls play crucial roles in plant growth and development. They provide structural support, are physical defensive barriers against biotic and abiotic stress, and are a source of oligosaccharide signaling molecules (2, 5, 6). Collectively, plant cell walls are also the largest source of biomass on earth and have received considerable attention in the context of attempts to produce second generation biofuels and chemicals from lignocellulosic feedstocks as an alternative renewable source to fossil fuels (7–9). A vast repertoire of cell wall-degrading enzymes, notably glycoside hydrolases (GHs),3 are produced by microbes, and these are vital for strategies aimed at the deconstruction of cell wall-based feedstocks used for biorefining (10–12). Carbohydrate-degrading and -modifying enzymes are also extensively used in the production of paper, textiles, detergents, feed, and food (13, 14). Endogenous carbohydrate-degrading and -modifying enzymes are central to many plant development processes. For example, GHs are used to cleave polysaccharides during organ abscission, fruit softening, germination, and plant/microbe interactions. Also, plants typically produce methyl- and acetylesterases that are used for fine-tuning the in muro functionalities of cell wall components to suit local requirements (15, 16).
Techniques for mining genomes and metagenomes have developed rapidly in recent years, and so have medium and high throughput strategies for cloning and expressing recombinant enzymes. Furthermore, bioinformatics resources and associated depositories, such as the carbohydrate-active enzymes database (CAZy) (17) have expanded greatly. However, there are considerable challenges inherent in the exploitation of microbial enzyme diversity for industrial purposes, and the empirical determination of enzyme activities has now become a serious bottleneck. For example, it is estimated that, using current methods, we can safely predict the activities of no more than 4% of the proteins within the CAZy (18). Although numerous methods are available for monitoring enzyme activities, they generally have some limitations. Well established techniques based on the analysis of the oligomeric fragments produced by enzymatic hydrolysis, such as chromatography combined with mass spectrometry, are available (19). These approaches are powerful; however, they are labor-intensive and generally not suitable for high throughput screening. Methods based on the measurement of reducing sugars such as the 3,5-dinitrosalicylic acid (20) and the Nelson-Somogyi (21) assays are widely used for rapidly screening GH activities. However, these assays lack polysaccharide specificity because reducing ends from different polysaccharides cannot be distinguished. Chromogenic polysaccharide substrates, such as azurine cross-linked (AZCL) and azo-dyed polymers, are extensively used to screen endo-acting GHs, but the current range of available substrates is limited, and the nature of the chemical modification of these polysaccharides renders them unsuitable substrates for other types of enzymes including esterases and exo-acting GHs. Exo-acting enzymes can be analyzed with para-nitrophenyl substrates, but these compounds can usually only provide information about the degradation of one substrate per reaction and are not effective substrates for all exo-acting enzymes (22–24).
There is therefore a pressing need for the development of new technology for the rapid screening of GHs and other carbohydrate-active enzymes. We describe the development of a semiquantitative method that combines the multiplexing capacity of robotically produced microarrays with the specificity of monoclonal antibodies (mAbs) and carbohydrate binding modules (CBMs). The method is versatile and can be used to assess enzyme activities against both pure substrates and complex mixtures of cell wall components. In addition to GH activities, the technique can be used for the analysis of other polysaccharide-modifying enzymes including carbohydrate esterases, polysaccharide lyases, and lytic polysaccharide monooxygenases. We demonstrate the applicability of the technique for identifying the activities of novel putative enzymes and for screening crude fungal culture broths.
EXPERIMENTAL PROCEDURES
Biological Materials
Commercial enzymes from Megazyme (Bray, Ireland) used in this work are depicted in Table 1. The enzyme mixture Cellic Ctec2; the purified enzymes eNZ1 (endo-1,4-β-xylanase), eNZ2 (endo-1,4-β-xylanase), eNZ3 (endo-1,4-β-glucanase), and eNZ4 (endo-1,4-β-mannanase) (for details, see Table 1); the 24 crude culture broths obtained from the fungi Gibberella zeae, Poronia punctata, Fusarium oxysporum, Magnaporthe grisea, Ustilago maydis, and Deconica inquilina grown under four different conditions (samples were grown for 5 days at pH 6.5–9.0 in two different growth media (yeast extract-peptone-glucose and FG-4)) (Fig. 6); and the crude recombinant Aspergillus nidulans endo-1,4-β-mannanase culture broth (Fig. 9B) were provided by Novozymes (Bagsværd, Denmark). NcLPMO9C was supplied by Vincent G. H. Eijsink.
TABLE 1.
Characterized enzymes and enzyme mixture used in this study
N/A, not applicable.
| Code | Enzyme name | Source | Microorganism | Catalogue no. |
|---|---|---|---|---|
| N/A | α-l-Arabinofuranosidase | Megazyme | Bifidobacterium sp. | E-AFAM2 |
| eCEL | Cellulase | Megazyme | Trichoderma longibrachiatum | E-CELTR |
| N/A | Feruloyl esterase | Megazyme | Rumen microorganism | E-FAERU |
| eGLC | Endo-1,3-β-glucanase | Megazyme | Trichoderma sp. | E-LAMSE |
| N/A | Exo-1,3-β-glucanase | Megazyme | N/A | N/A |
| N/A | Endo-1,3(4)-β-glucanase | Megazyme | Bacillus subtilis | E-LICHN |
| eMAN | Endo-1,4-β-mannanase | Megazyme | Cellvibrio japonicus | E-BMACJ |
| N/A | Pectate lyase | Megazyme | Aspergillus sp. | E-PECLY |
| ePOL | Polygalacturonase M2 | Megazyme | Aspergillus aculeatus | E-PGALUSP |
| eXYL | Endo-1,4-β-xylanase M4 | Megazyme | Aspergillus niger | E-XYAN4 |
| N/A | Exo-1,4-β-xylosidase | Megazyme | Bacillus pumilus | E-BXSEBP |
| eXG | Xyloglucanase (GH5) | Megazyme | Paenibacillus sp. | E-XEGP |
| eNZ1 | Endo-1,4-β-xylanase (GH10) | Novozymes | Aspergillus aculeatus | N/A |
| eNZ2 | Endo-1,4-β-xylanase (GH11) | Novozymes | Thermomyces lanuginosus | N/A |
| eNZ3 | Endo-1,4-β-glucanase (GH5) | Novozymes | Aspergillus aculeatus | N/A |
| eNZ4 | Endo-1,4-β-mannanase (GH5) | Novozymes | Fungal origin (proprietary) | N/A |
| N/A | Cellic Ctec2 | Novozymes | Multienzyme product | N/A |
| N/A | NcLPMO9C | V. G. H. Eijsink | Neurospora crassa | N/A |
FIGURE 6.
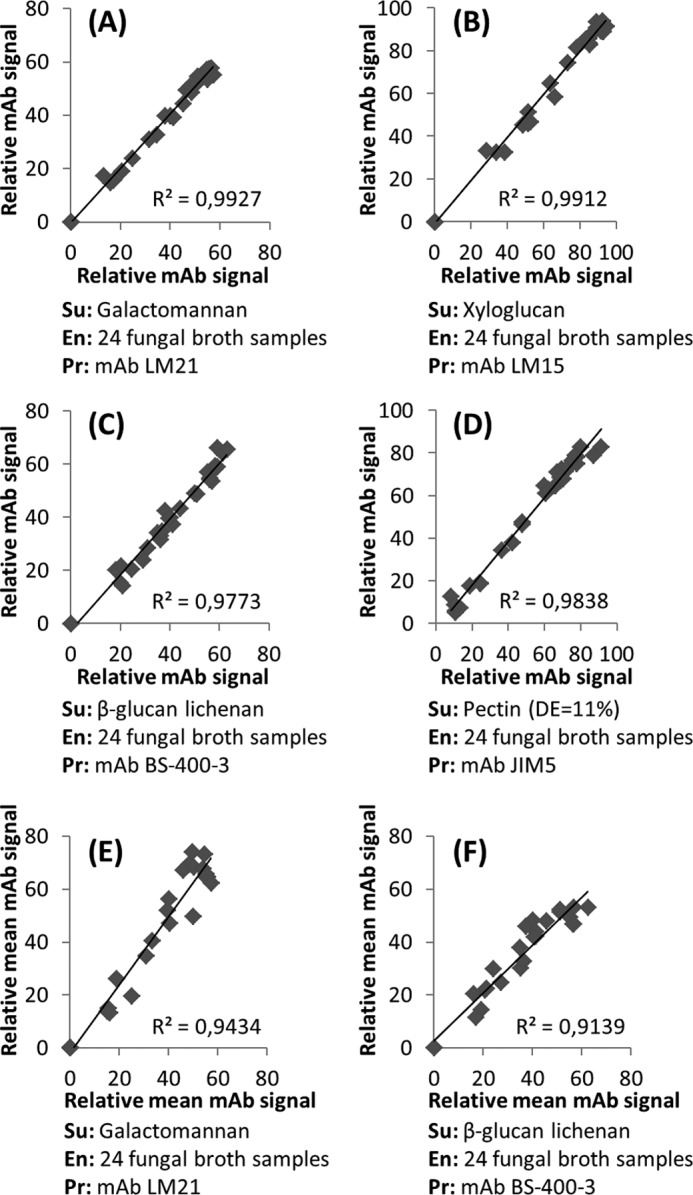
Reproducibility. A–D, reproducibility within an experiment. 24 crude fungal culture broths from six different species (details under “Experimental Procedures”) were incubated with different polysaccharides to test the reproducibility. Duplicates of each reaction were performed in different wells of the same microwell plate, and plate content was printed in the same microarray. Once the data analysis was performed, the antibody signals of the two screening replicates for each of the 24 samples were plotted, and R2 were calculated. A low level of variability was detected in the replicates of the same analysis showed by R2 > 0.97. Axes on the graphs represent relative antibody signal intensities. E and F, reproducibility between experiments was tested by comparing the results obtained by two fully independent analyses. The same sample set as for A–D was analyzed in two separate events using newly prepared polysaccharide substrates (galactomannan and β-glucan lichenan) and performing the incubation, printing, probing, and developing on different days. E and F show the plotted mean antibody signals obtained in the two experiments when analyzing each of the 24 samples, and R2 values >0.90 indicate low variability between analyses. Axes on the graphs represent relative mean (three replicates) spot mAb signals. In all the analyses, substrate concentrations were 0.2 mg/ml, fungal broth samples were 2-fold diluted, and reactions were performed for 2 h at 50 °C. Su, substrate; En, enzymatic samples; Pr, probe. Details of mAbs used are provided in Table 2.
FIGURE 9.

Resolving activities against specific epitopes within complex substrate mixtures. A, three enzymes (xyloglucanase at 0. 001 unit/ml, endo-1,3-β-glucanase at 0.01 unit/ml, and polygalacturonase at 0.01 unit/ml) and an enzyme mixture (Cellic Ctec2 used at 1:20 dilution) listed to the right were tested against the two mixtures of substrates shown to the left, and activities were detected with the probes listed at the top of the heat map. The -fold change values in the heat map show that individual activities can be resolved from the substrate mixtures by the specific binding of the probes. Reactions were performed for 1 h at 40 °C. B, similarly, a crude recombinant A. nidulans endo-1,4-β-mannanase culture broth was also tested against a mixture of polysaccharide substrates. Note that side activities progressively diminished with decreasing broth concentration (shown to the right). Reactions were performed for 1 h at 30 °C. A and B, substrate mixtures contained 0.1 mg/ml (per polysaccharide). RGI, rhamnogalacturonan I; AX, arabinoxylan. Details of enzymes and probes used are provided in Tables 1 and 2, respectively.
Pseudacanthotermes militaris proteins were obtained by the amplification of metagenomic DNA fragments by polymerase chain reaction using Phusion high fidelity DNA polymerase (New England Biolabs). The amplicons were cloned as described (25), and recombinant proteins Pm12, Pm23, and Pm25 were expressed in fusion with a polyhistidine tag, whereas Pm83, Pm84, and Pm85 were produced in fusion with a polyhistidine-thioredoxin tag. Plasmids were used to transform Escherichia coli Rosetta DE3 (Merck Millipore, Germany). For protein expression, the autoinducing medium ZYP-5052 (prepared as described in Ref. 26) supplemented with chloramphenicol (34 μg/ml) was used. Cells were incubated at 37 °C for 5 h and at 17 °C overnight in baffled flasks until an A600 nm of ∼11 was reached. Immobilized metal ion affinity chromatography was performed following the protocol described previously (27) for purification of the recombinant proteins. The concentration of purified proteins was determined using a NanoDrop ND-1000 spectrophotometer (Thermo Fisher Scientific) and applying the Beer-Lambert law. The theoretical extinction coefficient and molecular weight values were determined using the ProtParam service. Sequence data can be found in GenBankTM under the following accession numbers: CCO21106.1 (Pm12), CCO21108.1 (Pm23), CCO21110.1 (Pm25), CCO21640.1 (Pm83), CCO21632.1 (Pm84), and CCO21658.1 (Pm85).
Fungal broth supernatants (Fig. 13) were prepared as follows. Baffled Erlenmeyer flasks (500 ml) with 200 ml of Czapek Dox-based medium with apple pomace (35.3 mm NaNO3, 5.7 mm K2HPO4, 6.7 mm KCl, 2 mm MgSO4, 1 g of Triton-X (0.1%), 1 ml of trace metal solution (36 mm FeSO4, 11.5 mm ZnSO4, 17.5 mm CuSO4) and 20 g of ground apple pomace in 1000 ml of Milli-Q water) were autoclaved and afterward inoculated with ¼ agar plate of Trametes versicolor (DSM-11269, Deutsche Sammlung von Mikroorganismen und Zellkulturen, Germany), 1 × 10⁴ spores of Colletotrichum acutatum (isolate SA 0-1, proprietary), or 1 × 10⁴ spores of Penicillium expansum (isolate IK 2020, proprietary) or mock-inoculated as a negative control. The flasks were incubated at 25 °C with shaking at 150 rpm for 7 days in darkness. Samples were collected from day 2 to 7 under sterile conditions and centrifuged twice for 20 min at 4000 rpm at 4 °C to separate spores from supernatants. Supernatants were collected, frozen in liquid nitrogen, and stored at −80 °C until use.
FIGURE 13.

Screening of enzymes secreted by three fungal species grown in apple pomace medium. Two plant pathogenic (C. acutatum and P. expansum) and one saprotrophic (T. versicolor) fungi were grown in apple pomace medium. Culture broths were collected 2–7 days after inoculation. Culture broths from apple pomace medium (inoculated with water) were collected as controls. Broth supernatants (listed to the right) were incubated without further dilution with two mixtures of polysaccharides (listed at the bottom). The enzyme activities detected by the probes (listed at the top) are shown in the -fold change heat map. All reactions were performed overnight at 25 °C. The concentration of each polysaccharide in the substrate mixtures was 0.1 mg/ml. AX, arabinoxylan; AGP, arabinogalactan protein. Details of probes used are provided in Table 2.
Commercial enzymes were analyzed within their recommended pH range using the following buffers: 0.1 m sodium acetate buffer for pH values 4.0–6.5 and 0.1 m sodium phosphate buffer for pH values 7.0–8.0 except for pH 2–10 analysis where 0.1 m Britton-Robinson buffer was used (Fig. 7). The rest of the samples were analyzed using the following buffers: the eNZ1–4 in 50 mm sodium acetate at pH 5.5; the 24 crude broths (Fig. 6) and the recombinant A. nidulans endo-1,4-β-mannanase broth (Fig. 9B) in 0.1 m sodium acetate, pH 5.5 and pH 5.0, respectively; NcLPMO9C in 0.1 m sodium phosphate, pH 8.0; P. militaris proteins in 0.1 m sodium acetate, pH 6.5; and fungal broths (Fig. 13) in 0.2 m sodium acetate, pH 6. Enzyme concentrations used are given in the figure legends.
FIGURE 7.
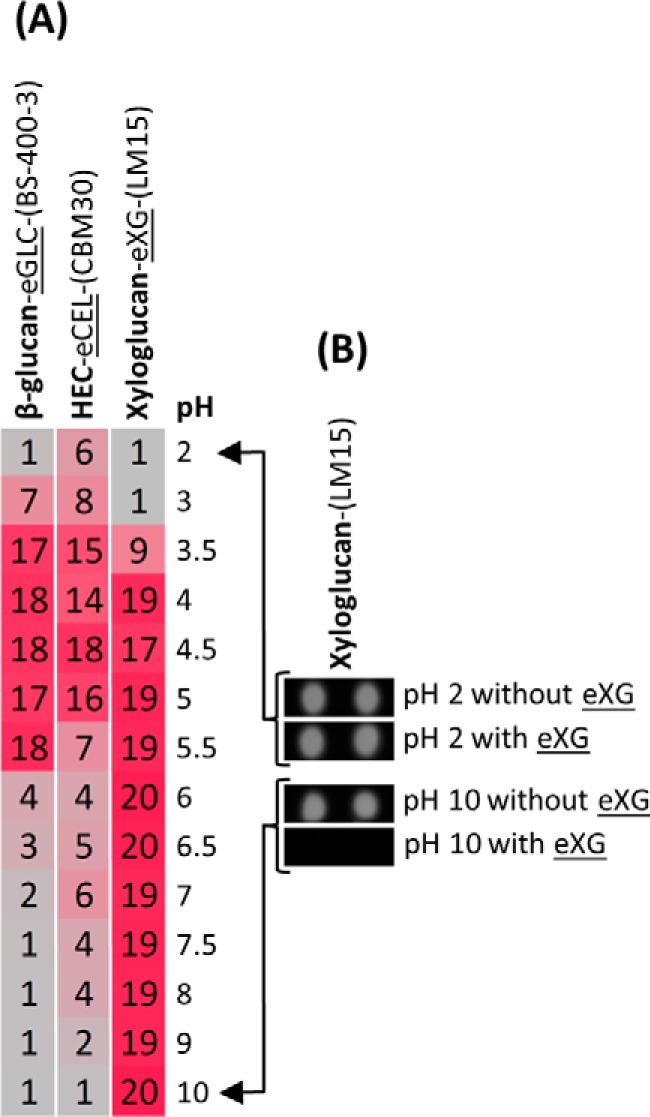
Analysis of pH effect on activity. A, -fold change heat map resulting from analyzing single polysaccharides (0.1 mg/ml) with GHs (0.01 unit/ml) in a range of different pH values (listed to the right). The substrates used are shown in bold text, the enzymes are underlined, and the detecting probes are in parentheses (all indicated at the top). B, an example of signals obtained (raw data) when xyloglucan was treated with and without xyloglucanase (eXG) at pH 2 and 10 and the microarray was probed with mAb LM15. All reactions were performed for 1 h at room temperature. The β-glucan source was barley. HEC, hydroxyethylcellulose. Details of enzymes and probes used are provided in Tables 1 and 2, respectively.
Substrates Used in the Different Experiments
The following defined polysaccharides were used in this work: arabinan (sugar beet), arabinoxylan (wheat flour), β-glucan (barley), β-glucan lichenan (icelandic moss), galactomannan (carob), glucomannan (konjac), pachyman (1,3-β-d-glucan), pectic galactan (lupin), and xyloglucan (tamarind) from Megazyme; gum arabic (acacia tree), hydroxyethylcellulose, and xylan (beechwood) from Sigma-Aldrich; pectin with degrees of methyl esterification (DEs) of 11, 16, and 81% (lime) from DuPont Nutrition Biosciences (Brabrand, Denmark); and feruloylated arabinoxylan (wheat flour) from Institut National de la Recherche Agronomique (Nantes, France). Polysaccharide substrates used in Fig. 10 were extracted as described (28). Briefly, cell wall polysaccharides were extracted from the alcohol-insoluble residues of Arabidopsis thaliana (rosette), Salix alba (willow with bark), Zea mays (corn stover, whole), Hordeum vulgare (barley, stem, and leaves), and Equisetum arvense (horsetail, stem, and leaves). Sequential extractions with 50 mm CDTA and 4 m sodium hydroxide (NaOH) with 1% (v/v) NaBH4 were performed. Extracts were neutralized to pH 6–7 with glacial acetic acid.
FIGURE 10.

Resolving activities against specific epitopes present within extracts of plant polysaccharides. The activities of polygalacturonase (0.01 unit/ml), xyloglucanase (0.001 unit/ml), endo-1,3(4)-β-glucanase (lichenase; 0.1 unit/ml), and Cellic Ctec2 (1:30 diluted) were tested against crude mixtures of polysaccharides extracted with CDTA and NaOH from A. thaliana, willow (S. alba), corn stover (Z. mays), barley (H. vulgare), and horsetail (E. arvense). The heat map values indicate activities against individual epitopes as detected by the probes listed at the top. Reactions were performed for 1 h at 40 °C. RGI, rhamnogalacturonan I; AX, arabinoxylan; AGP, arabinogalactan protein. Details of enzymes and probes used are provided in Tables 1 and 2, respectively.
Preparation of the Substrates
Defined polysaccharides were dissolved in deionized water to 4 mg/ml except for pachyman, which was dissolved in 4 m NaOH. Afterward both single polysaccharides and polysaccharide mixtures were prepared by diluting them in printing buffer (55.2% glycerol, 44% water, 0.8% Triton X-100). Substrate concentrations used (generally 0.1 mg/ml) are specified in the figure legends. Substrate mixtures contained each polysaccharide at the same concentration. Additionally, the pH of pachyman solution was neutralized with glacial acetic acid considering final concentration. Regarding the plant extracted polysaccharides (Fig. 10), a 2-fold dilution followed by a 5-fold dilution was performed in printing buffer.
Sample Incubation and Microarray Printing
Substrate solutions (defined polysaccharides or plant extracts) were added into wells of 384-microwell plates (PP microplate, V-shape, catalogue number 781280, Greiner Bio-One), and afterward the enzymatic samples were added (substrate/sample, 1:1, v/v) to a final volume of 20 μl/well. Controls were prepared for each substrate solution without enzyme, keeping all other conditions identical. Each reaction was performed in triplicate (except plant extracts that had duplicates at two different concentrations). The filled plates were incubated (Ecotron, INFORS HT, Switzerland) at 100 rpm for a specific time and temperature (specified in the figure legends) followed by 10 min at 80 °C. After spinning down the plates for 10 min at 4000 rpm, the plate content was printed at 22 °C and 55% humidity onto nitrocellulose membrane with a pore size of 0.45 μm (Whatman) using a microarray robot (Sprint, Arrayjet, Roslin, UK).
Microarray Probing
The printed arrays were blocked for 1 h in PBS (140 mm NaCl, 2.7 mm KCl, 10 mm Na2HPO4, 1.7 mm KH2PO4, pH 7.5) with 5% (w/v) low fat milk powder (MPBS). Then arrays were incubated for 2 h with probes (for details, see Table 2) that for the different experiments included anti-rat and anti-mouse mAbs and CBMs (PlantProbes, Leeds, UK; Institut National de la Recherche Agronomique, Nantes, France; BioSupplies, Bundoora, Australia; and NZYTech, Lisbon, Portugal). Probes were diluted 1:10, 1:1000, and 10 μg/ml, respectively, in MPBS. Afterward arrays were washed thoroughly in PBS and incubated for 2 h with anti-rat, anti-mouse, or anti-His tag secondary antibodies conjugated to alkaline phosphatase (Sigma) diluted 1:5000 (anti-rat and anti-mouse) or 1:1500 (anti-His tag) in MPBS. Once washed in PBS and deionized water, microarrays were developed in a solution containing 5-bromo-4-chloro-3-indolylphosphate and nitro blue tetrazolium in alkaline phosphatase buffer (100 mm NaCl, 5 mm MgCl2, 100 mm diethanolamine, pH 9.5).
TABLE 2.
Specificities of monoclonal antibodies and CBMs used in this study
G, glucose; X, xylose.
| Probe | Recognized epitope | Ref. |
|---|---|---|
| JIM5 | Partially methyl-esterified/de-esterified HG | 44 |
| JIM7 | Partially methyl-esterified HG | 44 |
| LM18 | Partially methyl-esterified/de-esterified HG | 45 |
| LM19 | Partially methyl-esterified/de-esterified HG | 45 |
| LM20 | Partially methyl-esterified HG | 45 |
| INRA-RU1 | Rhamnogalacturonan I backbone | 46 |
| INRA-RU2 | Rhamnogalacturonan I backbone | 46 |
| LM5 | (1→4)-β-d-Galactan | 47 |
| LM6 | (1→5)-α-l-Arabinan | 48 |
| LM12 | Feruloylated polymers | 49 |
| LM21 | Heteromannan | 50 |
| BS-400-4 | (1→4)-β-d-Mannan | 51 |
| BS-400-2 | (1→3)-β-d-Glucan | 52 |
| BS-400-3 | (1→3)(1→4)-β-d-Glucan | 53 |
| LM15 | Xyloglucan (XXXG motif) | 54 |
| LM25 | Xyloglucan (XXXG/galactosylated) | 49 |
| LM10 | (1→4)-β-d-Xylan | 55 |
| LM11 | (1→4)-β-d-Xylan/arabinoxylan | 55 |
| JIM8 | Arabinogalactan protein | 56 |
| JIM13 | Arabinogalactan protein | 57 |
| CBM3a | Cellulose (crystalline) | 58 |
| CBM30 | (1→4)-β-Glucopolymers | 59 |
| CBM42A | Arabinose-containing polymers | 60 |
Data Analysis
Developed arrays were scanned at 2400 dots/inch (CanoScan 8800F, Søborg, Denmark) and converted to TIFFs; afterward, probe signals were quantified using appropriate software (Array-Pro Analyzer 6.3, Media Cybernetics, Rockville, MD). Maximal mean spot signal intensity was set to 100, and all other values were normalized accordingly. A cutoff of 5 was applied (thus, values lower than 5 were converted to 5). To present the data, -fold change heat maps were produced by calculating the ratio of signal from the control/signal from the enzyme-treated sample. Therefore, ratios >1 indicate detected substrate degradation.
AZCL Assay
AZCL assays were performed in a 96-well plate (PP Microplate, V-shape, catalogue number 651201, Greiner Bio-One) format. All combinations of substrate and enzyme as well as controls without enzyme were performed in triplicate. Solutions of 135 μl of 0.1 m buffer (sodium acetate or phosphate depending on the pH used as specified above) containing a defined unit/ml enzyme and 15 μl of AZCL substrate (10 mg/ml) were incubated (Ecotron) at 100 rpm for a specific time and temperature (specified in the figure legends). Then the solutions were spun down at 4000 rpm for 5 min, and 100 μl of supernatant of each well was transferred to a new plate. The absorbance at 590 nm was detected by using a plate reader (SpectraMax M5, Molecular Devices).
Reducing Sugar Assay
Reducing sugar assays (modified from Ref. 29) were performed by 5-min incubation of 1 mg/ml substrate in 50 mm sodium acetate buffer, pH 5.5 at 50 °C with varied enzyme load followed by cooling. Next a solution containing parahydroxybenzoic acid hydrazide (15 mg/ml), sodium potassium tartrate (50 mg/ml), and NaOH (20 mg/ml) was added followed by 10-min incubation at 95 °C. Subsequently the absorbance at 405 nm was read and compared with standard curves of the substrate monosaccharides.
Validation of Specificities by Matrix-assisted Laser Desorption/Ionization Time-of-flight (MALDI-TOF) Mass Spectrometry (MS) and High Performance Anion-exchange Chromatography (HPAEC)
MALDI-TOF MS was conducted essentially as described (30) except that Dowex 50 treatment and sodium chloride doping were omitted. HPAEC was run as described previously (31).
RESULTS
Development of Microarray-based Enzyme Screening Technology
The method exploits the fact that the activities of enzymes that degrade or modify polysaccharides can be detected by the abolition or diminution of mAb or CBM binding to the particular molecular structure (epitope) affected by enzyme activity (Fig. 1A). Enzyme(s) and substrate(s) are combined in wells of 384-microwell plates, and for each reaction, there is a corresponding no-enzyme buffer control (Fig. 1B). Each reaction and control are performed in triplicate (in separate wells on the same plate). After incubation, multiple identical microarrays are printed from the microwell plates onto nitrocellulose (Fig. 1C). Degradation of polysaccharide substrates is detected by probing each array with separate mAbs or CBMs (Fig. 1D). Antibody binding is detected using a secondary antibody conjugated to an enzyme and used in conjunction with a substrate that yields a colored product. Mean spot antibody signal intensities are then calculated and the difference (-fold change) in signal between the no-enzyme control and the enzyme reaction provides information about enzyme activity (Fig. 1E). A -fold change of “1” indicates that there is essentially no difference in the binding of the probe with or without the enzyme present, and hence the enzyme has no activity against the epitope recognized by that probe. A -fold change >1 indicates that the binding of the probe has been diminished with the enzyme present, and hence that enzyme has activity against the epitope recognized. Diminished probe binding can be caused either directly by the degradation/modification of the epitope or because the polysaccharide has been reduced in size such that it is no longer capable of immobilizing onto the nitrocellulose membrane. -Fold changes can conveniently be displayed as heat maps in which the -fold change values are correlated to color intensity, and this format is used throughout this study. Examples of arrays together with heat maps of mean spot signal intensities and the corresponding -fold changes are shown in Fig. 2. This general approach can be adapted extensively with different permutations of mixtures, enzymes types, and digestion conditions.
FIGURE 1.

Schematic overview of the technique. A, the method is based on the principle that a particular mAb or CBM binds to an epitope on a polysaccharide substrate and that binding is reduced if that polysaccharide is degraded or modified by an enzyme. B, polysaccharide substrates and enzymes are mixed in wells of 384-microwell plates in an appropriate buffer, and for each reaction, there is a corresponding no-enzyme control. Each reaction is performed in triplicate. C, after incubation, the digestion mixtures are printed directly from the 384-microwell plate onto nitrocellulose membranes using a microarray robot. Multiple identical arrays are produced from each plate, corresponding to the number of probes subsequently used. D, microarrays are probed individually with mAbs and/or CBMs, and binding of probes is detected using enzyme-linked secondary antibodies used in conjunction with a substrate that yields a colored product. E, mean spot signal intensities are calculated for each reaction and corresponding control. -Fold changes are then calculated by dividing the mean signal intensities from no-enzyme controls by the mean signal from the enzyme-treated samples.
FIGURE 2.
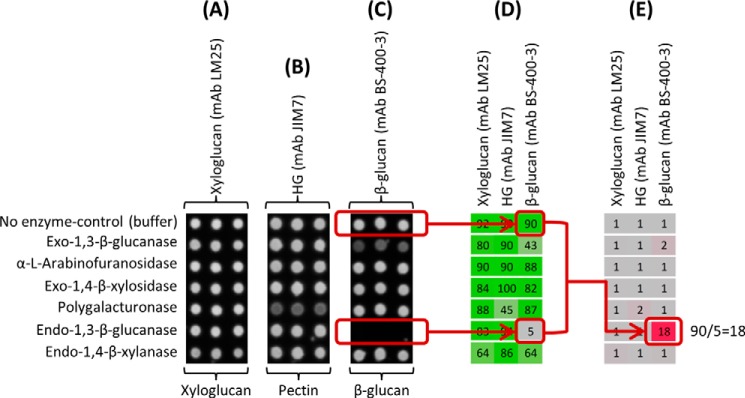
Generation of -fold change heat maps from raw data. A–C, representative examples of arrays produced from a series of reactions involving the incubation (5 h at 30 °C) of several substrates at 0.1 mg/ml including xyloglucan, pectin (DE = 81%), and β-glucan barley (listed at the bottom) with a set of GHs (listed to the left) used at 1 unit/ml and probed with antibodies with specificity for xyloglucan (mAb LM25) (A), HG (mAb JIM7) (B), and (1→3)(1→4)-β-glucan (mAb BS-400-3) (C). D, heat map showing the mean spot signal intensities derived from the triplicates of each reaction. The highest value in the data set is set to 100, and all other values are normalized accordingly. E, -fold change heat map derived from D. -Fold changes are calculated by dividing mean signal intensities from control reactions by mean signal intensities from enzyme-containing reactions. A -fold change >1 indicates that the binding of the probe has been reduced when the enzyme was present in the reaction. In this case the -fold change “18” reveals digestion of the β-glucan (as detected by mAb BS-400-3) by the endo-1,3-β-glucanase. Details of enzymes and probes used are provided in Tables 1 and 2, respectively.
Comparison with Other Enzyme Screening Methods
We analyzed the same set of four purified enzymes eNZ1, eNZ2, eNZ3, and eNZ4 (for enzyme details, see Table 1) using the new technique, by measuring the production of reducing ends, and with AZCL substrates (Fig. 3, A–C). All three techniques confirmed that eNZ1 and eNZ2 have xylanase activity, eNZ3 has β-glucanase activity, and eNZ4 has mannanase activity. None of the enzymes showed activity against galactan, which was used as a negative control.
FIGURE 3.
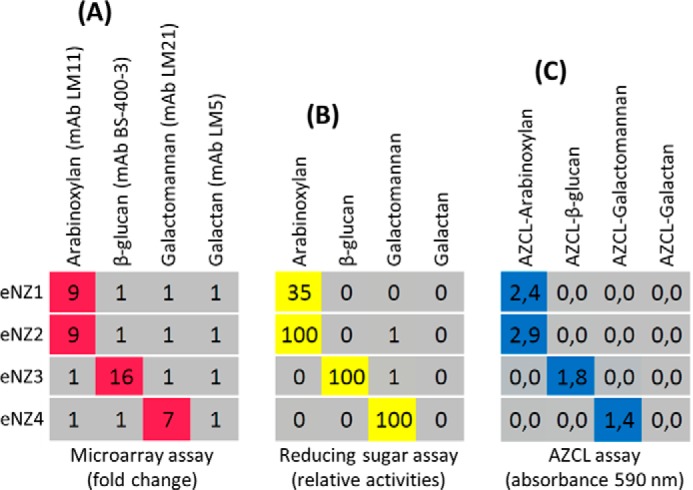
Comparison with reducing sugar assay and AZCL substrates. Four purified enzymes (listed to the left) were tested individually against four substrates (arabinoxylan, β-glucan barley, galactomannan, and galactan) using the new method (A), by a reducing sugar assay (B), and using insoluble AZCL substrates (C). Heat maps show mAb -fold change values, relative reducing end abundance, and absorbances at 590 nm, respectively. All three methods confirmed that eNZ1 and eNZ2 are xylanases, eNZ3 is a β-glucanase, and eNZ4 is a mannanase. None of the enzymes had detectable galactanase activity. Reactions were performed at 50 °C with 1-h incubation for the microarray and AZCL analyses and for 5 min for the reducing sugar assay. Details of enzymes and probes used are provided in Tables 1 and 2, respectively. For details of the reducing sugar assay, see “Experimental Procedures.”
In the case of GHs, it could be possible that a decrease in mAb and CBM binding to a polysaccharide may be caused not by the degradation of the polysaccharide by the catalytic module but rather by the binding of an appended CBM, which could mask the polymer toward the molecular probe. To test this, we incubated arabinoxylan, hydroxyethylcellulose, and xyloglucan with GHs with specific activities against these substrates and with or without CBMs that bound to them (Fig. 4). No differences in -fold changes were observed between samples that had been incubated with both CBM and GH compared with GH alone. Also, no -fold changes >1 were generated when incubating the polysaccharides with their specific CBMs. These data indicate that for these samples at least the detected reductions in mAb and in CBM binding were indeed due to degradation rather than masking of epitopes (Fig. 4B). To provide information about probe binding per se (rather than the indirect effects of changes in binding resulting from epitope degradation), the experimental data were also presented as a heat map of absolute binding values (Fig. 4A). The binding of the anti-arabinoxylan mAb LM11 to arabinoxylan was not inhibited by the presence of the arabinoxylan-binding CBM42A (as evidenced by comparing rows 1 and 3 in Fig. 4A). Similarly, the binding of the probes recognizing hydroxyethylcellulose and xyloglucan was not inhibited by the presence of CBMs recognizing the corresponding polysaccharides (compare rows 1 and 3 of each sub-heat map). Taken together, these data provide evidence that when a CBM is present during the enzyme reaction step this does not affect the outcome of the subsequent probing step. Nevertheless, it is formally possible that in some cases competitive binding of probes versus appended CBMs could be problematic, and if this were suspected a protease treatment step after the enzyme reaction could be included.
FIGURE 4.
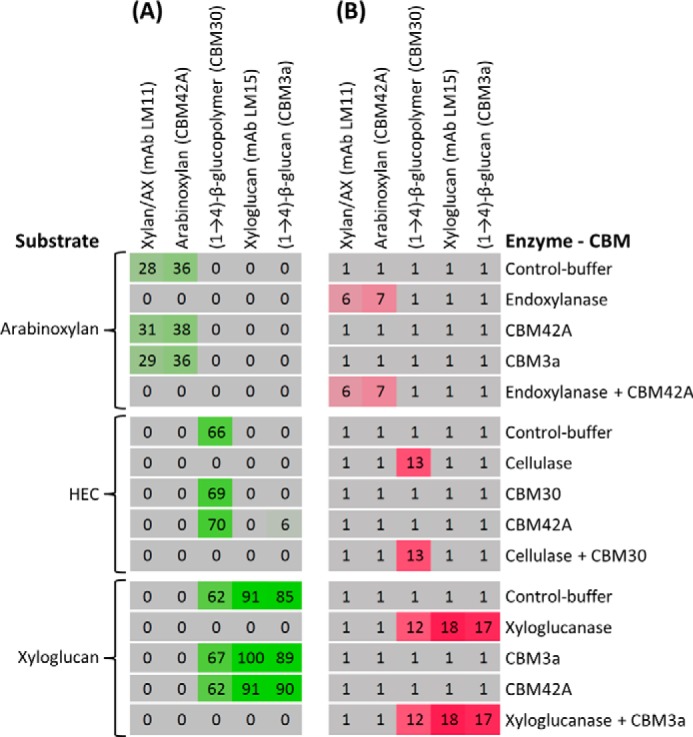
The effects of CBM and GH incubation on polysaccharides probe binding. A, heat map showing the results of incubating three polysaccharide substrates (arabinoxylan, hydroxyethylcellulose (HEC), and xyloglucan) at 0.1 mg/ml with a GH and/or a CBM with specificity toward them. A CBM with no specificity toward the substrate was included as a negative control. GHs and CBMs (shown to the right) were analyzed with the same protein concentration (GHs at 0.1 unit/ml and CBMs at the corresponding μg/ml equivalent to 0.1 unit/ml GH, 1.3, 1.47, and 0.92 μg/ml for CBMs compared with endoxylanase, cellulase, and xyloglucanase, respectively). In each sub-heat map, the first to fifth rows show the results of incubating the polysaccharide with buffer, GH specific for the polysaccharide, CBM specific for the polysaccharide, CBM with no specificity for the polysaccharide, and GH and CBM specific for the polysaccharide simultaneously (both used at the same concentration as separately), respectively. After plate incubation and printing, the resulting microarrays were probed with the mAbs and CBMs shown at the top. The data shown in the heat map are mean probe signal intensities derived from the triplicates of each reaction. The highest value in the data set was set to 100, and all other values were normalized accordingly. B, -fold change heat map derived from A. A cutoff of 5 was applied (thus, values lower than 5 were converted to 0 in A and to 5 in B to create the -fold change heat map). All reactions were performed for 1 h at 40 °C. AX, arabinoxylan. Details of enzymes and probes used are provided in Tables 1 and 2, respectively.
Detection Limits and Reproducibility
Detection limits of the method were assessed by performing a series of digestions using progressively lower concentrations of substrates and enzymes in various combinations (Fig. 5). An example of the raw array output from one such experiment is shown in Fig. 5A in which the substrate was galactomannan, the enzyme was endo-1,4-β-mannanase, and the detecting mAb was LM21 (anti-mannan). The binding of mAb LM21 clearly decreases as the enzyme concentration increases (Fig. 5A). The dosage responses of four enzymes were tested in each case using a single substrate and an appropriate molecular probe for detection of that substrate (Fig. 5B). In the case of endo-1,3-β-glucanase and xyloglucanase (detected using mAbs BS-400-3 and LM15, respectively), the assay was able to detect activity (i.e. -fold change >1) when the enzymes were used at 0.0001 unit/ml (which corresponds to an enzyme concentration of 0.007 μg/ml for the endo-1,3-β-glucanase and 0.0009 μg/ml for the xyloglucanase). In the case of cellulase (detected by CBM30) and endo-1,4-β-mannanase (detected by mAb LM21), the enzyme doses required for detection of activities were 0.0005 and 0.001 unit/ml (equivalent to 0.007 and 0.002 μg/ml), respectively. We compared these detection limits with those obtained using corresponding AZCL substrates with the same enzymes under the same conditions (Fig. 5C). The lowest enzyme concentrations at which color release was detectable were 0.01 unit/ml for endo-1,3-β-glucanase and xyloglucanase (corresponding to 0.7 and 0.09 μg/ml, respectively) and 0.05 unit/ml for cellulase and endo-1,4-β-mannanase (0.7 and 0.1 μg/ml, respectively). These data indicate that the technique described has an improved detection limit (about 2 orders of magnitude enhanced) compared with that typically obtained using AZCL substrates.
FIGURE 5.
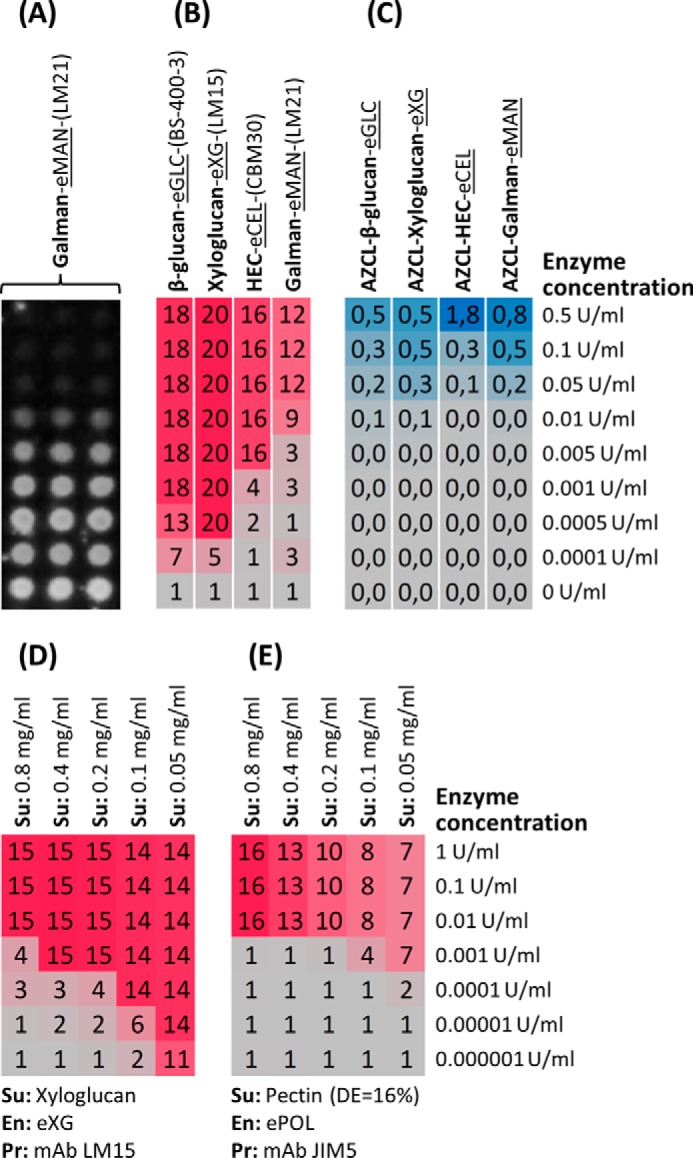
Detection limits and substrate concentration effects. Note that in A–C the substrate used is shown in bold text, the enzyme is underlined, and the detecting probe is in parentheses (all indicated at the top). A, a microarray produced from a reaction involving the digestion of galactomannan substrate (0.1 mg/ml) with endomannanase used at a range of concentrations (listed to the right) and probed with the anti-mannan mAb LM21. This array shows how epitope deletion progressively increases with increasing enzyme concentration. B, -fold change heat map showing the result of the digestion of four different substrates (0.1 mg/ml) with four different GHs used at a range of concentrations (listed to the right). The substrate-enzyme-probe combinations used are shown at the top. C, the same enzymes at the same concentrations were used to digest four AZCL substrates, and the color of the supernatants was measured at 590 nm. Values in the heat map (C) correspond to absorbance units. All reactions were performed for 1 h at room temperature. D and E, -fold change heat maps showing the effect of substrate concentration for two enzyme-substrate combinations: xyloglucanase + xyloglucan (D) and polygalacturonase + pectin (E). In both cases, enzymes were used at a range of concentrations from 0.000001 to 1 unit/ml (listed to the right), and substrates were used at a range of concentrations from 0.05 to 0.8 mg/ml (listed at the top). Note that the detection limit improves with decreasing substrate concentration. Reactions were performed for 2 h at 40 °C. β-Glucan used in B and C was from barley. Galman, galactomannan; HEC, hydroxyethylcellulose; Su, substrate; En, enzyme; Pr, probe. Details of enzymes and probes used are provided in Tables 1 and 2, respectively.
We also tested the activities of two enzymes, xyloglucanase and polygalacturonase, when used in combination with their respective substrates at a range of concentrations to determine the effect of substrate concentration on detection limits (Fig. 5, D and E). In the case of xyloglucanase, there was a clear improvement in detection limit with decreasing substrate concentration (Fig. 5D). When the xyloglucan was used at 0.8 mg/ml, a xyloglucanase concentration of 0.0001 unit/ml (which corresponds to 0.0009 μg/ml) was required for detection of activity, but when used at 0.05 mg/ml, activity was still detectable at a xyloglucanase concentration of 0.000001 unit/ml (0.000009 μg/ml) (Fig. 5D). For polygalacturonase, the effects of reducing the substrate concentration were less pronounced with detection of activity using 0.01 unit/ml (corresponding to 0.04 μg/ml) enzyme when the pectin substrate was used at 0.8 mg/ml and detection at 0.0001 unit/ml (0.0004 μg/ml) when the pectin substrate was used at 0.05 mg/ml (Fig. 5E). These data are consistent with the fact that reduction in antibody binding is likely to be more pronounced as the number of epitopes present in the substrate become limiting. These data also reflect the different avidities of the probes used such that each substrate/probe has a specific relative response to enzyme activity. Although there are clearly variations in the optimal substrate and enzyme concentrations necessary to achieve maximum sensitivity, we found that in most cases a substrate concentration of 0.1 mg/ml and an enzyme concentration of 0.01 unit/ml achieved a good compromise between detection and sensitivity.
Reproducibility of the technique was tested by performing a series of identical analyses and comparing the data from each replicate (Fig. 6). One such example was done by analyzing enzyme activities on crude fungal broths (24 samples from six different species grown at four different conditions). Each sample was incubated separately with a series of different polysaccharide substrates (Fig. 6, A–D). These reactions were duplicated in the same microwell plate, all the reactions were then printed together as microarrays, which were probed with appropriate antibodies, and signal intensities were quantified. Signal intensities from the duplicated incubations were then plotted against each other, and R2 values were calculated to determine correlation coefficients (Fig. 6, A–D). For all four different permutations of substrate and antibody, the R2 values were >0.97, indicating a high level of reproducibility. We also assessed reproducibility between experiments by analyzing the same sample set in two different experiments (incubations were performed in different microwell plates, printed on different microarrays, performed on different days, and performed using newly prepared substrates). In both experiments, each reaction was performed in triplicate, and the mean signal intensity of each sample obtained from each experiment was plotted against each other (Fig. 6, E and F). In this case, the R2 values were lower but still >0.90. The high R2 values in the first set of experiments indicate that the technical variation of the technique is low, and the lower R2 values of the completely independent experiments are most likely due to slight variations in the condition of enzyme or substrate and variations introduced during microarray printing, probing, and developing. All the data presented in this study were produced from experiments in which each reaction and corresponding control were performed in triplicate in the same microwell plate and printed on the same array.
Using the Technique under Different pH Conditions
Because all digestion reactions are performed as liquids in microwell plate wells, it is possible to vary the assay conditions of each digestion as required. The effect of pH on enzyme activity was investigated using an endo-1,3-β-glucanase, a cellulase, and a xyloglucanase at a pH range of 2–10 (Fig. 7A). The analysis indicated that the endo-1,3-β-glucanase and cellulase were most active at a pH between 3.5 and 5.5 and between 3.5 and 5, respectively. The xyloglucanase had a much broader activity range with high activity observed between pH 4 and 10. One interpretation for the apparent high activity of the xyloglucanase even at the highest tested pH could be that the substrate was degraded by the alkaline conditions rather than by the enzyme; however, this could be discounted by direct observation of the arrays themselves, which clearly showed antibody binding to controls that lacked enzyme at pH 10 (Fig. 7B).
Analysis of Lyase, Esterase, Exo-acting Glycoside Hydrolase, and Lytic Polysaccharide Monooxygenase (LPMO) Activities
The essential conditions required for the technique are that the substrate will immobilize into nitrocellulose in its native form and that a mAb or CBM is available with specificity such that its binding to the substrate is altered by the activity of the enzyme in question. With this in mind, we explored the possibility of using this technique for investigating enzyme classes other than endo-acting GHs (Fig. 8). Pectate lyase activity was readily detectable using a pectin substrate with a low DE in combination with the anti-homogalacturonan (HG) mAb LM19 (Fig. 8A). A feruloyl esterase was tested using feruloylated arabinoxylan as substrate. Its activity was detected using mAb LM12, which has specificity for feruloylated polymers (Fig. 8B). As expected, no activity was observed when non-feruloylated arabinoxylan was used as substrate as detected by the anti-xylan/arabinoxylan mAb LM11 (Fig. 8B). An exoxylosidase was assessed using an arabinoxylan substrate, and activity was detected with a -fold change similar to that obtained using an endoxylanase (Fig. 8C). The unexpected capacity of the exoxylosidase to degrade arabinoxylan is most likely attributable to its reported α-l-arabinofuranosidase side activity (Table 1), which may remove the arabinosyl substitutions, thus creating new cleavage sites for the exoxylosidase, which would normally not hydrolyze substituted xylose residues. We also investigated whether this approach could be used to assess LPMO activity (Fig. 8D). An LPMO from Neurospora crassa (NcLPMO9C) has recently been shown to have activity against xyloglucan and other polysaccharides containing (1→4)-β-d-glucan (32), and consistent with this, we detected activity against xyloglucan but not pachyman ((1→3)-β-d-glucan). Low activity was observed when the digestion was performed without reductant, implying that the degradation was indeed the result of oxidative activity (Fig. 8D).
FIGURE 8.

Analyzing lyase, esterase, exo-acting GH, and LPMO activities. -Fold change heat maps showing the use of the method to detect lyase (1 unit/ml) (A), esterase (2 unit/ml) (B), exo- and endo-acting GHs (both at 0.1 unit/ml) (C), and LPMO (5 μg/ml) (D) activities. The reductant used for LPMO analysis was ascorbic acid. All incubations had substrate concentrations of 0.1 mg/ml and were performed for 1 h at 40 °C except for LMPO for which the incubation was performed for 2 h at 50 °C. AX, arabinoxylan. Details of enzymes and probes used are provided in Tables 1 and 2, respectively.
Multiplexed Analysis Using Mixed Polysaccharide Substrates
Using this technique, substrates can be mixed together (i.e. each reaction well may contain mixtures of several polysaccharides), and the activities of individual enzymes can then be resolved by the degradation of epitopes specific to one substrate. This multiplexing capacity is significant not only with regard to increasing the throughput of analysis but also because it enables enzyme and substrates to be combined in mixtures that may more closely resemble the natural operating environment of enzymes.
Examples of multiplexing are shown in Fig. 9A in which three enzymes (xyloglucanase, endo-1,3-β-glucanase, and polygalacturonase) and an enzyme mixture (Cellic Ctec2) were each tested against two different mixtures of substrates. When screening against mixture 1 (containing arabinoxylan, galactomannan, β-glucan barley, pectin, and xyloglucan), xyloglucanase activity was detected using the anti-xyloglucan mAb LM15. Activity of the endo-1,3-β-glucanase was detected in both mixtures by the -fold changes in binding of the anti-(1→3)(1→4)-β-glucan mAb BS-400-3, showing that both (1→3)(1→4)-β-glucan barley and (1→3)(1→4)-β-glucan lichenan were effective substrates for this enzyme. When the polygalacturonase was tested against mixture 2, activity toward the low DE pectin was detected using the anti-HG mAbs JIM5 and JIM7. When this enzyme was screened against mixture 1, a relatively low -fold change of 2 was observed in the binding of mAb JIM5, whereas a higher -fold change of 10 was observed with mAb JIM7, which binds preferentially to high DE pectin. These data suggest that the high DE pectin from mixture 1 contained sufficient non-esterified regions to allow hydrolysis by this polygalacturonase. As expected, Cellic Ctec2 had a broad range of activities evidenced by -fold changes in the binding of multiple mAbs. Especially high (>10) -fold changes were observed for mixture 1 in the binding of JIM5 (HG), LM21, BS-400-4 (mannan), BS-400-3 ((1→3)(1→4)-β-glucan), and LM15 (xyloglucan) and for mixture 2 in the binding of LM21 (mannan) and BS-400-3 ((1→3)(1→4)-β-glucan) (Fig. 9A).
We also tested the potential of the technique for screening activities in recombinant culture broths. As shown in Fig. 9B, a crude recombinant A. nidulans endo-1,4-β-mannanase culture broth was used in combination with a substrate mixture. As expected, when the culture broth was used as a 4-fold dilution, the dominant activity was mannanase (detected by high -fold changes in the binding of the anti-mannan mAbs LM21 and BS-400-4). Apparent side activities against HG, galactan, β-glucan, and arabinoxylan (evidenced by -fold changes >1 in the binding of mAbs JIM5, JIM7, LM5, BS-400-3, and LM11, respectively) were detected, presumably originating from background activities in the host or from components in the growth medium. When used at a 40-fold dilution, only xylanase and minor β-glucanase side activities were detected, but when used at a 4000-fold dilution, only mannanase activity was detectable (Fig. 9B). These data indicate that when analyzing crude broths care is needed to perform assays at a range of broth concentrations to help discriminate between main and side activities. Taken together these data demonstrate that using this technique individual enzyme activities can indeed be resolved when diverse substrates are mixed.
Multiplexed Analysis Using Plant Cell Wall Biomass Substrates
We further extended the scope and complexity of our screening by using cell wall extracts as substrate mixtures. Polysaccharides were extracted from A. thaliana, willow, corn stover, barley, and horsetail by sequential extractions using CDTA and NaOH. After neutralizing the pH, the extracts were used as potential substrates for a polygalacturonase, a xyloglucanase, an endo-1,3(4)-β-glucanase, and the enzyme mixture Cellic Ctec2 (Fig. 10). Pectins would be expected to be extracted with CDTA, and this was reflected in -fold changes in the anti-HG mAbs JIM5, JIM7, LM18, and LM19 when CDTA fractions were treated with Cellic Ctec2 and polygalacturonase. The highest activity against HG was noted for A. thaliana, willow, and horsetail, consistent with the relative abundance of pectin in horsetail and in the type I cell walls of the other two species (2, 33, 34). Activity of the xyloglucanase, evidenced by -fold changes in mAb LM15, was highest when using NaOH fractions from horsetail and A. thaliana with lower levels of activity from willow and no activity from barley and corn stover. We also observed that the xyloglucanase had some side activity against other polysaccharides with β-1,4-d-linkages including (1→3)(1→4)-β-glucan (as shown by the -fold change in mAb BS-400-3). These data are consistent with the side activities of this enzyme as described by the manufacturer (Megazyme). As expected, the endo-1,3(4)-β-glucanase (lichenase) was active on hemicellulosic fractions (NaOH extract) from corn stover, barley, and horsetail (revealed by -fold changes in the binding of mAb BS-400-3), and this is consistent with the presence of this polysaccharide in horsetail and in the type II cell walls of corn stover and barley (2, 33–35). It is worth noting that xylanase activity (as detected by -fold changes in mAbs LM10 and LM11) was detected in Cellic Ctec2 with corn stover and barley NaOH fractions as substrates, reflecting the presence of glucuronoarabinoxylans in these species (2, 36). Xylanase activity was not detected when the A. thaliana and horsetail NaOH fractions were the substrate but was observed when the willow NaOH fraction was used. This is consistent with the fact that the secondary cell walls of the mature, woody willow tissue are richer in xylan than the predominantly primary walls of the A. thaliana material (33, 37).
Uncharacterized Putative Glycoside Hydrolases from P. militaris
Six purified enzyme candidates from the gut microbiome of P. militaris, a fungus-growing termite, were analyzed against a substrate mixture (Fig. 11A). The results indicated that proteins Pm12, Pm23, and Pm25 were xylanases (evidenced by -fold changes in mAbs LM10 and LM11) and Pm83, Pm84, and Pm85 were β-glucanases (-fold changes in mAb BS-400-3) (Fig. 11A). Based on amino acid sequence, the xylanases Pm12 and Pm25 were previously classified in CAZy glycoside hydrolase family GH10 (27). Pm23 (which is the N-terminal module of a putative multimodular xylanase, GH11) could be attributed from BLAST analysis to the DUF303 superfamily, which is a family of unknown function but with putative acetylesterase activities. However, Pm23 cannot at present be classified in any existing CAZy family and thus represents a module of “unknown” function. The three β-glucanases were annotated as GH8 (27). Therefore, apart from Pm23, P. militaris microbiome protein CAZy classification was consistent with the activities we recorded. Furthermore, substrate specificities detected by our method were confirmed with parallel reactions (same incubation conditions and same enzyme and substrate mixture concentrations as those in Fig. 11A) analyzed by MALDI-TOF MS (Figs. 11B and 12A) and HPAEC (Figs. 11C and 12B). Essentially, Pm12, Pm23, and Pm25 proteins released a combination of non-acetylated neutral and acidic xylooligosaccharides, which would be expected from xylanase treatment (38), whereas products from Pm83, Pm84, and Pm85 treatments contained peaks implying activity on the β-glucan substrate.
FIGURE 11.

Activities of uncharacterized P. militaris microbiome proteins. A, the specificities of six purified and uncharacterized P. militaris microbiome proteins (5 μg/ml) shown to the right were analyzed by incubating (overnight at 30 °C) the proteins with a substrate mixture (shown to the left; all components at 0.1 mg/ml) and activities evidenced by the binding of the probes listed at the top. The microarray assay indicated that proteins Pm12, Pm23, and Pm25 were xylanases and proteins Pm83, Pm84, and Pm85 were β-glucanases. B, Pm23 parallel reaction (parallel to A; substrate mixture + Pm23) analyzed by MALDI-TOF MS confirming its xylanase activity (represented as sodium adducts). Please note that the rather intense signals in the region from 300 to 600 m/z are mainly due to matrix peaks. C, external standards (Xyl3–6 and MeGlcAXyl3), Pm12, Pm23, and Pm25 parallel reactions (parallel to those analyzed in A), positive control (Pos. control; substrate mixture + eXYL from Table 1 at 0.01 unit/ml) and negative control (Neg. control; substrate mixture with no enzyme added) were analyzed by HPAEC. The positive control showed essentially the same profile as Pm23. nC, nanocoulomb; *, the corresponding sodium salt of sodium adducts often observed for carbohydrates containing carboxylic acids (30, 43); RGI, rhamnogalacturonan I; AX, arabinoxylan; AGP, arabinogalactan protein; Xyl, xylooligosaccharide; MeGlcAXyl, 4-O-methylglucuronoxylooligosaccharide (aldouronic acid); n/a, not available. Details of probes used are provided in Table 2.
FIGURE 12.

MALDI-TOF MS and HPAEC analysis of uncharacterized P. militaris microbiome proteins. A, Pm83, Pm84, and Pm85 parallel reactions of Fig. 11A (same incubation conditions and same enzyme and substrate mixture concentrations as those analyzed in Fig. 11A), positive control (Pos. control; substrate mixture + eGLC from Table 1 at 0.01 unit/ml) and negative control (Neg. control; substrate mixture with no enzyme added) analyzed by MALDI-TOF MS confirming Pm83, Pm84, and Pm85 β-glucanase activity. B, external standards (Std.) (mixed linkage glucan trimers (G4G3G and G3G4G) and tetramers (G4G4G3G and G4G3G4G)) and the same positive control, negative control, and Pm83, Pm84, and Pm85 parallel reactions as those analyzed in A were analyzed by HPAEC. The peak annotations Glc7, Glc10, and Glc13 are based on the major peaks observed on the same samples in the MALDI-TOF MS spectra and represent mixed linkage glucan oligosaccharides with degrees of polymerization 7, 10, and 13, respectively. nC, nanocoulomb. The substrate mixture contained pectin (DE = 81%), galactomannan, β-glucan barley, gum arabic, and xyloglucan.
Screening Enzyme Activities in Plant Pathogenic and Saprotrophic Fungi
We also assessed the technique for analyzing enzyme activities from a wood-decaying fungus (T. versicolor) and two additional plant pathogenic fungi (C. acutatum and P. expansum) grown in medium containing apple pomace. Culture broths were collected at 2–7 days after inoculation, and their activities were tested using two different substrate mixtures (Fig. 13). T. versicolor displayed a limited repertoire of activities mostly against HG and xylan and to a lesser extent against (1→3)(1→4)-β-glucan. In contrast, both C. acutatum and P. expansum produced a wide range of cell wall-degrading enzymes, and we detected degradation of multiple epitopes including ones associated with pectin, mannan, xylan, xyloglucan, and (1→3)(1→4)-β-glucan. Control incubations were also performed using the apple pomace-containing medium inoculated with sterile distilled water, and some degradation of HG was detected. This activity most likely originated from the medium. Some clear trends in activity levels were observed over the time course of the experiment. For example, in broths from P. expansum, activity against the low DE pectin epitopes (mixture 2) recognized by mAbs LM19 and JIM7 was high initially and then decreased, whereas activity against mannan recognized by mAbs LM21 and BS-400-4 was lower initially but increased rapidly by day 3.
DISCUSSION
The effective and sustainable use of plant biomass is of vital importance for reducing dependence on fossil fuels, and carbohydrate-degrading and -modifying enzymes are important tools in this effort. The semiquantitative technique described here combines the high throughput capacity of microarrays with the specificity of mAbs and CBMs and has several distinct advantages. Substrates are unmodified and are free to interact with enzymes in solution under varied conditions of pH, temperature, and buffer type. The same procedure may be used to screen for endo- and exo-acting GHs, polysaccharide lyases, carbohydrate esterases, and LPMOs. Furthermore, the degradation of individual glycan structures can be detected within complex mixtures of polysaccharides and when multiple enzyme activities are present. This is significant because both in nature and in industrial applications enzymes are often applied as mixtures to complex biomass substrates. The method is high throughput (in 48 h, the activity of at least 200 enzymes or broths can be analyzed in triplicate against 15 polysaccharides) and requires low amounts of enzyme and substrate (such an experiment would require typically <0.0005 unit per enzyme and <1 mg per substrate). The method has high reproducibility and sensitivity with a detection limit in the range of 0.001–0.000001 unit/ml enzyme, which could be optimized by adjustment of the substrate concentration. Because reactions are performed in 384-microwell plates that are loaded directly into microarray robots, we envisage that the technique would potentially be well suited to full or partial automation and would be complementary to associated technologies for colony picking of enzyme-expressing microbes and high throughput protein expression methods. Most of the work described here used commercially available enzymes with well characterized specificities with which our data were consistent. Furthermore, the robustness of our approach was confirmed by parallel analyses of enzymes using AZCL, reducing sugar assay, MALDI-TOF MS, and HPAEC.
The high throughput capacity of microarrays allows multiplexed analysis involving multiple sets of enzymes, substrates, and time points. The potential of this was demonstrated by following the progression of enzyme activity in broths of three fungi growing on apple pomace medium, which revealed clear differences in their secretomes and their temporal regulation (Fig. 13). Our data are consistent with the known natural ecologies of the fungal species tested. T. versicolor typically grows on dead or decaying wood, which contains a limited set of polymers, mostly cellulose, lignin, and xylan (39). C. acutatum and P. expansum are some of the most important fungal pathogens of fruits including apples (40, 41) and are therefore well adapted to grow on apple pomace medium. Fruits contain a rich variety of polysaccharides in primary and secondary walls, and this is reflected in the diverse array of plant cell wall-degrading enzymes secreted by these two fungal species. Our findings suggest that this technique has the potential to aid the screening of the secretomes of lignocellulose-degrading microbes and facilitate the identification of novel microbial sources of cell wall-degrading enzymes.
A previously described functional metagenomics approach (27) was used to investigate the gut microbiome of P. militaris for identification of hemicellulases. In function-driven metagenomics, only clones that respond positively to the screen are selected and further analyzed, making this an attractive alternative to less targeted conventional global metagenomic studies that typically generate vast data sets that are cumbersome to mine for specific activities (42). Identification of the specificities of novel P. militaris microbiome proteins illustrates the potential of the method for enzyme discovery (Fig. 11), and our data were supported by both MALDI-TOF MS and HPAEC analyses. Our findings on Pm23 are particularly intriguing because although we demonstrated this protein has xylanase activity Pm23 cannot presently be assigned to any existing CAZy family. Therefore the possibility exists that Pm23 represents a putative new GH family, although the veracity of this depends on further characterization of this protein and associated bioinformatics analysis.
Although primarily designed as a tool for enzyme specificity screening, the method can also provide information about substrate availability in biomass samples (Fig. 10). The ability to use complex plant materials as substrates is significant because it means that in contrast to other enzyme screening methods an enzyme activity can be detected even if a pure example of the substrate is not available.
One limitation of the technology in its present form is that it is necessary that the material printed onto membranes is soluble. This is because the fine bore piezo electric printing robot we used would be clogged by insoluble material. However, the method could in principle also be used to examine enzyme activities against insoluble crystalline polysaccharides, such as cellulose, if a solenoid-driven wider bore microarray printing robot was used. Although the scope of the technique is constrained by the availability of mAbs and CBMs, the development of high throughput microarray-based screening methods in antibody production and the emergence of CBMs as specific polysaccharide probes have the potential to provide large repertoires of new probes. It is worth noting that the mAb and CBM probes we used are publically available. This together with the decreasing cost of microarray robots means that the technology we have described is feasible for many researchers engaged in enzyme characterization. In conclusion, we believe that the method we have developed will make an important contribution to the discovery of enzymes and the empirical screening of their activities.
Acknowledgments
We thank Dr. Luc Saulnier (Institut National de la Recherche Agronomique, Nantes, France) for providing the feruloylated arabinoxylan and Dr. Mikako Sasa, Dr. Nikolaj Spodsberg, and Dr. Kristian B. R. M. Krogh (Novozymes A/S, Bagsværd, Denmark) for providing samples used in this study.
This work was supported in part by the European Community's Seventh Framework Program (FP7/2007–2013) under the LEANGREENFOOD project (Grant Agreement No. 238084).
- GH
- glycoside hydrolase
- LPMO
- lytic polysaccharide monooxygenase
- HG
- homogalacturonan
- AZCL
- azurine cross-linked
- CBM
- carbohydrate binding module
- CDTA
- diaminocyclohexanetetraacetic acid
- HPAEC
- high performance anion-exchange chromatography
- DE
- degree of methyl esterification
- CAZy
- carbohydrate-active enzymes database.
REFERENCES
- 1. Albersheim P., Darvill A., Roberts K., Sederoff R., Staehelin A. (2011) Plant Cell Walls: from Chemistry to Biology, pp. 37–47, Garland Science, New York [Google Scholar]
- 2. Carpita N. C., Gibeaut D. M. (1993) Structural models of primary cell walls in flowering plants: consistency of molecular structure with the physical properties of the walls during growth. Plant J. 3, 1–30 [DOI] [PubMed] [Google Scholar]
- 3. Cosgrove D. J. (2005) Growth of the plant cell wall. Nat. Rev. Mol. Cell Biol. 6, 850–861 [DOI] [PubMed] [Google Scholar]
- 4. Vanholme R., Demedts B., Morreel K., Ralph J., Boerjan W. (2010) Lignin biosynthesis and structure. Plant Physiol. 153, 895–905 [DOI] [PMC free article] [PubMed] [Google Scholar]
- 5. Malinovsky F. G., Fangel J. U., Willats W. G. (2014) The role of the cell wall in plant immunity. Front. Plant Sci. 5, 178. [DOI] [PMC free article] [PubMed] [Google Scholar]
- 6. Ridley B. L., Neill M. A., Mohnen D. (2001) Pectins: structure, biosynthesis, and oligogalacturonide-related signaling. Phytochemistry 57, 929–967 [DOI] [PubMed] [Google Scholar]
- 7. Jørgensen H., Kristensen J. B., Felby C. (2007) Enzymatic conversion of lignocellulose into fermentable sugars: challenges and opportunities. Biofuels Bioprod. Biorefining 1, 119–134 [Google Scholar]
- 8. Pauly M., Keegstra K. (2008) Cell-wall carbohydrates and their modification as a resource for biofuels. Plant J. 54, 559–568 [DOI] [PubMed] [Google Scholar]
- 9. Himmel M. E., Bayer E. A. (2009) Lignocellulose conversion to biofuels: current challenges, global perspectives. Curr. Opin. Biotechnol. 20, 316–317 [DOI] [PubMed] [Google Scholar]
- 10. Flint H. J., Bayer E. A. (2008) Plant cell wall breakdown by anaerobic microorganisms from the mammalian digestive tract. Ann. N.Y. Acad. Sci. 1125, 280–288 [DOI] [PubMed] [Google Scholar]
- 11. Dashtban M., Schraft H., Qin W. (2009) Fungal bioconversion of lignocellulosic residues; opportunities & perspectives. Int. J. Biol. Sci. 5, 578–595 [DOI] [PMC free article] [PubMed] [Google Scholar]
- 12. van den Brink J., de Vries R. P. (2011) Fungal enzyme sets for plant polysaccharide degradation. Appl. Microbiol. Biotechnol. 91, 1477–1492 [DOI] [PMC free article] [PubMed] [Google Scholar]
- 13. Beg Q. K., Kapoor M., Mahajan L., Hoondal G. S. (2001) Microbial xylanases and their industrial applications: a review. Appl. Microbiol. Biotechnol. 56, 326–338 [DOI] [PubMed] [Google Scholar]
- 14. Kirk O., Borchert T. V., Fuglsang C. C. (2002) Industrial enzyme applications. Curr. Opin. Biotechnol. 13, 345–351 [DOI] [PubMed] [Google Scholar]
- 15. Wolf S., Mouille G., Pelloux J. (2009) Homogalacturonan methyl-esterification and plant development. Mol. Plant 2, 851–860 [DOI] [PubMed] [Google Scholar]
- 16. Franková L., Fry S. C. (2013) Biochemistry and physiological roles of enzymes that 'cut and paste' plant cell-wall polysaccharides. J. Exp. Bot. 64, 3519–3550 [DOI] [PubMed] [Google Scholar]
- 17. Cantarel B. L., Coutinho P. M., Rancurel C., Bernard T., Lombard V., Henrissat B. (2009) The Carbohydrate-Active EnZymes database (CAZy): an expert resource for glycogenomics. Nucleic Acids Res. 37, D233–D238 [DOI] [PMC free article] [PubMed] [Google Scholar]
- 18. Lombard V., Golaconda Ramulu H., Drula E., Coutinho P. M., Henrissat B. (2014) The carbohydrate-active enzymes database (CAZy) in 2013. Nucleic Acids Res. 42, D490–D495 [DOI] [PMC free article] [PubMed] [Google Scholar]
- 19. Peña M. J., Tuomivaara S. T., Urbanowicz B. R., O'Neill M. A., York W. S. (2012) Methods for structural characterization of the products of cellulose- and xyloglucan-hydrolyzing enzymes. Methods Enzymol. 510, 121–139 [DOI] [PubMed] [Google Scholar]
- 20. Miller G. L. (1959) Use of dinitrosalicylic acid reagent for determination of reducing sugar. Anal. Chem. 31, 426–428 [Google Scholar]
- 21. Somogyi M. (1952) Notes on sugar determination. J. Biol. Chem. 195, 19–23 [PubMed] [Google Scholar]
- 22. Honda Y., Kitaoka M. (2004) A family 8 glycoside hydrolase from Bacillus halodurans C-125 (BH2105) is a reducing end xylose-releasing exo-oligoxylanase. J. Biol. Chem. 279, 55097–55103 [DOI] [PubMed] [Google Scholar]
- 23. Lagaert S., Van Campenhout S., Pollet A., Bourgois T. M., Delcour J. A., Courtin C. M., Volckaert G. (2007) Recombinant expression and characterization of a reducing-end xylose-releasing exo-oligoxylanase from Bifidobacterium adolescentis. Appl. Environ. Microbiol. 73, 5374–5377 [DOI] [PMC free article] [PubMed] [Google Scholar]
- 24. Lagaert S., Pollet A., Delcour J. A., Lavigne R., Courtin C. M., Volckaert G. (2011) Characterization of two β-xylosidases from Bifidobacterium adolescentis and their contribution to the hydrolysis of prebiotic xylooligosaccharides. Appl. Microbiol. Biotechnol. 92, 1179–1185 [DOI] [PubMed] [Google Scholar]
- 25. Vincentelli R., Cimino A., Geerlof A., Kubo A., Satou Y., Cambillau C. (2011) High-throughput protein expression screening and purification in Escherichia coli. Methods 55, 65–72 [DOI] [PubMed] [Google Scholar]
- 26. Studier F. W. (2005) Protein production by auto-induction in high-density shaking cultures. Protein Expr. Purif. 41, 207–234 [DOI] [PubMed] [Google Scholar]
- 27. Bastien G., Arnal G., Bozonnet S., Laguerre S., Ferreira F., Fauré R., Henrissat B., Lefèvre F., Robe P., Bouchez O., Noirot C., Dumon C., O'Donohue M. (2013) Mining for hemicellulases in the fungus-growing termite Pseudacanthotermes militaris using functional metagenomics. Biotechnol. Biofuels 6, 78. [DOI] [PMC free article] [PubMed] [Google Scholar]
- 28. Moller I., Sørensen I., Bernal A. J., Blaukopf C., Lee K., Øbro J., Pettolino F., Roberts A., Mikkelsen J. D., Knox J. P., Bacic A., Willats W. G. (2007) High-throughput mapping of cell-wall polymers within and between plants using novel microarrays. Plant J. 50, 1118–1128 [DOI] [PubMed] [Google Scholar]
- 29. Lever M. (1973) Colorimetric and fluorometric carbohydrate determination with p-hydroxybenzoic acid hydrazide. Biochem. Med. 7, 274–281 [DOI] [PubMed] [Google Scholar]
- 30. Westereng B., Coenen G. J., Michaelsen T. E., Voragen A. G., Samuelsen A. B., Schols H. A., Knutsen S. H. (2009) Release and characterization of single side chains of white cabbage pectin and their complement-fixing activity. Mol. Nutr. Food Res. 53, 780–789 [DOI] [PubMed] [Google Scholar]
- 31. Westereng B., Agger J. W., Horn S. J., Vaaje-Kolstad G., Aachmann F. L., Stenstrøm Y. H., Eijsink V. G. (2013) Efficient separation of oxidized cello-oligosaccharides generated by cellulose degrading lytic polysaccharide monooxygenases. J. Chromatogr. A 1271, 144–152 [DOI] [PubMed] [Google Scholar]
- 32. Agger J. W., Isaksen T., Várnai A., Vidal-Melgosa S., Willats W. G., Ludwig R., Horn S. J., Eijsink V. G., Westereng B. (2014) Discovery of LPMO activity on hemicelluloses shows the importance of oxidative processes in plant cell wall degradation. Proc. Natl. Acad. Sci. U.S.A. 111, 6287–6292 [DOI] [PMC free article] [PubMed] [Google Scholar]
- 33. Vogel J. (2008) Unique aspects of the grass cell wall. Curr. Opin. Plant Biol. 11, 301–307 [DOI] [PubMed] [Google Scholar]
- 34. Sørensen I., Pettolino F. A., Wilson S. M., Doblin M. S., Johansen B., Bacic A., Willats W. G. (2008) Mixed-linkage (1→3),(1→4)-β-D-glucan is not unique to the Poales and is an abundant component of Equisetum arvense cell walls. Plant J. 54, 510–521 [DOI] [PubMed] [Google Scholar]
- 35. Burton R. A., Wilson S. M., Hrmova M., Harvey A. J., Shirley N. J., Medhurst A., Stone B. A., Newbigin E. J., Bacic A., Fincher G. B. (2006) Cellulose synthase-like CslF genes mediate the synthesis of cell wall (1,3;1,4)-β-D-glucans. Science 311, 1940–1942 [DOI] [PubMed] [Google Scholar]
- 36. Carpita N. C. (1996) Structure and biogenesis of the cell walls of grasses. Annu. Rev. Plant Physiol. Plant Mol. Biol. 47, 445–476 [DOI] [PubMed] [Google Scholar]
- 37. Wan Y., Gritsch C., Tryfona T., Ray M. J., Andongabo A., Hassani-Pak K., Jones H. D., Dupree P., Karp A., Shewry P. R., Mitchell R. A. (2014) Secondary cell wall composition and candidate gene expression in developing willow (Salix purpurea) stems. Planta 239, 1041–1053 [DOI] [PMC free article] [PubMed] [Google Scholar]
- 38. Biely P., Cziszárová M., Uhliariková I., Agger J. W., Li X.-L., Eijsink V. G., Westereng B. (2013) Mode of action of acetylxylan esterases on acetyl glucuronoxylan and acetylated oligosaccharides generated by a GH10 endoxylanase. Biochim. Biophys. Acta 1830, 5075–5086 [DOI] [PubMed] [Google Scholar]
- 39. Irbe I., Elisashvili V., Asatiani M. D., Janberga A., Andersone I., Andersons B., Biziks V., Grinins J. (2014) Lignocellulolytic activity of Coniophora puteana and Trametes versicolor in fermentation of wheat bran and decay of hydrothermally modified hardwoods. Int. Biodeterior. Biodegradation 86, 71–78 [Google Scholar]
- 40. Peres N. A., Timmer L. W., Adaskaveg J. E., Correll J. C. (2005) Lifestyles of Colletotrichum acutatum. Plant Dis. 89, 784–796 [DOI] [PubMed] [Google Scholar]
- 41. Prusky D., McEvoy J. L., Saftner R., Conway W. S., Jones R. (2004) Relationship between host acidification and virulence of Penicillium spp. on apple and citrus fruit. Phytopathology 94, 44–51 [DOI] [PubMed] [Google Scholar]
- 42. Steele H. L., Jaeger K. E., Daniel R., Streit W. R. (2009) Advances in recovery of novel biocatalysts from metagenomes. J. Mol. Microbiol. Biotechnol. 16, 25–37 [DOI] [PubMed] [Google Scholar]
- 43. Coenen G. J., Bakx E. J., Verhoef R. P., Schols H. A., Voragen A. G. J. (2007) Identification of the connecting linkage between homo- or xylogalacturonan and rhamnogalacturonan type I. Carbohydr. Polym. 70, 224–235 [Google Scholar]
- 44. Clausen M. H., Willats W. G., Knox J. P. (2003) Synthetic methyl hexagalacturonate hapten inhibitors of anti-homogalacturonan monoclonal antibodies LM7, JIM5 and JIM7. Carbohydr. Res. 338, 1797–1800 [DOI] [PubMed] [Google Scholar]
- 45. Verhertbruggen Y., Marcus S. E., Haeger A., Ordaz-Ortiz J. J., Knox J. P. (2009) An extended set of monoclonal antibodies to pectic homogalacturonan. Carbohydr. Res. 344, 1858–1862 [DOI] [PubMed] [Google Scholar]
- 46. Ralet M. C., Tranquet O., Poulain D., Moïse A., Guillon F. (2010) Monoclonal antibodies to rhamnogalacturonan I backbone. Planta 231, 1373–1383 [DOI] [PubMed] [Google Scholar]
- 47. Jones L., Seymour G. B., Knox J. P. (1997) Localization of pectic galactan in tomato cell walls using a monoclonal antibody specific to (1→4)-β-D-galactan. Plant Physiol. 113, 1405–1412 [DOI] [PMC free article] [PubMed] [Google Scholar]
- 48. Willats W. G., Marcus S. E., Knox J. P. (1998) Generation of monoclonal antibody specific to (1→5)-α-L-arabinan. Carbohydr. Res. 308, 149–152 [DOI] [PubMed] [Google Scholar]
- 49. Pedersen H. L., Fangel J. U., McCleary B., Ruzanski C., Rydahl M. G., Ralet M. C., Farkas V., von Schantz L., Marcus S. E., Andersen M. C., Field R., Ohlin M., Knox J. P., Clausen M. H., Willats W. G. (2012) Versatile high resolution oligosaccharide microarrays for plant glycobiology and cell wall research. J. Biol. Chem. 287, 39429–39438 [DOI] [PMC free article] [PubMed] [Google Scholar]
- 50. Marcus S. E., Blake A. W., Benians T. A., Lee K. J., Poyser C., Donaldson L., Leroux O., Rogowski A., Petersen H. L., Boraston A., Gilbert H. J., Willats W. G., Knox J. P. (2010) Restricted access of proteins to mannan polysaccharides in intact plant cell walls. Plant J. 64, 191–203 [DOI] [PubMed] [Google Scholar]
- 51. Pettolino F. A., Hoogenraad N. J., Ferguson C., Bacic A., Johnson E., Stone B. A. (2001) A (1→4)-β-mannan-specific monoclonal antibody and its use in the immunocytochemical location of galactomannans. Planta 214, 235–242 [DOI] [PubMed] [Google Scholar]
- 52. Meikle P. J., Bonig I., Hoogenraad N. J., Clarke A. E., Stone B. A. (1991) The location of (1→3)-β-glucans in the walls of pollen tubes of Nicotiana alata using a (1→3)-β-glucan-specific monoclonal antibody. Planta 185, 1–8 [DOI] [PubMed] [Google Scholar]
- 53. Meikle P. J., Hoogenraad N. J., Bonig I., Clarke A. E., Stone B. A. (1994) A (1→3,1→4)-β-glucan-specific monoclonal antibody and its use in the quantitation and immunocyto-chemical location of (1→3,1→4)-β-glucans. Plant J. 5, 1–9 [DOI] [PubMed] [Google Scholar]
- 54. Marcus S. E., Verhertbruggen Y., Hervé C., Ordaz-Ortiz J. J., Farkas V., Pedersen H. L., Willats W. G., Knox J. P. (2008) Pectic homogalacturonan masks abundant sets of xyloglucan epitopes in plant cell walls. BMC Plant Biol. 8, 60. [DOI] [PMC free article] [PubMed] [Google Scholar]
- 55. McCartney L., Marcus S. E., Knox J. P. (2005) Monoclonal antibodies to plant cell wall xylans and arabinoxylans. J. Histochem. Cytochem. 53, 543–546 [DOI] [PubMed] [Google Scholar]
- 56. Pennell R. I., Janniche L., Kjellbom P., Scofield G. N., Peart J. M., Roberts K. (1991) Developmental regulation of a plasma membrane arabinogalactan protein epitope in oilseed rape flowers. Plant Cell 3, 1317–1326 [DOI] [PMC free article] [PubMed] [Google Scholar]
- 57. Knox J. P., Linstead P. J., Peart J., Cooper C., Roberts K. (1991) Developmentally regulated epitopes of cell surface arabinogalactan proteins and their relation to root tissue pattern formation. Plant J. 1, 317–326 [DOI] [PubMed] [Google Scholar]
- 58. Blake A. W., McCartney L., Flint J. E., Bolam D. N., Boraston A. B., Gilbert H. J., Knox J. P. (2006) Understanding the biological rationale for the diversity of cellulose-directed carbohydrate-binding modules in prokaryotic enzymes. J. Biol. Chem. 281, 29321–29329 [DOI] [PubMed] [Google Scholar]
- 59. Najmudin S., Guerreiro C. I., Carvalho A. L., Prates J. A., Correia M. A., Alves V. D., Ferreira L. M., Romão M. J., Gilbert H. J., Bolam D. N., Fontes C. M. (2006) Xyloglucan is recognized by carbohydrate-binding modules that interact with β-glucan chains. J. Biol. Chem. 281, 8815–8828 [DOI] [PubMed] [Google Scholar]
- 60. Ribeiro T., Santos-Silva T., Alves V. D., Dias F. M., Luís A. S., Prates J. A., Ferreira L. M., Romão M. J., Fontes C. M. (2010) Family 42 carbohydrate-binding modules display multiple arabinoxylan-binding interfaces presenting different ligand affinities. Biochim. Biophys. Acta 1804, 2054–2062 [DOI] [PubMed] [Google Scholar]