

Abstract
Forty faba bean (Vicia faba L.) genotypes were evaluated for their agro-morphological performance and molecular diversity under Central Region of Saudi Arabia conditions during 2010–11 and 2011–12 seasons. Field performance results showed that faba genotypes exhibited a significant amount of variation for their agro-morphological studied parameters. Giza40 recorded the tallest genotype (139.5 cm), highest number of seeds per plants (100.8), and the highest seed yield per plant (70.8 g). The best performing genotypes were Giza40, FLIP03-014FB, Gazira1 and Goff1. Genetic variability among genotypes was determined using Sequence Related Amplified Polymorphism (SRAP) and Amplified Fragment Length Polymorphism (AFLP) markers. A total of 183 amplified fragments (alleles) and 1758 polymorphic fragments (bands) in SRAP and 202 alleles and 716 bands in AFLP were obtained using six SRAP and four AFLP primer combinations respectively. Polymorphism information content (PIC) values for AFLP and SRAP markers were higher than 0.8, indicating the existence of a considerable amount of genetic diversity among faba tested genotypes. The UPGMA based clustering of faba genotypes was largely based on origin and/or genetic background. Result of cluster analysis based on SRAP showed weak and not significant correlation while, it was highly significant based on AFLP analysis with agro-morphological characters (r = 0.01, p > 0.54 and r = 0.26, p < 0.004 respectively). Combined SRAP and AFLP markers proved to be significantly useful for genetic diversity assessment at molecular level. They exhibited high discrimination power, and were able to distinguish the faba bean genotypes with high efficiency and accuracy levels.
Keywords: Faba bean, Molecular diversity, SRAP, AFLP
1. Introduction
Faba bean (Vicia faba L.) is one of the most important legumes for its seed high protein content and nutritional value (Crepona et al., 2010). The crop is widely cultivated for use in both human food and animals feed. The world production of faba beans reaches 4.3 Million tons from total cultivated area of 2.55 Million hectares (FAOSTAT, 2012). Faba bean seeds contain relatively high proteins, carbohydrates, vitamins B, antioxidants and minerals. Protein content in different varieties varies from 26% to 41% (Picard, 1977). Carbohydrate contents varies from 51% to 68%, of which major proportion is contributed by starch (41–53%) (Cerning et al., 1975). Common bean exhibits significant antioxidant activities such as flavonoids, polyphenols and phenolics. The antioxidant properties of phenolic compounds may provide excellent dietary source for natural antioxidant for chronic disease prevention and health promotion (Oomah et al., 2006).
Genetic variation among faba bean genotypes is imperative for their efficient utilization in plant breeding schemes and effective conservation. Though morphological and agronomic traits are routinely used to access genetic diversity, they are not enough in numbers to cover the genome, are affected by environmental factors and developmental stage dependent. Development of molecular markers provided reliable information for evaluating and assessing the genetic diversity of V. faba germplasm; RAPD (Link et al., 1995; Alghamdi, 2008; Yassine et al., 2014), ISSR (Terzopoulos and Bebeli, 2008; Alghamdi et al., 2011), AFLP (Zeid et al., 2003) SSR (Pozarkova et al., 2002; Gong et al., 2010, 2011; Ma et al., 2011; Kaur et al., 2012; Yang et al., 2012; Yassine et al., 2014), and SRAP (Alghamdi et al., 2012). Molecular markers are sufficient in numbers, not influenced by environmental factors or by development stages (Bebeli and Kaltsikes, 1993).
Sequence-Related Amplified Polymorphism (SRAP) is a simple and efficient molecular marker technique with reasonable throughput rate, ability to disclose numerous co-dominant markers, more reproducible than RAPDs and are easier to assay than AFLPs and, most importantly, targeting of open reading frames (ORFs)(Li and Quiros, 2001). It was used in assessing genetic diversity in legumes including lentil (Rana et al., 2009), pea (Esposito et al., 2007) and Alfalfa (Vandemark et al., 2006; Ariss and Vandemark, 2007; Castonguay et al., 2010; Al-Faifi et al., 2013). It has been used for genetic diversity and phylogenetic studies in faba bean (Alghamdi et al., 2012).
Amplified Fragment Length Polymorphism (AFLP) is considered ideal marker system for DNA fingerprinting and diversity assessment (Vos et al., 1995). It was used for detection of genetic diversity among faba bean accessions (Zeid et al., 2003). Eight selected AFLP primer combinations produced 477 polymorphic fragments among 79 inbred faba lines. In another study, a sample of 39 spring type faba bean landraces from four provinces in China, were compared in diversity with 136 spring accessions from the rest of the world, including Africa, Canada, Asia, Europe, and 41 breeding lines from ICARDA (Zong et al., 2010).
This study aimed to evaluate field performance of forty faba bean genotypes, using agro-morphological traits and to assess levels of genetic diversity at molecular level using AFLP and SRAP molecular markers.
2. Materials and methods
Forty genotypes of faba bean were selected for this study. They included 33 accessions introduced from ICARDA and 7 local and exotic faba genotypes grown and adapted to Saudi ecosystem. The pedigree and origin of the selected faba bean genotypes are presented in Table 1. These accessions were grown at Dirab Experiments and Agricultural Research Station, South Riyadh (24° 43′ 34″ N, 46° 37′ 15″ E) in RCBD with three replications for two seasons 2010–11 and 2011–12. Seeds of faba bean genotypes were planted on 20th of October for the first season and on 1st of November for the second season. Monthly maximum and minimum temperature were recorded during the growing month (Supplementary Table 1). Seeds of faba bean genotypes were planted in two rows 3 m long with 50 cm distance between rows and 20 cm apart (3.0 m2). Soil analysis classified soil as loamy sand with 0.3% organic matter and N% of 13.1, 20.6 ppm of absorbable P and 86.6 ppm of absorbable K. All cultural practices were applied as recommended, Diammonium phosphate (18%N2, 46%P2O5) was added at the rate of 300 kg/ha during seed bed preparation. Seed inoculated by coating seed with Rhizobium (Rhizobium leguminosarum, Vicia ICARDA-441) before sowing was provided from Agriculture Research Centre/Giza, Egypt. Plots were immediately irrigated after sowing and then subsequently irrigated according to reading of class “A” pan 50% evaporation rate. Data on days to 50% flowering and 95% of maturing were taken by visual observation. At maturity, 10 randomly selected plants were used to measure agro-morphological traits i.e. plant height was measured from soil surface to the upper most tip of the plant, number of pods bearing branches/plant, number of pods/plant, number of seeds/plant and seed yield/plant.
Table 1.
Genotype name, pedigree and origin of 40 faba bean selected genotypes.
| Genotype | Pedigree | Origin | Genotype | Pedigree | Origin |
|---|---|---|---|---|---|
| WRB 1-3 | White flower × ILB 1270-BC | UK | FLIP03-016FB | HBP/S0 F/2033 Fam. 76 | ICARDA |
| WBR 2-7 | White flower × ILB 1270 BC | UK | FLIP03-017FB | HBP/S0 F/2033 Fam. 81 | ICARDA |
| WRB 1-4 | White flower × ILB 1270 BC | UK | FLIP03-018FB | HBP/S0 F/2033 Fam. 42 | ICARDA |
| WRB 1-5 | White flower × ILB 1270 BC | UK | FLIP03-019FB | HBP/S0 F/2033 Fam. 45 | ICARDA |
| WRB 2-1 | White flower × ILB 1270 BC | UK | FLIP03-020FB | HBP/S0 F/2033 Fam. 70 | ICARDA |
| FLIP03-001FB | Fam. 2-4-2 TW × ILB 938 | ICARDA | FLIP03-021FB | Fam. 2-4-1 TW × ILB 938 BC | ICARDA |
| FLIP03-002FB | HBP/S0 F/2033, Fam. 46 | ICARDA | FLIP03-022FB | Fam. 2-1-4 TW × ILB 938BC | ICARDA |
| FLIP03-003FB | HBP/S0 F/2033, Fam. 48 | ICARDA | FLIP03-023FB | Fam. 2-2-1 TW × ILB 938BC | ICARDA |
| FLIP03-004FB | White flower × ILB 1270 BC | ICARDA | FLIP03-024FB | Fam. 2-1-2 TW × ILB 938BC | ICARDA |
| FLIP03-005FB | HBP/S0 F/2033, Fam. 91 | ICARDA | FLIP03-025FB | HBP/S0C/03 Fam. 90 | ICARDA |
| FLIP03-006FB | White flower × ILB 1270 BC | ICARDA | FLIP03-026FB | Fam. 2-4-3 TW × ILB 938 | ICARDA |
| FLIP03-007FB | White flower × ILB 1270 BC | ICARDA | FLIP03-027FB | HPB/S0 F/2003, Fam. 8 | ICARDA |
| FLIP03-008FB | HBP/S0 F/2033 Fam. 29 | ICARDA | FLIP03-028FB | HBP/S0 C/2003, Fam. 51 | ICARDA |
| FLIP03-009FB | HBP/S0 F/2033 Fam. 62 | ICARDA | Reina Blanca | Cultivar | Spain |
| FLIP03-010FB | HBP/S0 F/2033 Fam. 2 | ICARDA | Population 3 | Selected from Yossef A’Sdek cultivar | Egypt |
| FLIP03-011FB | HBP/S0 F/2033 Fam. 32 | ICARDA | Giza40 | Cultivar | Egypt |
| FLIP03-012FB | HBP/S0 F/2033 Fam. 51 | ICARDA | Hassawi1 | Land races | KSA |
| FLIP03-013FB | HBP/S0 F/2033 Fam. 61 | ICARDA | Goff1 | Land races | KSA |
| FLIP03-014FB | HBP/S0 F/2033 Fam. 63 | ICARDA | Gazira1 | Land races | Sudan |
| FLIP03-015FB | HBP/S0 F/2033 Fam. 71 | ICARDA | Triple White | Variety | Sudan |
Statistical analysis was performed for each season separately and after confirmation of errors compatibility for the two seasons, combined analysis was applied according to standard analysis of variance technique for RCBD design using MSTATC computer software and means were separated using Fisher’s protected least significance difference (LSD) test at 0.05 level of probability (Steel and Torrie, 1980).
For molecular characterization, two-week old faba bean leaves from 40 selected genotypes were collected, dropped in liquid N2, and stored at −80 °C until DNA isolation. DNA isolation was carried out using a modified SDS protocol as described by Alghamdi et al. (2012). Six SRAP and four AFLP primer combinations were used to estimate genetic diversity among faba bean genotypes. The SRAP primer name and sequence used are shown in Table 2. SRAP–PCR reaction was performed in 20 μl volume containing 1× GoTaq Green Master Mix (Cat. No. M7123, Promega Corporation, Madison, USA), 0.25 μM from each forward and reverse primers, 50 ng template DNA and nuclease-free water up to 20 μl. The forward primers were 5′end labeled with FAM dye. Amplification was carried out on a TC-5000 thermal cycler (Bibby Scientific – UK) as follows: initial denaturation at 94 °C for 5 min followed by five cycles of denaturation at 94 °C for 1 min, annealing at 35 °C for 1 min and elongation at 72 °C for 1 min. In the remaining 30 cycles, the annealing temperature was increased to 50 °C for 1 min with a final extension step at 72 °C for 7 min. AFLP analysis was performed following the procedure in PE Biosystems plant mapping kit (Applied Biosystems, Foster city, CA, USA.) using a modified procedure from Vos et al. (1995) and four EcoRI/MseI primer combinations i.e., ECT/MCTG, ETA/MCTC, ETC/MCTA, and ECC/MCCT.
Table 2.
Name and sequence of selected SRAP primer used.
| Primer name | 5′–3′ |
|---|---|
| Forward ME1 | TGAGTCCAAACCGGATA |
| Forward ME2 | TGAGTCCAAACCGGAGC |
| Reverse EM1 | GACTGCGTACGAATTAAT |
| Reverse EM2 | GACTGCGTACGAATTTGC |
| Reverse EM3 | GACTGCGTACGAATTGAC |
| Reverse EM4 | GACTGCGTACGAATTACG |
| Reverse EM5 | GACTGCGTACGAATTACT |
| Reverse EM6 | GACTGCGTACGAATTAGC |
One microliter of the PCR amplified product was mixed with 0.05 μl of the GeneScan 500 LIZ size standard (Applied Biosystems P/N 4322682) and 9 μl of Hi-Di Formamide (Applied Biosystems P/N 4311320). The mixture was denatured for 3 min at 95 °C and loaded on the 36-cm 16-capillary system of the Applied Bio systems 3130xl Genetic Analyzer. Fragment analysis for SRAP and AFLP was performed with GeneMapper Analysis Software v3.7 (ABI) and the data were assembled in binary format (allele presence (1) or (0) for Absence). The threshold for allele calling was set at 200 relative florescence units (rfu), so that any peaks at 200 or higher were assigned a 1 and those that were lower were assigned a 0. Fragment analysis was carried out for allele sizes in the range of 100–500 bp. Markers showing single allele across genotypes were eliminated from the analysis. Data generating from SRAP and AFLP analysis were analyzed using Jaccard similarity coefficient (Jaccard, 1908). Polymorphism information content (PIC) was calculated according to Botstein et al. (1980), discrimination power calculated by dividing the number of polymorphic alleles amplified for each primer by the total number of polymorphic alleles obtained (Khierallah et al., 2011).
Dendrogram was constructed using Jaccard similarity coefficient and the unweighted pair group method with arithmetic average (UPGMA) employing the SAHN (sequential, agglomerative, hierarchical, and nested clustering) from the NTSYSpc (ver.2.10) program (Rohlf, 2005).
3. Result and discussion
3.1. Agro-morphological traits
Analysis of variance revealed that all sources of variation, including genotypes; years and their interactions were significant for all traits studied except for no of pods/plant in year and G × E interaction (Table 3) declaring that performance of faba bean genotypes could be significantly affected by environmental conditions. These results are coinciding with that of Toker (2004) who found significant differences among faba bean genotypes for all the traits. However, the genotype × year interactions was significant for number of pods per plant, days to flowering and maturity. Similarly Toker (2004), revealed significant G × E interactions for number of branches, pods/plant, and biological yield. Also, Flores et al. (1998) found a significant genotype by environment interactions in faba bean and pea grown in various environments.
Table 3.
Mean squares of faba bean characters combined of the two seasons.
| Source of variation | Degree of freedom | No. of days to 50% flowering | No. of days to 95% maturing | Plant height (cm) | No. of branches/plant | No. of pods/plant | No. of seeds/plant | Seed yield/plant (g) |
|---|---|---|---|---|---|---|---|---|
| Year (Y) | 1 | 69.123⁎ | 570.1⁎ | 1322.1⁎ | 122.55⁎⁎ | 677.0 ns | 7069.9⁎ | 3971.5⁎ |
| Error Y (r−1) | 4 | 6.2 | 45.8 | 82.5 | 0.05 | 208.2 | 547.5 | 203.6 |
| Genotype (G) | 39 | 651.7⁎⁎ | 319.9⁎⁎ | 987.7⁎⁎ | 7.09⁎⁎ | 506.2⁎⁎ | 2082.6⁎⁎ | 1000.2⁎⁎ |
| G × Y | 39 | 87.8⁎⁎ | 171.2⁎⁎ | 201.0⁎⁎ | 2.74⁎⁎ | 39.9 ns | 198.3⁎⁎ | 175.9⁎⁎ |
| Error | 156 | 8.1 | 53.6 | 33.0 | 0.49 | 30.6 | 97.5 | 39.5 |
Indicates significance at 0.05 probability.
Indicates significance at 0.01 probability.
Mean combined values of the agro-morphological traits of the forty faba bean genotypes over the two seasons 2010/11 and 2011/12 are presented in Table 4. The results showed a wide range of variation in different agro-morphological traits; days to 50% flowering (33–78 days), days to 95% maturity (112–154 days), plant height (81.4–139.5 cm), and number of branches/plant (3.3–7.9), number of pods/plant (8.8–44.3), No. of seeds/plant (23.3–100.8) and seed yield/plant (14.9–70.8 g). This indicates the existence of a wide range of genetic variability for studied characters, and highlights the potential of genetic improvement using such genetic pool. These results coincided with Musallam et al. (2004) who found significant differences among genotype and for environments (water availability) in most of agro-morphological traits and G × E interaction for seed yield and days to flowering traits.
Table 4.
Mean performance of the forty faba bean genotypes combined over the two seasons.
| Genotype | No. of days to 50% flowering | No. of days to 95% maturing | Plant height (cm) | No. of branches/plant | No. of pods/plant | No. of seeds/Plant | Seed yield/plant (g) |
|---|---|---|---|---|---|---|---|
| WRB 1-3 | 69.0 | 151.8 | 94.0 | 5.9 | 14.0 | 32.0 | 22.7 |
| WBR 2-7 | 57.3 | 143.5 | 105.6 | 5.9 | 21.6 | 55.4 | 41.3 |
| WRB 1-4 | 49.3 | 148.0 | 96.8 | 4.3 | 11.3 | 23.3 | 18.7 |
| WRB 1-5 | 70.8 | 149.5 | 97.9 | 4.9 | 13.0 | 35.0 | 23.7 |
| WRB 2-1 | 63.8 | 147.3 | 103.1 | 5.8 | 17.0 | 34.0 | 24.8 |
| FLIP03-001FB | 53.0 | 147.0 | 104.5 | 7.1 | 33.3 | 58.1 | 29.3 |
| FLIP03-002FB | 59.8 | 144.8 | 98.5 | 7.9 | 27.8 | 62.9 | 45.8 |
| FLIP03-003FB | 58.5 | 150.0 | 106.6 | 5.6 | 30.4 | 56.9 | 42.4 |
| FLIP03-004FB | 72.0 | 154.0 | 95.9 | 4.6 | 8.8 | 28.8 | 20.0 |
| FLIP03-005FB | 53.0 | 142.5 | 96.5 | 6.1 | 18.8 | 44.1 | 32.9 |
| FLIP03-006FB | 65.3 | 147.0 | 100.6 | 6.8 | 15.1 | 37.3 | 28.9 |
| FLIP03-007FB | 56.8 | 150.0 | 88.1 | 6.1 | 11.5 | 25.0 | 14.9 |
| FLIP03-008FB | 52.0 | 141.3 | 102.5 | 6.4 | 21.8 | 44.8 | 36.9 |
| FLIP03-009FB | 55.3 | 149.8 | 91.6 | 4.9 | 16.9 | 36.0 | 21.3 |
| FLIP03-010FB | 62.5 | 150.0 | 100.5 | 5.9 | 26.0 | 46.0 | 40.4 |
| FLIP03-011FB | 78.0 | 151.0 | 101.5 | 6.3 | 35.6 | 82.8 | 47.7 |
| FLIP03-012FB | 58.0 | 143.0 | 94.3 | 6.0 | 23.8 | 57.6 | 30.8 |
| FLIP03-013FB | 58.8 | 147.8 | 99.9 | 6.3 | 30.1 | 56.3 | 43.0 |
| FLIP03-014FB | 42.8 | 148.3 | 97.0 | 5.5 | 40.3 | 93.5 | 70.0 |
| FLIP03-015FB | 62.3 | 146.3 | 85.0 | 6.4 | 24.1 | 48.6 | 33.4 |
| FLIP03-016FB | 55.3 | 141.8 | 95.9 | 6.3 | 15.8 | 29.8 | 22.9 |
| FLIP03-017FB | 65.3 | 152.3 | 91.4 | 5.8 | 21.9 | 50.4 | 33.8 |
| FLIP03-018FB | 45.6 | 112.0 | 100.6 | 6.0 | 26.0 | 62.3 | 37.4 |
| FLIP03-019FB | 43.8 | 145.8 | 99.9 | 6.8 | 44.3 | 79.9 | 41.7 |
| FLIP03-020FB | 68.8 | 150.0 | 108.1 | 6.1 | 33.0 | 72.0 | 34.7 |
| FLIP03-021FB | 61.5 | 143.0 | 111.4 | 5.9 | 17.9 | 43.1 | 21.7 |
| FLIP03-022FB | 48.5 | 140.0 | 96.1 | 7.9 | 41.9 | 66.5 | 42.5 |
| FLIP03-023FB | 50.1 | 142.6 | 96.6 | 7.1 | 25.5 | 48.3 | 28.3 |
| FLIP03-024FB | 64.1 | 151.3 | 105.3 | 6.5 | 29.0 | 66.3 | 32.7 |
| FLIP03-025FB | 59.8 | 139.6 | 110.8 | 7.0 | 23.6 | 54.9 | 31.5 |
| FLIP03-026FB | 57.3 | 139.3 | 109.8 | 6.9 | 33.1 | 60.3 | 31.3 |
| FLIP03-027FB | 56.0 | 144.9 | 105.6 | 5.9 | 19.5 | 43.4 | 25.5 |
| FLIP03-028FB | 52.3 | 145.8 | 81.4 | 6.0 | 36.5 | 61.0 | 34.4 |
| Reina Blanca | 77.3 | 144.7 | 111.2 | 4.8 | 14.7 | 40.3 | 46.2 |
| Population 3 | 35.8 | 137.2 | 131.3 | 3.3 | 13.8 | 40.8 | 35.2 |
| Giza40 | 53.5 | 137.8 | 139.5 | 5.5 | 35.5 | 100.8 | 70.8 |
| Hassawi1 | 37.6 | 141.5 | 125.8 | 4.7 | 21.3 | 53.7 | 39.0 |
| Goff1 | 45.4 | 149.0 | 131.5 | 3.8 | 28.7 | 68.5 | 57.3 |
| Gazira1 | 33.0 | 132.2 | 129.0 | 3.3 | 23.3 | 58.8 | 60.0 |
| Triple White | 50.8 | 134.0 | 116.5 | 3.6 | 37.0 | 91.0 | 47.2 |
| Mean | 56.5 | 144.4 | 104.0 | 5.8 | 24.6 | 53.8 | 36.1 |
| LSD 5% | 3.2 | 8.3 | 6.6 | 0.8 | 6.3 | 11.3 | 7.2 |
The genotypes Gazira1, Population3 and Hassawi1 were the earliest flowering genotypes with 42%, 37% and 33% days shorter than the overall genotype mean (56.5 days). The FLIP03-018FB, Gazira1 and Triple White genotypes had early maturing period with 22.0%, 8.0% and 7.0% days lower than that of the overall genotypes mean (144 days). Those genotypes could be elite donors for earliness in faba bean. The duration of crop maturity is the end result of several phenological and morphological variables, which includes days to flowering, days to maturity, plant height, pod filling period, duration of flowering and others (Kumar et al., 1999). The importance to develop high-yielding, early maturing genotypes adapted to a wider range of latitudes and/or altitudes is urgently needed for faba bean improvement. Therefore, the development of short duration genotypes could expand faba bean cultivation.
Significant differences were detected for plant height among tested genotypes. The top five genotypes exceeded the overall plant height mean (104 cm) by more than 20% were Giza40 (34%), Goff1 (26%), Population3 (26%), Gazira1 (24%) and Hassawi1 (21%). FLIP03-028FB genotype recorded the shortest plants (81.4 cm) with 22% less than the overall genotype mean. Significant differences were also detected among genotypes for branching behavior. The FLIP03-02FB and FLIP03-022 had the highest number of branches/plant (7.9), while, the lowest number was recorded for Population3 and Gazira1 (3.3).
Five genotypes yielded 48–80% more pods/plant than overall genotypes mean. The genotypes were FLIP03-019FB, FLIP03-022FB, and FLIP03-014FB, Triple White and FLIP03-028FB. Number of seeds per plant showed a wide range of variability among genotypes; the Giza40, FLIP03-014FB, Triple White, FLIP03-011FB and FLIP03-019FB produced the highest number of seeds/plant with 50% seeds more than overall genotype mean.
The highest seed producing genotypes were Giza40, FLIP03-014FB, Gazira1 and Goff1 with a 96, 94, 66 and 59% more yields than over all genotype mean. Loss and Siddique (1997) have reported that plant height, number of branches and pods/plant, biological yield, harvest index, 100-seed weight, and number of days to flowering and maturity were the most important characteristics for improving the seed yield of faba bean. Seed yield/plant was significantly and positively correlated with plant height, number of pods and seeds per plant with r = 0.531, 0.63 and 0.81, (p < 0.01) respectively, while negatively correlated with days to flowering and maturity (r = −0.33 and −0.24, p < 0.05), therefore it is possible to select genotypes that complete a substantial proportion of flowering and pod development prior to the onset of terminal drought (Khan et al., 2010).
To understand sources of variance among faba bean genotypes, a principal component analysis (PCA) was carried out and grouped the 7 morphological traits into the first three axes describing 84.3% of the total variations (Table 5). The maximum Eigenvalues were obtained for the first three PCs. The first principle component (PC1) demonstrated 44.37% of the total variation and associated positively with traits of plant height, no of pod/plant, no of seeds/plant, seed yield/plant. Whereas, the second principle component (PC2) accounted for 25.47% of the total variation which related with traits such as days to flowering and maturity, no of branches/plant, no of pod/plant and no of seeds/plant traits. The third principle component revealed 14.47% of the total variation and related with days to flowering and maturity, plant height, and number of seeds/plant and seed yield traits.
Table 5.
Eigen values, individual and cumulative percentage variations and eigen vectors explained by three principal components based on agro-morphological traits in 40 faba bean genotypes.
| F1 | F2 | F3 | |
|---|---|---|---|
| Eigen value | 3.106 | 1.783 | 1.013 |
| Variability (%) | 44.372 | 25.468 | 14.467 |
| Cumulative (%) | 44.372 | 69.84 | 84.307 |
| Eigen vectors for traits | |||
| Days to 50% flowering | −0.332 | 0.313 | 0.46 |
| Days to 95% maturing | −0.287 | 0.252 | 0.662 |
| Plant height | 0.362 | −0.397 | 0.285 |
| Branches/plant | −0.102 | 0.605 | −0.403 |
| Pods/plant | 0.417 | 0.465 | −0.042 |
| Seeds/plant | 0.494 | 0.306 | 0.147 |
| Seed yield | 0.498 | 0.073 | 0.288 |
The plot defined by the PC1 and PC2 distinguished three groups of characters (Fig. 1). The first group was positively correlated to two axes and composed of number of pods/plant, number of seeds/plant and seed yield/plant. Plant height was negatively correlated to axis two (PC2), in contrast, number of branches/plant, days to flowering and days to maturity, represented the third group and was negatively correlated to axis one (PC1). No trait was negatively correlated to two axes. This could help in genotype selection based on PC values for high yielding potential. The results also suggest importance of these traits in development of high yielding varieties. Taken together, results showed a significant amount of genetic variability among the tested genotypes, and suggest their usefulness in breeding programs. Similar results were reported by Thalji and Shalaldeh (2006) Alghamdi (2007), and Fikreselassie and Seboka (2012).
Fig. 1.
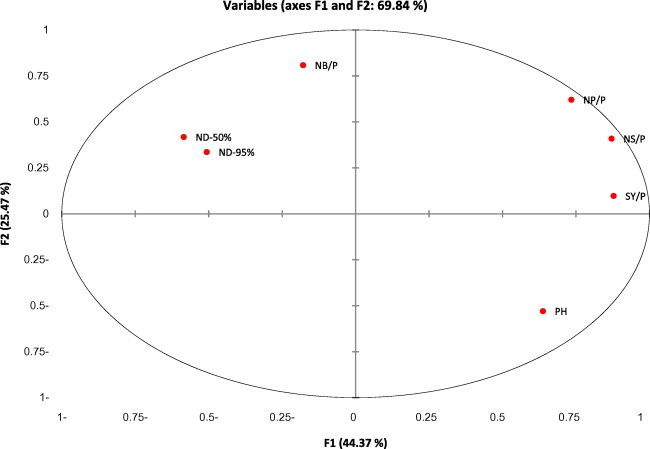
Two-dimensional ordination of 7 agro-morphological traits in faba bean genotypes on principal component axes. NP/P = number of pods/plant, NS/P = number of seeds/plant, SY/P = number of seeds/plant, PH = plant height, NB/P = number of branches/plant, ND-50 = number of days to 50% flowering, ND-95% = number of days to 95% maturity.
3.2. Genetic diversity based on SRAP and AFLP markers
The 6 SRAP and 4 AFLP primer pair combinations were used for generating genetic distance among the tested faba bean genotypes. The SRAP primer combinations produced a total of 183 amplified fragments (alleles) with a mean of 30.5 alleles per primer and had 100% polymorphism. A total of 1022 polymorphic fragments (bands) with an average number of 170 bands for each primer pair combinations across 40 genotypes of faba bean were generated (Table 6). Number of amplified SRAP fragments (alleles) in this study are higher than those obtained in other studies (Ariss and Vandemark, 2007; Esposito et al., 2007; Alghamdi et al., 2012). Primer combination ME2/EM4 produced the lowest number of alleles and total bands which were 9 and 51 while primer combination ME2/EM6 produced the highest numbers which were 53 and 320, respectively. The PIC values measured from all the SRAP primers was high and ranged from 0.863 to 0.967 and primers showed discrimination power ranged from 5% for primer combination ME2/EM4 to 29% for ME2/EM6 primer combination with an average of 17% for all primers combination. High level of diversity was obtained similar to those previously recorded by Alghamdi et al. (2012). The polymorphism rate in this study using SRAP markers (100%) was higher than those obtained in other plant species including 90% in alfalfa (Vandemark et al., 2006), 95.23% in Paeonia (Hao et al., 2008), and 95% in buffalo grass (Budak et al., 2004). The high level of polymorphism rate indicates the genetic divergence among the studied genotypes and makes this marker system ideal for study genetic diversity among closely related genotypes.
Table 6.
Summary of molecular data of SRAP and AFLP primer combinations used for 40 faba bean genotypes analysis.
| Primer combination | Amplified fragments (alleles) | Total polymorphic fragments (bands) | Polymorphism rate (%) | PIC | Discrimination power (DP)% |
|---|---|---|---|---|---|
| SRAP | |||||
| ME1/EM1 | 37 | 188 | 100 | 0.96 | 20 |
| ME1/EM2 | 20 | 127 | 100 | 0.94 | 11 |
| ME2/EM3 | 34 | 141 | 100 | 0.96 | 19 |
| ME2/EM4 | 09 | 51 | 100 | 0.86 | 05 |
| ME2/EM5 | 30 | 195 | 100 | 0.95 | 16 |
| ME2/EM6 | 53 | 320 | 100 | 0.97 | 29 |
| Total | 183 | 1022 | – | – | – |
| Mean | 30.5 | 170 | 100 | 0.94 | 17 |
| AFLP | |||||
| ECT/MCTG | 47 | 546 | 100 | 0.962 | 23 |
| ETA/MCTC | 44 | 319 | 100 | 0.966 | 22 |
| ETC/MCTA | 85 | 706 | 100 | 0.977 | 42 |
| ECC/MCCT | 26 | 187 | 100 | 0.92 | 13 |
| Total | 202 | 1758 | – | – | – |
| Mean | 50.5 | 440 | 100 | 0.96 | 25 |
Genetic similarity matrix among all studied faba bean genotypes was obtained from amplified fragments shown by six SRAP markers using Jaccard coefficients. Genetic similarity among genotypes ranged from 0.0 to 1.0. The highest similarity value was between genotype pairs FLIP03-010 and FLIP03-012 (100%). The UPGMA dendrogram showing genetic relationship using SRAP markers tested among the 40 faba bean genotypes is presented in Fig. 2. At the lowest range of similarity (5%), the tested genotypes were divided into three main groups; A (14 genotypes), B (two genotypes) and C (23 genotypes) and one genotype (FLIP03-028FB) failed to form cluster and individually separated. However, at around 50% similarity level, except WRB2-1, FLIP03-018, FLIP03-004, FLIP03-006, FLIP-03-010 and FLIP03-012, tested genotypes were separated individually and failed to form clusters. Hence, the faba landraces were grouped in sub-cluster, while ICARDA genotypes were further divided to sub-clusters and the UK breeding genotypes were distributed across the ICARDA’s genotypes. Overall, clustering followed the genetic background and origin as well. Our results demonstrated that SRAP markers were significantly useful for genetic diversity assessment in faba bean. These results were in agreement of that Alghamdi et al. (2012) who found SRAP markers grouped the faba bean genotypes according to their geographic origin and type. Where, the landraces grouped according to their origin, while others were grouped according to their seed type.
Fig. 2.
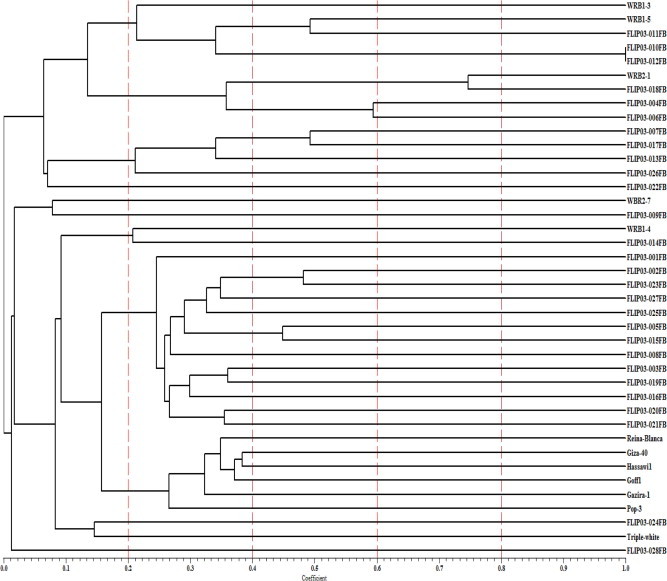
Dendrogram of 40 faba bean genotypes from SRAP markers by Jaccard’s coefficient and the UPGMA clustering method. Similarity values are shown at bottom of dendrogram.
A total of 202 alleles and 1758 fragments were amplified by 4 AFLP primer combinations with average of 50.5 alleles and 439 fragments per primer across 40 genotype of faba bean (Table 6). Primer pair combinations ETC/MCTA produced the highest number of alleles (85) and fragments (706), while the primer combination ECC/MCCT produced the lowest number of both alleles and fragments (26 and 187, respectively). PIC values measured for individual primer combination was high and ranged from 0.920 to 0.977 and primers showed discrimination power ranging from 13% for primer combination ECC/MCCT to 42% for ETC/MCTA primer combination with an average of 25% for all primer combinations. The high PIC values showed that AFLP markers were highly diverse and able to discriminate faba bean genotypes. AFLP revealed higher number of fragments and polymorphism% compared with earlier reports for assessing genetic relationships. Zeid et al. (2003) generated 527 fragments using eight selected primer combinations with an average of 65.8 fragments per primer combination. In our case primer combinations (ECT/MCTG, ETA/MCTC, ETC/MCTA, and ECC/MCCT.) were different than that selected by Zeid et al. (2003) who used (EAAC/MCAC, EACA/MCTA, EACC/MCAC, EACC/MCAG, EACG/MCTT, EAGC/MCTA, EAGG/MCAT, and EAGG/MCTC) primer combinations. Therefore, the number of amplified fragments depends on the genotypes used as well as primer combination. Also, laser based detection system in capillary electrophoresis with extraordinary resolution power than ordinary gel electrophoresis. Genetic similarity among genotypes ranged from 0.06 to 0.68. Highest similarity between genotypes pairs was found in Giza40 and Triple White (68%). UPGMA dendrogram showing genetic relationship using AFLP markers among the 40 faba bean genotypes is presented in Fig. 3. At high hierarchal order, two main clusters were formed, the first cluster compassed accessions introduced from ICARDA including UK breeding program and the second cluster grouped local landraces and adopted cultivars.
Fig. 3.
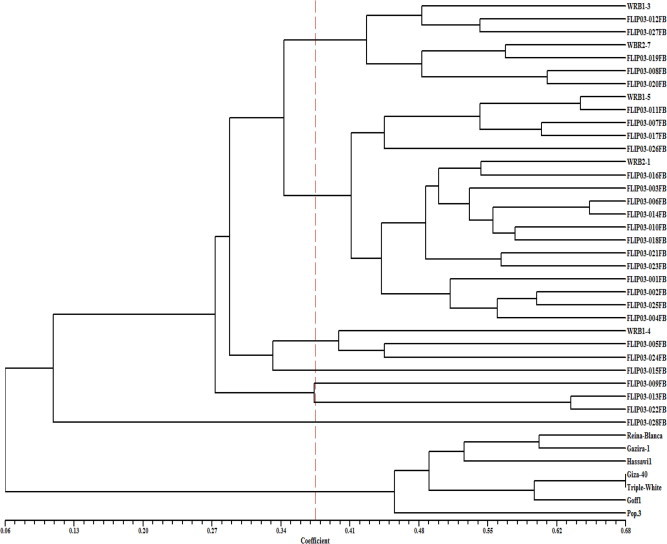
Dendrogram of 40 faba bean genotypes from AFLP markers by Jaccard’s coefficient and the UPGMA clustering method. Similarity values are shown at bottom of dendrogram.
At genetic similarity value (0.37) that represents 50% similarity, the first main cluster was further subdivided to four sub-clusters grouped 32 out of 34 genotypes and the two genotypes (FLIP03-028FB and FLIP03-015FB) were individually separated. Genotypes from UK were distributed throughout the sub-clusters indicating inter as well as intra genetic diversity among these genotypes. Example, WRB1-3 and WRB2-7 were grouped in one sub-cluster, WRB1-5 and WRB2-1 in the second sub-cluster and WRB1-4 in the third sub-cluster. The incoherence of dendrograms generated by SRAP and AFLP markers may partially explained by fact SRAP preferentially amplifies open reading frames (ORFs) or coding regions that result in a number of dominant and co-dominant markers (Li and Quiros, 2001), while AFLP preferentially amplify non-coding regions. Both markers, however, showed considerable genetic diversity among tested genotypes. With both markers local landraces and adapted cultivars were grouped in one cluster separated from those introduced from ICARDA and the genotypes originated from UK.
The UPGMA cluster analysis of the genotypes based on combined SRAP and AFLP data illustrated three main clusters, with only one genotype (FLIP03-028FB) failing to form cluster. The first main cluster comprises the cultivars and Saudi faba bean landraces, however 16 ICARDA breeding genotypes were grouped in the second cluster and the third cluster compassed all UK breeding genotypes with the other 17 ICARDA’s genotypes. The highest similarity value detected was between one of the UK genotypes (WRB1-5) and (FLIP03-011FB) and the lowest similarity value observed was for (FLIP03-028FB) in relation to the other cultivars and was considered the most diverse genotype. All genotypes were separated and formed individual branches at the maximum genetic similarity (0.67). In AFLP and combined analyses, the highest value of genetic diversity was observed between (FLIP03-028FB) and the rest of genotypes and the highest similarity between (WRB1-5) and (FLIP03-011FB). Combined analysis (AFLP and SRAP) markers followed AFLP clustering patterns (Fig. 4), where the local landraces and cultivars were grouped in one cluster and UK breeding genotypes were distributed across ICARD’s sub-clusters regardless to their families, indicating high genetic diversity among tested genotypes at both inter and intra genetic levels. The combined use of SRAP and AFLP markers allows higher level of genomic coverage as SRAP markers are potentially associated with functional loci and AFLP markers amplify non-coding regions. SRAP and AFLP are multi-locus profiling techniques able to distinguish genotypes below the species level and proved to be effective in assessing genetic diversity in faba bean. Result of cluster analysis based on SRAP showed weak and not significant correlation with the agro-morphological data with r = 0.01, p > 0.54 while, it was highly significant based on AFLP analysis with r = 0.26, P < 0.004. Many studies correlated morphological and molecular distances and showed that clustering of genotypes is not conforming (Nevo, 1988; Vojdani and Meybodi, 1993; Semagn, 2002; Ebrahimi et al., 2009; Tahernezhad et al., 2010). However, Taamalli et al. (2006) reported a significant but low correlation between some of morphological and genetic distance matrices obtained with SSR (r = 0.185) and AFLP markers (r = 0.156) on Tunisian olive cultivars. On the other hand a high correlation was found using Mantel’s test in Olea europaea (Dimperio et al., 2011).
Fig. 4.
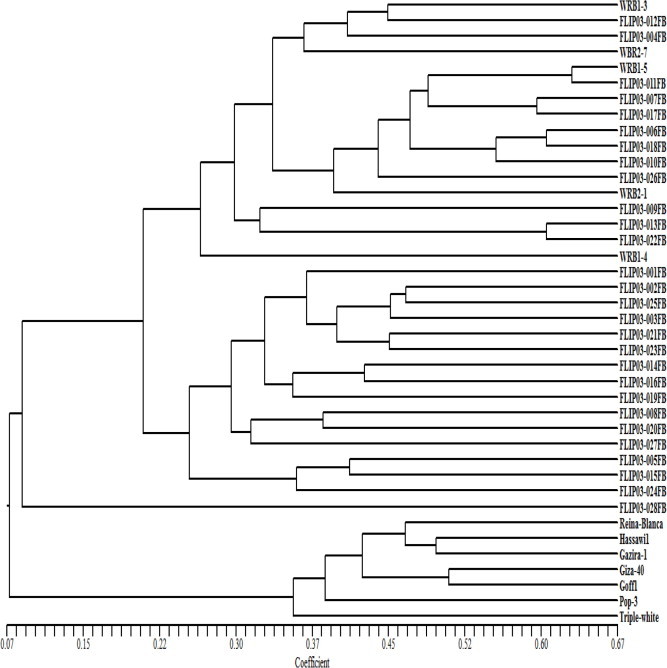
Dendrogram of 40 faba bean genotypes from combined SRAP and AFLP markers by Jaccard’s coefficient and the UPGMA clustering method. Similarity values are shown at bottom of dendrogram.
4. Conclusion
Wide differences among faba bean genotypes were recorded so this will be useful to identify promising genotypes for yield potential and quality to use direct as new variety or introduce in breeding program. The selected genotypes of faba bean demonstrated significant differences and showed superiority in most of the studied traits overall, the highest seed yield genotypes were Giza40, FLIP03-014FB, Gazira1 and Goff1. While the early matured genotypes were FLIP03-018FB, Gazira1 and Triple White. The results suggest the existence of a considerable amount of genetic variability at both agro-morphological and molecular levels. This indicates the potential of such genotypes in faba breeding programs. Although SRAP markers did not show a significant correlation with agromorphological data, combined AFLP and SRAP showed a significant correlation with morphological data. AFLP showed also a significant correlation. SRAP and AFLP markers were significantly useful for genetic diversity assessment at molecular level in faba bean genotypes. They exhibited high discrimination power, and were able to distinguish the faba bean genotypes with high efficiency and accuracy.
Acknowledgement
The authors would like to extend their sincere appreciation to the Deanship of the Scientific Research at King Saud University/Agricultural Researh Center for their financial support.
Footnotes
Peer review under responsibility of King Saud University.
Appendix A. Supplementary data
Monthly average high and low temperature for during the two 2010/2011 and 2011/2012 growing seasons.
References
- Al-Faifi S., Migdadi H., Al-doss A., Ammar M., El-Harty E., Khan M., Javed M., Alghamdi S. Morphological and molecular genetic variability analyses of Saudi lucerne (Medicago sativa L) landraces. Crop Pasture Sci. 2013;64(2):137–146. [Google Scholar]
- Alghamdi S. Genetic behaviour of some selected faba bean genotypes. Afr. Crop Sci. Conf. Proc. 2007;8:709–714. [Google Scholar]
- Alghamdi, S., 2008. Varietal identification and genetic purity assessment of F1 hybrid seeds using RAPD markers in faba bean (Vicia faba L.). In: R.J. Geijskes et al. (Eds.), Proc. VIth IS on In Vitro Cult. and Hort. Breed., Acta Hortic., pp. 269–274.
- Alghamdi S., Al-Faifi S., Migdadi H., Ammar M., Siddique K. Inter-simple sequence repeat (ISSR)-based diversity assessment among faba bean genotypes. Crop Pasture Sci. 2011;62(9):755–760. [Google Scholar]
- Alghamdi S., Al-Faifi S., Migdadi H., Khan M., EL-Harty E., Ammar M. Molecular diversity assessment using sequence related amplified polymorphism (SRAP) markers in Vicia faba L. Int. J. Mol. Sci. 2012;13:16457–16471. doi: 10.3390/ijms131216457. [DOI] [PMC free article] [PubMed] [Google Scholar]
- Ariss J., Vandemark G. Assessment of genetic diversity among nondormant and semidormant alfalfa populations using sequence-related amplified polymorphisms. Crop Sci. 2007;47:2274–2284. [Google Scholar]
- Bebeli P., Kaltsikes P. New developments in varietal identification. In: van Gastel A.J.G., Pagnotta M.A., Porceddu E., editors. Seed Science and Technology. ICARDA; Aleppo, Syria: 1993. pp. 161–172. [Google Scholar]
- Botstein D., White R.L., Skolnick M., Davis R.W. Construction of a genetic linkage map in man using restriction fragment length polymorphisms. Am. J. Hum. Genet. 1980;32:314–331. [PMC free article] [PubMed] [Google Scholar]
- Budak H., Shearman R., Parmaksiz I., Gaussoin R., Riordan T., Dweikat I. Molecular characterization of buffalograss germplasm using sequence-related amplified polymorphism markers. Theor. Appl. Genet. 2004;108:328–334. doi: 10.1007/s00122-003-1428-4. [DOI] [PubMed] [Google Scholar]
- Castonguay Y., Cloutier J., Bertrand A., Michaud R., Laberge S. SRAP polymorphisms associated with superior freezing tolerance in alfalfa (Medicago sativa spp. sativa) Theor. Appl. Genet. 2010;120:1611–1619. doi: 10.1007/s00122-010-1280-2. [DOI] [PubMed] [Google Scholar]
- Cerning J., Saposnik A., Guilbot A. Carbohydrate composition of horse beans (Vicia faba) of different origins. Cereal Chem. 1975;52:125–138. [Google Scholar]
- Crepona K., Marget P., Peyronnet C., Carrouéea B., Arese P., Duc G. Nutritional value of faba bean (Vicia faba L.) seeds for feed and food. Field Crop Res. 2010;115:329–339. [Google Scholar]
- DImperio M., Viscosi V., Scarano M., D’Andrea M., Zullo B.A., Pilla F. Integration between molecular and morphological markers for the exploitation of olive germoplasm (Olea europaea) Sci. Hort. 2011;130:229–240. [Google Scholar]
- Ebrahimi R., Zamani Z., Kashi A. Genetic diversity evaluation of wild Persian shallot (Allium hirtifolium Boiss.) using morphological and RAPD markers. Sci. Hort. 2009;119:345–351. [Google Scholar]
- Esposito M., Martin E., Craverom V., Cointry E. Characterization of pea accessions by SRAP’s markers. Sci. Hort. 2007;113:329–335. [Google Scholar]
- FAOSTAT, Food and Agriculture Organization, 2012. Website: <http://faostat.fao.org>.
- Fikreselassie M., Seboka H. Genetic variability on seed yield and related traits of elite faba bean (Vicia faba L.) genotypes. Pak. J. Biol. Sci. 2012;15(8):380–385. doi: 10.3923/pjbs.2012.380.385. [DOI] [PubMed] [Google Scholar]
- Flores F., Moreno M.T., Cubero J.J. A comparison of univariate and multivariate methods to analyze G × E interaction. Field Crops Res. 1998;56:271–286. [Google Scholar]
- Gong Y., Xu S., Mao W., Hu Q., Zhang G., Ding J., Li Z. Generation and characterization of 11 novel EST derived microsatellites from Vicia faba (Fabaceae) Am. J. Bot. 2010;97:e69–e71. doi: 10.3732/ajb.1000166. [DOI] [PubMed] [Google Scholar]
- Gong Y., Xu S., Mao W., Li Z., Hu Q., Zhang G., Ding J. Genetic diversity analysis of faba bean (Vicia faba L.) based on EST-SSR markers. Agric. Sci. China. 2011;10(6):838–884. [Google Scholar]
- Hao Q., Liu Z., Shu Q., Zhang R., Derick J., Wang L. Studies on Paeonia cultivars and hybrids identification based on SRAP analysis. Hereditas. 2008;145:38–47. doi: 10.1111/j.0018-0661.2008.2013.x. [DOI] [PubMed] [Google Scholar]
- Jaccard P. Nouvelles recherches sur la distribution florale. Bull. Soc. Vaud. Sci. Nat. 1908;44:223–270. [Google Scholar]
- Kaur S., Pembleton L., Cogan N., Savin K., Leonforte T., Paull J., Materne M., Forster J. Transcriptome sequencing of field pea and faba bean for discovery and validation of SSR genetic markers. BMC Genome. 2012;13:104–115. doi: 10.1186/1471-2164-13-104. [DOI] [PMC free article] [PubMed] [Google Scholar]
- Khan H.R., Paull J.G., Siddique K.H.M., Stoddard F.L. Faba bean breeding for drought-affected environments: a physiological and agronomic perspective. Field Crop Res. 2010;115:279–286. [Google Scholar]
- Khierallah H.S.M., Bader S.M., Baum M., Hamwieh A. Assessment of genetic diversity of some Iraqi date palms (Phoenix dactylifera L.) using AFLP markers. Afr. J. Biotech. 2011;10:9570–9575. [Google Scholar]
- Kumar S., Van Rheenen H.A., Singh O. Genetic analysis of different components of crop duration in chickpea. J. Genet. Breed. 1999;53:189–200. [Google Scholar]
- Li G., Quiros C. Sequence-related amplified polymorphism (SRAP), a new marker system based on a simple PCR reaction, its application to mapping and gene tagging in Brassica. Theor. Appl. Genet. 2001;103:455–461. [Google Scholar]
- Link W., Dixkens C., Singh M., Schwall M., Melchinger A. Genetic diversity in European and Mediterranean faba bean germplasm revealed by RAPD markers. Theor. Appl. Genet. 1995;90:27–32. doi: 10.1007/BF00220992. [DOI] [PubMed] [Google Scholar]
- Loss S., Siddique K. Adaptation of faba bean (Vicia faba L) to dry land Mediterranean-type environments. 1. Seed yield and yield components. Field Crop Res. 1997;52:17–28. [Google Scholar]
- Ma Y., Yang T., Guan J., Wang S., Wang H., Sun X., Zong X. Development and characterization of 21 EST-derived microsatellite markers in Vicia faba (fava bean) Am. J. Bot. 2011;98:e22–e24. doi: 10.3732/ajb.1000407. [DOI] [PubMed] [Google Scholar]
- Musallam I., Al-Karaki G., Ereifej K., Al-Tawaha A.R. Yield and yield components of faba bean genotypes under rainfed and irrigation conditions. Asian J. Plant Sci. 2004;3:439–448. [Google Scholar]
- Nevo, E., 1988. Genetic resources of wild emmer wheat revisited: genetic evolution conservation and utilization. In: Miller, T.E., Kobner, R.M.D. (Eds.), Proc 7th International Wheat Genetics Symposium, Cambridge, UK, pp. 121–126.
- Oomah B., Tiger N., Olson M., Balasubramanian P. Phenolics and antioxidatives activities in narrow-leafed lupins (Lupinus angustifolius L.) Plant Food Hum. Nutr. 2006;61:91–97. doi: 10.1007/s11130-006-0021-9. [DOI] [PubMed] [Google Scholar]
- Picard, J., 1977. Some results dealing with breeding protein content in Vicia faba L. Protein quality from leguminous crops; EVR 5686 EN, Commission of European Communities, Coordination of Agricultural Research, pp. 339.
- Pozarkova D., Koblizkova A., Roman B., Torres A., Lucretti S., Lysak M., Dolezel J., Macas J. Development and characterization of microsatellite markers from chromosome 1-specific DNA libraries of Vicia faba. Biol. Plantarum. 2002;45:337–345. [Google Scholar]
- Rana, M., Singh S., Bhat, K., 2009. Fingerprinting Indian lentil (Lens culinaris ssp. culinaris Medik.) cultivars and landraces for diversity analysis using sequence-related amplified polymorphism (SRAP) markers. In: Kharkwal, M.C. (Eds.), Proceedings of Fourth International Food and Legumes Research Conference, New Delhi, pp. 617–624.
- Rohlf F. Exeter Publishing Ltd.; New York: 2005. Ntsys-pc, Numerical taxonomy and multivariate analysis system, version 2.2. [Google Scholar]
- Semagn K. Genetic relationships among ten endod types as revealed by a combination of morphological, RAPD and AFLP markers. Heredity. 2002;137:149–156. doi: 10.1034/j.1601-5223.2002.01600.x. [DOI] [PubMed] [Google Scholar]
- Steel R.G.D., Torrie J.H. McGraw Hill Book Co., Inc.; New York: 1980. Principles and procedures of statistics. 481pp. [Google Scholar]
- Taamalli W., Geuna F., Banfi R., Bassi D., Daoud D., Zarrouk M. Agronomic and molecular analyses for the characterisation of accessions in Tunisian olive germplasm collections. Electron. J. Biotechnol. 2006;9(5):467–481. [Google Scholar]
- Tahernezhad Z., Zamani M.J., Solouki M., Zahravi M., Imamjomeh A.A., Jafaraghaei M., Bihamta M.R. Genetic diversity of Iranian Aegilops tauschii coss. using microsatellite molecular markers and morphological traits. Mol. Biol. Rep. 2010;37:3413–3420. doi: 10.1007/s11033-009-9931-6. [DOI] [PubMed] [Google Scholar]
- Terzopoulos P., Bebeli P. Genetic diversity analysis of Mediterranean faba bean (Vicia faba L.) with ISSR markers. Field Crops Res. 2008;108(1):39–44. [Google Scholar]
- Thalji T., Shalaldeh G. Effect of planting date on faba bean (Vicia faba L.) nodulation and performance under semiarid conditions. World J. Agric. Sci. 2006;2(4):477–482. [Google Scholar]
- Toker C. Estimates of broad-sense heritability for seed yield and yield criteria in faba bean (Vicia faba L.) Hereditas. 2004;140:222–225. doi: 10.1111/j.1601-5223.2004.01780.x. [DOI] [PubMed] [Google Scholar]
- Vandemark G., Ariss J., Bauchan G., Larsen R., Hughes T. Estimating genetic relationships among historical sources of alfalfa germplasm and selected cultivars with sequence related amplified polymorphisms. Euphytica. 2006;152:9–16. [Google Scholar]
- Vojdani P., Meybodi M. Distribution and genetic diversity of primitive bread wheat in Iran. In: Damanina A.B., editor. Biodiversity and wheat improvement. Wiley; Chichester, UK: 1993. pp. 409–415. [Google Scholar]
- Vos P., Hoger R., Bleeker M., Reijans M., Lee T., Hornes M., Friters A., Pot J., Paleman J., Kuiper M., Zabeau M. AFLP: a new technique for DNA fingerprinting. Nucleic Acids Res. 1995;23:4407–4414. doi: 10.1093/nar/23.21.4407. [DOI] [PMC free article] [PubMed] [Google Scholar]
- Yang T., Bao S., Ford R., Jia T., Guan J., He Y., Sun X., Jiang Hao J., Zhang X., Zong X. High-throughput novel microsatellite marker of faba bean via next generation sequencing. BMC Genomics. 2012;13:602–613. doi: 10.1186/1471-2164-13-602. [DOI] [PMC free article] [PubMed] [Google Scholar]
- Yassine Y., Hannachib H., Ferchichia Ali. Genetic diversity of Vicia faba L based on random amplified polymorphic DNA and simple sequence repeat markers. Acta Bot. Gallica Bot. Lett. 2014;161(2):151–158. [Google Scholar]
- Zeid M., Schon C., Link W. Genetic diversity in recent elite faba bean lines using AFLP markers. Theor. Appl. Genet. 2003;107:1304–1314. doi: 10.1007/s00122-003-1350-9. [DOI] [PubMed] [Google Scholar]
- Zong X., Ren J., Guan J., Wang S., Liu Q., Paull J.G., Redden R. Molecular variation among Chinese and global germplasm in spring faba bean areas. Plant Breed. 2010;129:508–513. [Google Scholar]
Associated Data
This section collects any data citations, data availability statements, or supplementary materials included in this article.
Supplementary Materials
Monthly average high and low temperature for during the two 2010/2011 and 2011/2012 growing seasons.