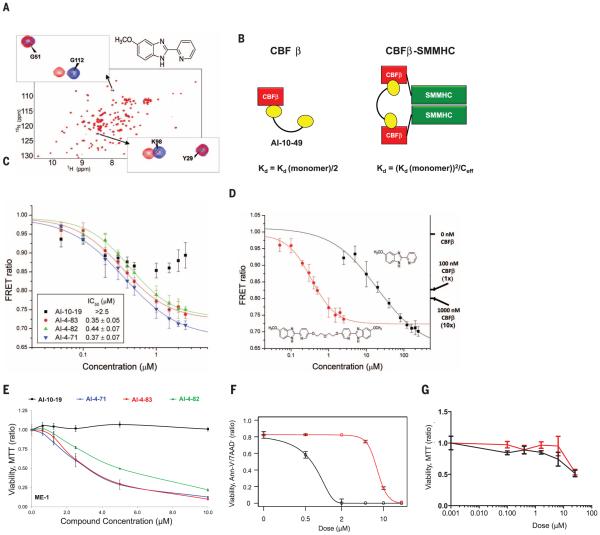
Fig. 1. Development of potent selective inhibitor of CBFβ-SMMHC-RUNX binding.
(A) 15N-1H HSQC spectrum (peaks correspond to all NH moieties of protein) of CBFβ alone (blue) and CBFβ + AI-4-57 (red). (B) Schematic diagram for the application of polyvalency to develop a specific and potent inhibitor of CBFβ-SMMHC-RUNX binding. Equations refer to predicted KD values for a bivalent inhibitor binding to CBFβ and CBFβ-SMMHC. Ceff is the effective local concentration, which depends on the distance between CBFβ domains in the oligomeric CBFβ-SMMHC. (C) FRET assay measurements for bivalent inhibitors with varying linker lengths with 10 nM Cerulean-Runt domain and 10 nM Venus-CBFβ-SMMHC.The y axis is the ratio of emission intensities at 525 and 474 nm. Three independent measurements were performed, and their average and standard deviation were used for IC50 data fitting. (D) FRETassay measurements of inhibition of CBFβ-SMMHC- RUNX binding for AI-4-57 and AI-4-83 with 10 nM Cerulean-Runt domain and 10 nM Venus-CBFβ-SMMHC. Data for AI-4-83 are the same as presented in (C). Data for these two compounds are presented separately for clarity of comparison to one another. Left y axis is the ratio of emission intensities at 525 and 474 nm. Right y axis indicates the FRET ratios observed with addition of 100 nM and 1000 nM untagged CBFβ, corresponding to roughly 1-fold and 10-fold dissociation of CBFβ-SMMHC and Runt domain [CBFβ-SMMHC binds with 7-fold the affinity of CBFβ (8)]. Three independent measurements were performed, and their average and standard deviation were used for IC50 data fitting. (E) Dose-dependent effect of a 24-hour treatment of ME-1 cells with bivalent inhibitors with varying linker lengths measured by MTT assay and normalized to the DMSO-treated group. Each symbol represents the mean of triplicate experiments; error bars represent the SD. (F and G) Dose-dependent effect of AI-10-47 (red) and AI-10-49 (black) treatment for 48 hours; (F) ME-1 cells were assessed by annexin V and 7-amino-actinomycin (7AAD) viability staining, and (G) human bone marrow cells were assessed by MTT assay. The data were normalized to the DMSOtreated group. Each data point represents the mean of triplicate experiments; error bars represent the SD.

