

Abstract
Aims
Osteopontin (OPN) plays an important role in many physiological and pathological processes (wound healing, inflammation, immune response, and tumorigenesis). This meta-analysis assessed the diagnostic value of osteopontin in ovarian cancer.
Methods and Results
Searches in Embase and PubMed were conducted, in order to identify eligible studies on osteopontin expression and its diagnostic value in ovarian cancer. The revised Quality Assessment for Studies of Diagnostic Accuracy (QUADAS-2) tool was applied to examine the quality of these studies and the overall osteopontin diagnostic accuracy in ovarian cancer was pooled using the bivariate model. The publication bias was assessed using funnel plots and Deek’s test. This search methodology resulted in 13 studies with a total of 839 ovarian cancer patients and 1439 controls in this meta-analysis. The overall osteopontin diagnostic sensitivity and specificity of ovarian cancer were 0.66 (95% CI, 0.51–0.78) and 0.88 (95% CI, 0.78–0.93), respectively. The area under summary receiver operating characteristic (sROC) curves (AUC) was 0.85 (95%CI, 0.81–0.88). There was no significant publication bias observed across the eligible studies. However, a major design deficiency of the eligible studies is the issue of subject selection bias.
Conclusions
Osteopontin could be a useful biomarker in diagnosis of ovarian cancer. Due to the design deficits of the eligible studies, a future study with a larger sample size and better design is needed to rigorously confirm the diagnostic potential of osteopontin in ovarian cancer.
Introduction
Ovarian cancer is a significant worldwide health problem in women [1–3], and globally accounted for more than 220,000 incident cases and approximately 160,000 cancer-related deaths in 2010 [4, 5]. Ovarian cancer is usually diagnosed at the advanced stages of disease and contributes to high mortality and a poor 5-year survival rate. Nevertheless, the 5-year survival rate in early ovarian cancer patients can reach up to 70–90% versus 17–36% in advanced ovarian cancer patients [6]. Therefore, timely and accurate diagnosis is critically important in improving survival of ovarian cancer patients. To date, histopathology examination is considered the gold standard in diagnosis of ovarian cancer, but the invasive nature in obtaining ovarian tissue has limited its application in early diagnosis of ovarian cancer because most ovarian cancer patients often have no visible symptoms. Thus, identfcation and evaluation of serum biomarkers could help the early diagnosis of this now lethal cancer. In this regard, transvaginal ultrasonography and serum levels of cancer antigen 125 (CA125) are the main tools to detect ovarian cancer early [7]. The former method requires a specific device and its diagnostic accuracy is largely affected by examiner experience. CA125, a member of the mucin glycoprotein family [8], is frequently used to detect ovarian cancer and approximately 90% of women with advanced ovarian cancer have elevated serum CA125 levels, while its diagnostic sensitivity and specificity are approximately 0.80 and 0.75, respectively [9]. Therefore, further studies of biomarkers for detection of ovarian cancer is promptly needed.
Osteopontin (OPN) is a secreted extracellular matrix glycoprotein and involved in a number of cellular processes, including wound healing, inflammation, the immune response, and tumorigenesis [10, 11]. In ovarian cancer, OPN is usually overexpressed, although it may also be overexpressed in other types of human cancer. Specifically, increase in serum OPN levels is often used to assess diagnosis and prognosis of various human cancers, such as malignant pleural mesothelioma [12], hepatocellular carcinoma [13] and breast cancer [14]. In diagnosis of ovarian cancer, OPN has been intensively studied; for example, two recent published meta-analyses [15, 16] showed that serum OPN levels were generally elevated in ovarian neoplasm patients, indicating that OPN is a potential diagnostic marker for ovarian cancer. However, the diagnostic characteristics such as sensitivity and specificity remain to be defined. Therefore, we performed a meta-analysis to ascertain: i) whether OPN is a useful tumor biomarker in ovarian cancer when used alone; ii) whether OPN can improve the accuracy of CA125 in diagnosis of ovarian cancer; and iii) whether and how future studies are needed to verify the diagnostic value of osteopontin for ovarian cancer.
Materials and Methods
Literature search
This meta-analysis was conducted and reported in accordance with the PRISMA guidelines for systematic reviews and meta-analyses (S1 PRISMA Checklist) [17]. Two investigators (ZD Hu and TT Wei) independently searched different databases, including PubMed and Embase to identify eligible studies that were published up to September 24, 2014. The search terms used for Pubmed were: “(osteopontin or OPN or SPP1 or secreted phosphoprotein) and ovarian”. A similar search strategy was used for Embase. Manual searches were also conducted by reviewing the references of the eligible studies on this topic. The titles and abstracts of the retrieved studies were independently reviewed to identify potentially eligible studies. If necessary, full-text of each publication was reviewed and any disagreement in selection of a study was resolved by full-text review.
Inclusion and exclusion criteria
The inclusion criteria of the current systematic review and meta-analysis were: i) studies that evaluated the diagnostic accuracy of serum or plasma OPN in diagnosis of ovarian cancer; ii) sample size of ovarian cancer and non-ovarian cancer patients was more than 10, knowing that very small sample size studies may be vulnerable to selection bias; and iii) 2 x 2 tables could be constructed from the sensitivity and specificity reported or could be obtained from the receiver operating characteristic (ROC) curve. The exclusion criteria were applied to i) animal studies; ii) non-English publications; and iii) conference abstracts or letters to editors because they usually present limited data for analysis. For duplicate reports, only the study with more detailed information was included.
Data extraction and quality assessment
The sample size, publication year, country origin of subjects, ovarian cancer and non-ovarian cancer patients, OPN test methods, reference, area under ROC curve (AUC), and threshold were extracted independently by two investigators (ZD Hu and TT Wei). A third investigator could intervene to resolve any discrepancies when the aforementioned reviewers disagreed. The true positive (TP), false-positive (FP), false-negative (FN), and true negative (TN) rates were calculated according to the sample size of ovarian cancer and non-ovarian cancer patients and the sensitivity and specificity reported using the following formulas: TP = number of ovarian cancer patients × sensitivity; FN = number of ovarian cancer patients × (1−sensitivity); TN = number of non-ovarian cancer patients × specificity; FP = number of non-ovarian cancer patients × (1−specificity). For studies that did not report sensitivity and specificity but displayed the ROC curve, we chose the point nearest to the upper left corner on the ROC curve as the optimal threshold, and the corresponding sensitivity and specificity were used for data extraction.
The quality of eligible studies was independently assessed using the revised Quality Assessment for Studies of Diagnostic Accuracy tool (QUADAS-2) [18]. The items or domains in QUADAS-2 were labeled as unknown if the corresponding design characteristics were not reported. Any disagreement in quality assessment was resolved by consensus.
Statistical analyses
The overall OPN sensitivity and specificity in diagnosis of ovarian cancer were pooled using the bivariate model [19]. The bivariate model uses pairs of sensitivity and specificity as the starting point of the analysis and thus may be more reliable for estimating the diagnostic accuracy of index test in the meta-analysis, compared with the traditional summary receiver operating characteristic (sROC) approach that uses the diagnostic odds ratio (DOR) as the main outcome measure. The latter approach ignores the trade-off between sensitivity and specificity [19]. In addition, since the bivariate model uses a random effect approach for both specificity and sensitivity, the heterogeneity beyond chance could be regarded as a result of clinical and methodological differences among studies. The pooled positive and negative likelihood ratio was calculated according to the summary estimates of sensitivity and specificity. The funnel plots and the Deeks’s test were applied to assess the potential publication bias [20]. Univariate regression analysis was performed to explore the possible sources of heterogeneity across eligible studies. All analyses were performed using STATA 12.0 (Stata Corp LP, College Station, TX) and the midas command was used for all statistical analyses [21].
Results
Identification of eligible studies
A flowchart depicting the study selection is shown in Fig 1. In this study, we found 13 studies eligible for meta-analysis [22–34] and the data are shown in Table 1. Among them, the sample size was arranged between 39 and 518, with a total sample size of 2278 (839 ovarian cancer patients and 1439 controls). Five studies explored the diagnostic accuracy of plasma OPN for ovarian cancer [22, 24, 28, 32, 34], while the remaining eight studies explored the diagnostic accuracy of serum OPN for ovarian cancer [23, 25–27, 29–31, 33]. The OPN test technique used was an ELISA, but the test kits were from different sources, such as IBL [22, 24, 26, 32] or R&D [25, 33], Milliplex MAP [30, 31], Multiplex PLA [28], and Beadlyte [27, 29], while one study did not detail the source [34]. For data collection, only one study reported that they were prospective [26] and another study reported that they were retrospective [27]. Most studies did not report how they collected data.
Fig 1. Flowchart of the systematic literature search and study selection process.
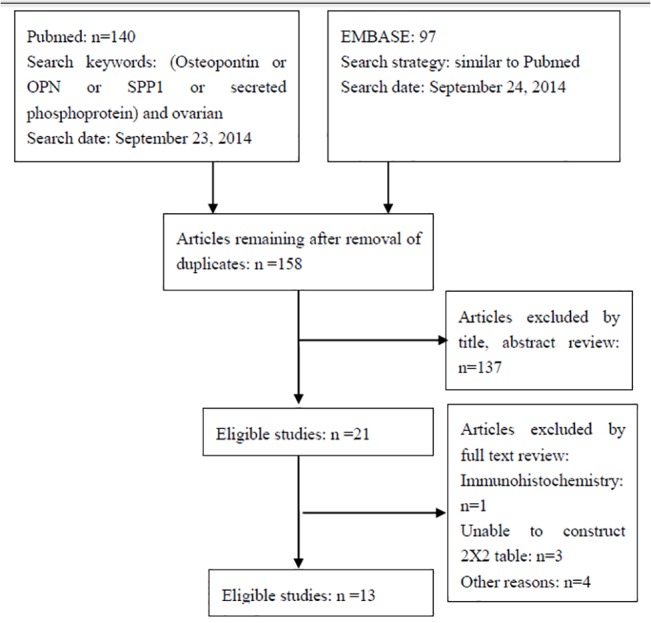
Table 1. Summary of these 13 eligible studies.
| Author | Year | Country | No | OC/non-OC | FIGO grades | Reference | Matrix | Test method | Data collection |
|---|---|---|---|---|---|---|---|---|---|
| Kim [22] | 2002 | USA | 251 | 51/200 | NR | NR | Plasma | IBL | Unknown |
| Mor [23] | 2005 | USA | 206 | 100/106 | NR | NR | Serum | Assay Designs | Unknown |
| Nakae [24] | 2006 | Japan | 127 | 32/95 | NR | Pathology | Plasma | IBL | Unknown |
| Meinhold-Heerlein [25] | 2007 | Germany | 149 | 67/67 | 7/2/49/9 | NR | Serum | R&D | Unknown |
| Moore [26] | 2008 | USA | 233 | 67/166 | 13/2/46/6 | Pathology | Serum | IBL | Prospective |
| Visintin [27] | 2008 | USA | 518 | 156/362 | 13/23/74/46 | Clinical, surgical, histologic and pathologic | Serum | Beadlyte | Retrospective |
| Fredriksson [28] | 2008 | USA | 39 | 19/20 | 4/0/10/5 | NR | Plasma | Multiplex PLA | Unknown |
| Vrzalova [29] | 2009 | Czech | 39 | 19/20 | NR | NR | Serum | Beadlyte | Unknown |
| Lu [30] | 2011 | USA | 304 | 151/153 | 11/6/98/35 | NR | Serum | Milliplex MAP | Unknown |
| He [31] | 2012 | Canada | 52 | 37/15 | NR | Pathology | Serum | Milliplex MAP | Unknown |
| Bandiera [32] | 2013 | Italy | 180 | 60/120 | NR | NR | Plasma | IBL | Unknown |
| Moszynski [33] | 2013 | Poland | 114 | 32/82 | NR | Histopathological examination | Serum | R&D | Unknown |
| Milivojevic [34] | 2013 | Serbia | 79 | 48/31 | 12/6/23/7 | Histopathological examination | Plasma | NR | Unknown |
NR: not reported. IBL: Immuno-Biological Laboratories. OC: ovarian cancer. FIGO, International Federation of Gynecology and Obstetrics.
Diagnostic value of OPN in ovarian cancer assessed in individual studies
Table 2 showed the diagnostic performance of OPN in these eligible studies. Specifically, the AUC of the OPN levels were noted between 0.65 and 0.92 and the optimal threshold was noted between 2.91 ng/ml and 650 ng/ml. Moreover, the sensitivity was noted between 0.17 and 0.88, while the specificity arranged was recorded 0.54 and 1.00. Only one study clarified statistically that OPN and CA125 had comparable AUC under ROC curve, indicating that they had comparable diagnostic accuracy [33]. In addition, by using the net reclassification improvement (NRI) analysis [35], the data demonstrated that OPN could significantly improve the diagnostic accuracy of CA125 for ovarian cancer [33].
Table 2. Diagnostic value of OPN in individual studies of these 13 eligible publications.
| Studies | AUCs (95%CI) | Thresholds | Sensitivity | Specificity | TP | FP | FN | TN |
|---|---|---|---|---|---|---|---|---|
| Kim [22] | NR | 252 ng/ml | Early stage: 0.80 | 0.80 | 43 | 40 | 8 | 162 |
| Late stage: 0.85 | ||||||||
| Mor [23] | NR | NR | 0.80 | 0.76 | 80 | 25 | 20 | 81 |
| Nakae [24] | NR | 489 ng/ml | 0.81 | 0.55 | 26 | 43 | 6 | 52 |
| Meinhold-Heerlein [25] | NR | NR | 0.88 | 1.00 | 59 | 0 | 8 | 67 |
| Moore [26] | 0.65(0.57–0.72) | NR | 0.20 | 0.90 | 13 | 17 | 54 | 149 |
| Visintin [27] | 0.79(0.72–0.87) | NR | 0.73 | 0.70 | 114 | 107 | 42 | 255 |
| Fredriksson [28] | NR | NR | 0.58 | 0.85 | 11 | 3 | 8 | 17 |
| Vrzalova [29] | 0.804 | 2.91 ng/ml | 0.47 | 0.95 | 9 | 1 | 10 | 19 |
| Lu [30] | NR | NR | 0.17 | 0.99 | 26 | 1 | 125 | 152 |
| He [31] | 0.68 | NR | 0.65 | 0.66 | 24 | 5 | 13 | 10 |
| Bandiera [32] | 0.92(0.87–0.97) | NR | 0.81 | 0.81 | 49 | 23 | 11 | 97 |
| Moszynski [33] | 0.83(0.75–0.90) | 28.0 ng/ml | 0.72 | 0.89 | 23 | 9 | 9 | 73 |
| Milivojevic [34] | 0.84(0.75–0.93) | 650 ng/ml | 0.63 | 0.90 | 30 | 3 | 18 | 28 |
NR, not reported;—, no data available; TP, true positive rate; FP, false-positive rate; FN, false-negative rate; TN, true negative rate.
Quality assessment of these eligible studies
Table 3 lists the quality assessment of these 13 eligible studies. Specifically, the patient selection augmented the risk of bias and applicability concerns [22–25, 27, 28, 30] in seven studies due to the case-control study design. The index test domain in six studies [23, 27, 28, 30, 31, 33] was labeled as high because the diagnostic threshold was not pre-specified. The index domain in one study was labeled as unknown since there was no report of how the threshold had been chosen [25]. The follow-up and timing domain in four studies was labeled as high because of partial verification [24, 27, 28, 30].
Table 3. Quality assessment of these 13 eligible studies using QUADAS-2.
| Study | Risk of bias | Applicability concerns | |||||
|---|---|---|---|---|---|---|---|
| Patient selection | Index test | Reference standard | Flow and timing | Patient selection | Index test | Reference standard | |
| Kim [22] | High | Low | Unknown | Unknown | High | Low | Unknown |
| Mor [23] | High | High | Unknown | Unknown | High | Low | Unknown |
| Nakae [24] | High | Low | Low | High | High | Low | Unknown |
| Meinhold-Heerlein [25] | High | Unknown | Unknown | Unknown | High | Low | Unknown |
| Moore [26] | Low | Low | Low | Low | Low | Low | Low |
| Visintin [27] | High | High | Low | High | High | Low | Low |
| Fredriksson [28] | High | High | Unknown | High | High | Low | Unknown |
| Vrzalova [29] | Unknown | Low | Unknown | Unknown | Unknown | Low | Unknown |
| Lu [30] | High | High | Unknown | High | High | Low | Unknown |
| He [31] | Unknown | High | Low | Unknown | Low | Low | Low |
| Bandiera [32] | Unknown | Low | Unknown | Unknown | Low | Low | Unknown |
| Moszynski [33] | Low | High | Low | Low | Low | Low | Low |
| Milivojevic [34] | Unknown | Low | Low | Unknown | Low | Low | Low |
Overall diagnostic value of OPN for ovarian cancer
Fig 2 shows the forest plot of diagnostic sensitivity and specificity of OPN for ovarian cancer patients. The overall diagnostic sensitivity and specificity of OPN were 0.66 (95% CI: 0.51–0.78) and 0.88 (95% CI: 0.78–0.93), respectively. In addition, the pooled PLR, NLR, diagnostic score and DOR were 5.30 (95% CI, 3.05–9.19), 0.39 (95%CI, 0.27–0.57), 2.60 (95%CI, 1.91–3.30) and 13.49 (95% CI, 6.75–26.97), respectively. Moreover, there was significant heterogeneity between the included studies, and the I2 for sensitivity and specificity was 95.30 (95%CI: 93.72–96.88) and 92.60 (95%CI: 89.74–95.46), respectively (Fig 2). Threshold effect analysis showed that there was only 26% of heterogeneity, which was likely to be due to a trade-off between sensitivity and specificity. AUC for OPN and ovarian cancer was 0.85 (95%CI, 0.81–0.88; Fig 3). Taken together, these results indicate that OPN is a useful biomarker in diagnosis of ovarian cancer.
Fig 2. Sensitivity and specificity of OPN in diagnosis of ovarian cancer assessed by Forest plots.

Fig 3. The summary receiver operating characteristic (sROC) curves (AUC) of OPN in diagnosis of ovarian cancer.

The overall diagnostic efficiency is summarized by the regression curve.
Univariate regression and subgroup analysis
Given the significant heterogeneity across these 13 eligible studies and only 26% of heterogeneity likely due to threshold effect, we performed a subgroup analysis and univariate meta-regression to explore the source of heterogeneity. Our hypothesis was that the test matrices (plasma or serum), test methods (IBL, R & D, MAP and Beadlyte) and country origin of the subjects (European or American) were the possible sources of heterogeneity; thus, a subgroup analysis was performed accordingly. As shown in Fig 4, plasma as the detection matrix and the IBL assay were used to determine OPN as the source of heterogeneity for specificity (p < 0.05 for both).
Fig 4. Subgroup analysis of OPN sensitivity and specificity in diagnosis of ovarian cancer.

The threshold effect was not considered in the subgroup analysis, meaning that the effect of each covariate on specificity was estimated separately from that on sensitivity, and vice versa. Therefore, we performed a univariate meta-regression analysis to explore the possible sources of heterogeneity. The results showed that only Europe (I2 = 67%, p = 0.05) and R&D OPN kit (I2 = 75%, p = 0.02) were the sources of heterogeneity across these eligible studies.
Publication bias
The Deek’s test showed that publication bias was not statistically significant (p = 0.820). The funnel plots for publication bias were also symmetrical (Fig 5), indicating that publication bias was not significant.
Fig 5. The Funnel plot assessment of potential publication bias.

Each solid rectangle represents an eligible study.
Discussion
In the current study, we performed a meta-analysis of OPN level in diagnosis of ovarian cancer. The first question we intended to address was whether single OPN is a useful biomarker in diagnosis of ovarian cancer. We found that the overall sensitivity and specificity of OPN in diagnosis of ovarian cancer were 0.66 (95% CI, 0.51–0.78) and 0.88 (95% CI, 0.78–0.93), respectively. The AUC under sROC curve was 0.85 (95%CI, 0.81–0.88). These data indicated that OPN was a useful diagnostic marker for ovarian cancer, although it should be pointed out that one study showed that the OPN level was increased more in the advanced FIGO stages of ovarian cancer [33], suggesting that the diagnostic sensitivity of OPN could be high in advanced ovarian cancer. Kim [22] et al. showed that the diagnostic sensitivity of OPN was 0.80 in early ovarian cancer patients, which is lower than that of advanced patients (0.85). In addition, there was no publication bias observed, indicating that the results are reliable.
Furthermore, our second question intended to address whether OPN could improve the diagnostic accuracy of CA125, a well-established ovarian cancer biomarker, in diagnosis of ovarian cancer. However, we did not compare the diagnostic accuracy of CA125 vs. OPN in diagnosis of ovarian cancer because CA125 is frequently used in the clinic and the test results are not always blinded to gynecologists. Therefore, the test result of CA125 but not OPN may greatly affect the clinical decision of gynecologists. Under such circumstances, the diagnostic accuracy of CA125 may be overestimated [36] and it is unreasonable to compare the diagnostic accuracy of CA125 and OPN. For an undiagnosed ovarian cancer patient, OPN and CA125 can be simultaneously used so that it would be more valuable to determine whether OPN could provide additional information beyond CA125. Statistically, three methods [c-statistics, NRI, and integrated discrimination improvement (IDI)], are currently available to explore whether the index test can add an additional value beyond the traditional test [37]. Among these eligible studies, only one study investigated the added diagnostic value of OPN beyond CA125 by NRI [35]. Although most of the remaining studies investigated the diagnostic accuracy of CA125 for ovarian cancer, they did not statistically confirm whether OPN has an additional diagnostic value beyond CA125. Our data from the current study could conclude that it is still to be elucidated whether OPN improves the diagnostic accuracy of CA125 and a better-designed study is needed to confirm this hypothesis.
The third question we intended to address in the current study was whether OPN is useful in diagnosis of ovarian cancer and we believe our study robustly answers this. We have noted that the major design deficiency of these 13 eligible studies was the subject selection. Ideally, clear inclusion and exclusion criteria should be pre-specified when a test on diagnostic accuracy is performed. These criteria usually consist of medical history and symptoms or signs and are used to outline the characteristics of subjects while representing a group of patients with undiagnostic ovarian cancer. However, we have noted that only one study [26] was prospective design and had clear inclusion and exclusion criteria, while some studies [36, 38, 39] set healthy individuals as the control group. These case-control study designs might over-estimate the diagnostic accuracy of OPN for ovarian cancer. In addition, consecutive or random enrollment is necessary to ensure the prevalence of ovarian cancer in subjects is reflective of that in the real world. However, none of these eligible studies stated that they consecutively enrolled their subjects. Along with subject sampling, it should be noted that some of the eligible studies [24, 27, 28, 30] did not report whether all the subjects received the same reference test, and therefore partial verification bias could not be avoided [40]. Thus, the overall quality of the eligible studies included in this study may not be good enough. We conclude that a future study with a larger sample size, complete verification, clear and unified inclusion and exclusion criteria, and a prospective and consecutive enrollment design is needed to rigorously estimate the diagnostic accuracy of OPN in diagnosis of ovarian cancer.
In addition to pooling the diagnostic characteristics of the index test, identification of heterogeneity is also an important goal of a meta-analysis. Our current study showed that the European origin of patients and controls, and the R&D OPN test Kit were the sources of heterogeneity across these eligible studies. In adition, the publication bias was not significant in the current study, indicating that the results of our meta-analysis are reliable.
The current study does have some limitations. For example, the optimal threshold was obtained from the ROC curve for some studies [27, 31] or scatter plot [28, 30], which may not exactly estimate the actual diagnostic accuracy of OPN. Moreover, twelve of these 13 eligible studies were from Europe or North America, which could yield bias for the specific studied population. Despite these limitations, this is the first systematic review and meta-analysis of the OPN diagnostic accuracy for ovarian cancer. It may guide investigators to better design a future to confirm the potential of biomarkers in diagnosis of ovarian cancer.
Supporting Information
(DOC)
Acknowledgments
We would like to thank Dr. Zhi-Rui Zhou of the Department of Radiation Oncology, Jilin Provincial Tumor Hospital for his valuable input and discussion. We also thank Medjaden Bioscience Limited, Hong Kong, China, for assisting in the preparation of this manuscript.
Data Availability
All relevant data are within the paper and its Supporting Information files.
Funding Statement
This study was supported by a grant from the National Natural Science Foundation of China (#81302541). The funders had no role in study design, data collection and analysis, decision to publish, or preparation of the manuscript.
References
- 1. Siegel R, Ma J, Zou ZJemal A Cancer statistics, 2014. CA Cancer J Clin. 2014; 64: 9–29. 10.3322/caac.21208 [DOI] [PubMed] [Google Scholar]
- 2. Jung KW, Won YJ, Kong HJ, Oh CM, Lee DH, Lee JS. Cancer statistics in Korea: incidence, mortality, survival, and prevalence in 2011. Cancer Res Treat. 2014; 46: 109–123. 10.4143/crt.2014.46.2.109 [DOI] [PMC free article] [PubMed] [Google Scholar]
- 3. Chen W, Zheng R, Zhang S, Zhao P, Zeng H, Zou X, et al. Annual report on status of cancer in China, 2010. Chin J Cancer Res. 2014; 26: 48–58. 10.3978/j.issn.1000-9604.2014.01.08 [DOI] [PMC free article] [PubMed] [Google Scholar]
- 4. Lozano R, Naghavi M, Foreman K, Lim S, Shibuya K, Aboyans V, et al. Global and regional mortality from 235 causes of death for 20 age groups in 1990 and 2010: a systematic analysis for the Global Burden of Disease Study 2010. Lancet. 2012; 380: 2095–2128. 10.1016/S0140-6736(12)61728-0 [DOI] [PMC free article] [PubMed] [Google Scholar]
- 5. Jayson GC, Kohn EC, Kitchener HC, Ledermann JA. Ovarian cancer. Lancet. 2014; 384: 1376–1388. 10.1016/S0140-6736(13)62146-7 [DOI] [PubMed] [Google Scholar]
- 6. Baldwin LA, Huang B, Miller RW, Tucker T, Goodrich ST, Podzielinski I, et al. Ten-year relative survival for epithelial ovarian cancer. Obstet Gynecol. 2012; 120: 612–618. [DOI] [PubMed] [Google Scholar]
- 7. Smith LH. Early clinical detection of ovarian cancer: a review of the evidence. Expert Rev Anticancer Ther. 2006; 6: 1045–1052. [DOI] [PubMed] [Google Scholar]
- 8. Bast RC Jr, Xu FJ, Yu YH, Barnhill S, Zhang Z, Mills GB. CA 125: the past and the future. Int J Biol Markers. 1998; 13: 179–187. [DOI] [PubMed] [Google Scholar]
- 9. Medeiros LR, Rosa DD, da Rosa MIBozzetti MC. Accuracy of CA 125 in the diagnosis of ovarian tumors: a quantitative systematic review. Eur J Obstet Gynecol Reprod Biol. 2009; 142: 99–105. 10.1016/j.ejogrb.2008.08.011 [DOI] [PubMed] [Google Scholar]
- 10. Ahmed M, Behera R, Chakraborty G, Jain S, Kumar V, Sharma P, et al. Osteopontin: a potentially important therapeutic target in cancer. Expert Opin Ther Targets. 2011; 15: 1113–1126. 10.1517/14728222.2011.594438 [DOI] [PubMed] [Google Scholar]
- 11. Rittling SR. Osteopontin in macrophage function. Expert Rev Mol Med. 2011; 13: e15 10.1017/S1462399411001839 [DOI] [PubMed] [Google Scholar]
- 12. Hu ZD, Liu XF, Liu XC, Ding CM, Hu CJ. Diagnostic accuracy of osteopontin for malignant pleural mesothelioma: a systematic review and meta-analysis. Clin Chim Acta. 2014; 433: 44–48. 10.1016/j.cca.2014.02.024 [DOI] [PubMed] [Google Scholar]
- 13. Cheng J, Wang W, Sun C, Li M, Wang BL. Y Meta-analysis of the prognostic and diagnostic significance of serum/plasma osteopontin in hepatocellular carcinoma. J Clin Gastroenterol. 2014; 48: 806–814. 10.1097/MCG.0000000000000018 [DOI] [PubMed] [Google Scholar]
- 14. Bramwell VH, Doig GS, Tuck AB, Wilson SM, Tonkin KS, Tomiak A, et al. Serial plasma osteopontin levels have prognostic value in metastatic breast cancer. Clin Cancer Res. 2006; 12: 3337–3343. [DOI] [PubMed] [Google Scholar]
- 15. Wang YD, Chen H, Liu HQ, Hao M. Correlation between ovarian neoplasm and serum levels of osteopontin: a meta-analysis. Tumour Biol. 2014; 35: 11799–11808. 10.1007/s13277-014-2314-1 [DOI] [PubMed] [Google Scholar]
- 16. Weber GF, Lett GS, Haubein NC. Categorical meta-analysis of Osteopontin as a clinical cancer marker. Oncol Rep. 2011; 25: 433–441. 10.3892/or.2010.1106 [DOI] [PubMed] [Google Scholar]
- 17. Moher D, Liberati A, Tetzlaff J, Altman DG. Group P Preferred reporting items for systematic reviews and meta-analyses: the PRISMA statement. Ann Intern Med. 2009; 151: 264–269, W264. [DOI] [PubMed] [Google Scholar]
- 18. Whiting PF, Rutjes AW, Westwood ME, Mallett S, Deeks JJ, Reitsma JB, et al. QUADAS-2: a revised tool for the quality assessment of diagnostic accuracy studies. Ann Intern Med. 2011; 155: 529–536. 10.7326/0003-4819-155-8-201110180-00009 [DOI] [PubMed] [Google Scholar]
- 19. Reitsma JB, Glas AS, Rutjes AW, Scholten RJ, Bossuyt PM, Zwinderman AH. Bivariate analysis of sensitivity and specificity produces informative summary measures in diagnostic reviews. J Clin Epidemiol. 2005; 58: 982–990. [DOI] [PubMed] [Google Scholar]
- 20. Deeks JJ, Macaskill P, Irwig L. The performance of tests of publication bias and other sample size effects in systematic reviews of diagnostic test accuracy was assessed. J Clin Epidemiol. 2005; 58: 882–893. [DOI] [PubMed] [Google Scholar]
- 21.B D. Midas: computational and graphical routines for meta-analytical integration of diagnostic accuracy studies in Stata. 2007.
- 22. Kim JH, Skates SJ, Uede T, Wong KK, Schorge JO, Feltmate CM, et al. Osteopontin as a potential diagnostic biomarker for ovarian cancer. JAMA. 2002; 287: 1671–1679. [DOI] [PubMed] [Google Scholar]
- 23. Mor G, Visintin I, Lai Y, Zhao H, Schwartz P, Rutherford T, et al. Serum protein markers for early detection of ovarian cancer. Proc Natl Acad Sci U S A. 2005; 102: 7677–7682. [DOI] [PMC free article] [PubMed] [Google Scholar]
- 24. Nakae M, Iwamoto I, Fujino T, Maehata Y, Togami S, Yoshinaga M, et al. Preoperative plasma osteopontin level as a biomarker complementary to carbohydrate antigen 125 in predicting ovarian cancer. J Obstet Gynaecol Res. 2006; 32: 309–314. [DOI] [PubMed] [Google Scholar]
- 25. Meinhold-Heerlein I, Bauerschlag D, Zhou Y, Sapinoso LM, Ching K, Frierson H Jr, et al. An integrated clinical-genomics approach identifies a candidate multi-analyte blood test for serous ovarian carcinoma. Clin Cancer Res. 2007; 13: 458–466. [DOI] [PubMed] [Google Scholar]
- 26. Moore RG, Brown AK, Miller MC, Skates S, Allard WJ, Verch T, et al. The use of multiple novel tumor biomarkers for the detection of ovarian carcinoma in patients with a pelvic mass. Gynecol Oncol. 2008; 108: 402–408. [DOI] [PubMed] [Google Scholar]
- 27. Visintin I, Feng Z, Longton G, Ward DC, Alvero AB, Lai Y, et al. Diagnostic markers for early detection of ovarian cancer. Clin Cancer Res. 2008; 14: 1065–1072. 10.1158/1078-0432.CCR-07-1569 [DOI] [PubMed] [Google Scholar]
- 28. Fredriksson S, Horecka J, Brustugun OT, Schlingemann J, Koong AC, Tibshirani R, et al. Multiplexed proximity ligation assays to profile putative plasma biomarkers relevant to pancreatic and ovarian cancer. Clin Chem. 2008; 54: 582–589. 10.1373/clinchem.2007.093195 [DOI] [PubMed] [Google Scholar]
- 29. Vrzalova J, Prazakova M, Novotny Z, Topolcan O, Casova MHolubec L Jr. Test of ovarian cancer multiplex xMAP technology panel. Anticancer Res. 2009; 29: 573–576. [PubMed] [Google Scholar]
- 30. Lu D, Kuhn E, Bristow RE, Giuntoli RL 2nd, Kjaer SK, Shih Ie M, et al. Comparison of candidate serologic markers for type I and type II ovarian cancer. Gynecol Oncol. 2011; 122: 560–566. 10.1016/j.ygyno.2011.05.039 [DOI] [PMC free article] [PubMed] [Google Scholar]
- 31. He G, Holcroft CA, Beauchamp MC, Yasmeen A, Ferenczy A, Kendall-Dupont J, et al. Combination of serum biomarkers to differentiate malignant from benign ovarian tumours. J Obstet Gynaecol Can. 2012; 34: 567–574. [DOI] [PubMed] [Google Scholar]
- 32. Bandiera E, Zanotti L, Fabricio AS, Bucca E, Squarcina E, Romani C, et al. Cancer antigen 125, human epididymis 4, kallikrein 6, osteopontin and soluble mesothelin-related peptide immunocomplexed with immunoglobulin M in epithelial ovarian cancer diagnosis. Clin Chem Lab Med. 2013; 51: 1815–1824. 10.1515/cclm-2013-0151 [DOI] [PubMed] [Google Scholar]
- 33. Moszynski R, Szubert S, Szpurek D, Michalak S, Sajdak S. Role of osteopontin in differential diagnosis of ovarian tumors. J Obstet Gynaecol Res. 2013; 39: 1518–1525. 10.1111/jog.12097 [DOI] [PubMed] [Google Scholar]
- 34. Milivojevic M, Boskovic V, Atanackovic J, Milicevic S, Razic S, Kotlica BK. Evaluation of osteopontin and CA125 in detection of epithelial ovarian carcinoma. Eur J Gynaecol Oncol. 2013; 34: 83–85. [PubMed] [Google Scholar]
- 35. Pencina MJ, D'Agostino RB Sr, D'Agostino RB Jr,Vasan RS. Evaluating the added predictive ability of a new marker: from area under the ROC curve to reclassification and beyond. Stat Med. 2008; 27: 157–172; discussion 207–112. [DOI] [PubMed] [Google Scholar]
- 36. Whiting P, Rutjes AW, Reitsma JB, Glas AS, Bossuyt PM, Kleijnen J. Sources of variation and bias in studies of diagnostic accuracy: a systematic review. Ann Intern Med. 2004; 140: 189–202. [DOI] [PubMed] [Google Scholar]
- 37. Moons KG, de Groot JA, Linnet K, Reitsma JB, Bossuyt PM. Quantifying the added value of a diagnostic test or marker. Clin Chem. 2012; 58: 1408–1417. [DOI] [PubMed] [Google Scholar]
- 38. Schmidt RL, Factor RE. Understanding sources of bias in diagnostic accuracy studies. Arch Pathol Lab Med. 2013; 137: 558–565. 10.5858/arpa.2012-0198-RA [DOI] [PubMed] [Google Scholar]
- 39. Rutjes AW, Reitsma JB, Vandenbroucke JP, Glas AS, Bossuyt PM. Case-control and two-gate designs in diagnostic accuracy studies. Clin Chem. 2005; 51: 1335–1341. [DOI] [PubMed] [Google Scholar]
- 40. de Groot JA, Bossuyt PM, Reitsma JB, Rutjes AW, Dendukuri N, Janssen KJ, et al. Verification problems in diagnostic accuracy studies: consequences and solutions. BMJ. 2011; 343: d4770 10.1136/bmj.d4770 [DOI] [PubMed] [Google Scholar]
Associated Data
This section collects any data citations, data availability statements, or supplementary materials included in this article.
Supplementary Materials
(DOC)
Data Availability Statement
All relevant data are within the paper and its Supporting Information files.