

Abstract
Microfluidic deterministic lateral displacement (DLD) arrays have been applied for fractionation and analysis of cells in quantities of ~100 μL of blood, with processing of larger quantities limited by clogging in the chip. In this paper, we (i) demonstrate that this clogging phenomenon is due to conventional platelet-driven clot formation, (ii) identify and inhibit the two dominant biological mechanisms driving this process, and (iii) characterize how further reductions in clot formation can be achieved through higher flow rates and blood dilution. Following from these three advances, we demonstrate processing of 14 mL equivalent volume of undiluted whole blood through a single DLD array in 38 minutes to harvest PC3 cancer cells with ~86% yield. It is possible to fit more than 10 such DLD arrays on a single chip, which would then provide the capability to process well over 100 mL of undiluted whole blood on a single chip in less than one hour.
Graphical Abstract

Disabling of mechanisms driving clot formation in deterministic lateral displacement arrays allows rare cell capture from large volumes of blood.
I. Introduction
Deterministic lateral displacement (DLD) arrays are microfluidic devices that offer continuous-flow separation of particles suspended in a fluid based on size. The mechanism of action is that suspended particles in a fluid that are larger than a critical size experience sequential displacement (“bumping”) from one streamtube to an adjacent one in a direction perpendicular to the flow by micro-posts that are arranged in a tilted rectangular array [1]. The critical size above which particles are bumped is controlled by the gap between the posts in the array and the tilt angle [2]. Since blood contains cells that range in size from 1 μm to 20 μm with the size of a cell often being related to its biological function, DLD arrays are well suited to fractionation of blood into leukocytes, erythrocytes, and platelet-rich plasma [3].
Recent work has focused on using DLD arrays to selectively capture rare cells of biological interest. D.W. Inglis et al. demonstrated that DLD arrays can be used to separate malignant lymphocytes from healthy lymphocytes [4]. L.R. Huang et al. have used DLD arrays to capture nucleated red blood cells from the peripheral blood of pregnant women for applications in prenatal diagnostics [5]. S.H. Holm et al. have used DLD arrays to separate parasites from human blood [6]. B. Zhang et al. have used DLD arrays to separate cardiomyocytes from blood [7]. Typical volumes of blood processed for such applications have been limited to 100 μL per DLD array.
While the capture efficiencies achievable with DLD arrays are sufficiently high to be useful in rare cell capture (> 85%), capturing biologically useful quantities of rare cells requires processing of large volumes of blood. Recently, K. Loutherback et al. operated DLD arrays at flow rates as high as 10 mL/min, removing one key barrier to processing large volumes of blood [8]. However, even at this high flow rate, the volume of blood processed was limited to less than 200 μL per DLD array due to clogging in the array. In this paper, we demonstrate that this clogging process is due to the formation of blood clots and identify and inhibit the underlying physical and biological mechanisms driving this process.
Clot formation in DLD arrays imposes three significant limitations on device performance. First, the clot increases the fluidic resistance of the array, limiting the flow rate for a given pressure. Second, the clot formation can alter the flow pattern in a way that affects the critical size or simply displace cells below the critical size, making it appear that these cells behave similar to cells above the critical size and thus decreasing the enrichment. Third, the clot formation captures target cells thus decreasing the yield of a separation process.
The limitations imposed by clot formation in the DLD array have been addressed in recent work. S. Zheng et al. showed that clogging occurred where the cells entered the array and explore the effects of dilution and age of the blood on clogging [9]. S.H. Holm et al. reported no clot formation with coagulation of blood being prevented by EDTA at a concentration of 6 mM. However, the volumes of blood being processed were still very small (~10 μL), the dilution was high (20x), and the flow rate was low (~3 μL/min) [5]. D.W. Inglis et al. mentioned the regular observation of blockages arising in the array from large clot-like structures in the blood despite the removal of such clot-like structures via pre-filtration before blood is loaded onto the array [10].
The effect of surface properties on clot formation in silicon microfluidic devices has been studied extensively [11]. Clot formation in DLD arrays has been observed in both silicon devices and PDMS devices, suggesting that activation of the contact activation coagulation pathway due to contact with silicon dioxide (glass) is not the dominant mechanism driving clot formation in DLD arrays [5,9,10]. In both silicon and PDMS DLD arrays, bovine serum albumin (BSA) has been used at a concentration of 1% (1g per 100 mL) to reduce non-specific adhesion [3–8, 10]. We use BSA in this work at this concentration as a control in order to allow comparison with previous work.
Our experiments are conducted using DLD arrays reactively-etched in silicon to a depth of 160 μm by an isotropic deep-etching process. The arrays are lidded with a pressure-sealing tape consisting of a thin silicone layer with a polyolefin backing. The lidded device is mounted in an acrylic manifold to which fluidic connections are made via O-rings. A dual-syringe pump is used to drive buffer and sample (diluted blood) through the chip. Flow velocities in the array are reported as the syringe volume flow rate divided by the cross section formed by the depth of the channel (160 μm) and the period of the array (post width + gap width = 100 μm) times the number of gaps through which the fluid is flowing (14 for a typical array) for a total effective width of 1.4 mm.
Whole adult human blood from healthy donors was purchased from Interstate Blood Bank (Memphis, TN) for use in our experiments. Blood samples were shipped overnight in acid citrate dextrose anti-coagulated tubes at a temperature of 4°C, and experiments were performed within 36 hours of the draw time. Blood was obtained, processed, and disposed of in accordance with policies and procedures set by the Princeton University Institutional Biosafety Committee (IBC).
II. Origins of Clot Formation
In order to capture rare cells in a product free from non-target cells present in blood, we use a three-input mirrored DLD array (Figure 1). Blood enters the chip through two through-holes (not shown) that each connect to four injector channels (visible via fluorescently tagged leukocytes) that lead to the top and bottom sides of the array. Buffer enters the chip through a through-hole (visible due to light from back of chip) that leads to four injector channels (not visible, but which connects the through-hole to the beginning of the array) that lead to the middle of the array. There is a large amount of stuck fluorescent leukocytes at the beginning of the array. Experimentally, this is indicative of a clogging phenomenon that will cause an increase in the pressure for a given flow rate.
Figure 1.
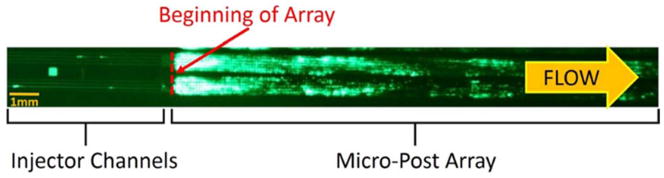
Fluorescent image of stained leukocytes in whole blood entering the DLD micro-post array through injector channels. Leukocytes are stained with SYTO13 at a concentration of 10μL per mL of whole blood. Blood is diluted 1:3 in a running buffer composed of PBS, 1% BSA (1% = 1g per 100 mL), and 1 mM EDTA. The DLD array is a mirrored design in which sample enters at the outer sides of the array through four 40-μm-wide injector channels each on top and bottom, and cells larger than the critical size are displaced toward the center of the array, in which buffer alone is input through four 40-μm-wide injector channels. The array parameters are 60 μm right isosceles triangles, 40 μm gaps, and 1/50 tilt angle, yielding a critical size of approximately 6 μm. The array is 40 mm long, and each half of the mirrored array is 0.7 mm wide. The diluted blood input flow rate (total over both the top and bottom halves of the mirrored array) is 0.10 mL/min and the buffer input flow rate is 0.16 mL/min, giving a flow velocity of 1.8 cm/s. This image was taken with an exposure time of 2.5 seconds at t=30 minutes, after 0.7 mL equivalent volume of undiluted whole blood (2.8 mL of diluted blood in running buffer) had flowed through the array.
From the image in Figure 1 alone, we do not know if capture of the leukocytes at this location is caused by their direct adhesion to the posts or if they are caught due to clogging caused by a different mechanism. Further, note that the clogging does not occur in the injector channels and only happens at the beginning of the array. Since the injector channels are the same width as the gap in the micro-post array, this is significant because it demonstrates that clogging happens dynamically at the beginning of the array and is not due to large clumps that have formed off-chip.
Blood contains three main components: leukocytes, erythrocytes, and a platelet-rich plasma. By experimentally removing or adding these different blood components before the sample enters the chip, we determine the relative contributions of the different components of blood to clogging. Leukocytes, because of their role in wound healing, have some adhesive properties, so we first isolate leukocytes via erythrocyte lysis buffer and centrifuge and re-suspend in a volume of running buffer equal to four times the original volume of blood from which the leukocytes were obtained. Using the isolated leukocytes as the input to the chip, we see the leukocytes alone do not result in significant clogging (Figure 2). Note that the x-axis in Figure 2 represents the corresponding volume of the original blood from which the leukocytes were obtained, not the input volume to the chip which was four times greater. We use such a metric throughout the paper so one can directly relate results to the clinically relevant amount of blood processed. A very approximate but experimentally useful number for comparison is that the pressure begins to increase for a brightness of stuck leukocytes corresponding to a value of 1 on the y-axis in Figure 2. While the pressure increase alone might not be a problem, we note that when it occurs, the fluid flow in parts of the array is no longer parallel to the walls due to local clogging, which detrimentally affects the bumping mechanism.
Figure 2.

Fluorescent brightness of stuck leukocytes (integrated over the array) as a function of volume of components of blood processed corresponding to the volume of undiluted blood from which the components were obtained. Leukocytes are stained with SYTO13 at a concentration of 10 μL per mL of whole blood. Blood is separated into three components – leukocytes, erythrocytes, and platelet-rich plasma – using a combination of erythrocyte lysis buffer and centrifuge. Leukocytes are obtained via centrifuge after blood is treated with erythrocyte lysis buffer. Erythrocytes and platelet-rich plasma are obtained via pipette after centrifuge. The components are then diluted in a running buffer composed of PBS, 1% BSA (1% = 1g per 100mL), and 1mM EDTA to a final volume of four times the volume of undiluted blood from which the components were obtained. DLD array parameters and flow velocity are the same as in Figure 1.
Since erythrocytes do not have biologically significant adhesive properties, we then obtain a combination of erythrocytes and leukocytes via centrifuge by removing platelet-rich plasma via pipette and then re-suspending the erythrocytes and leukocytes in a volume of running buffer equal to four times the original volume of blood from which the leukocytes and erythrocytes were obtained. Similarly, we see that the combination of erythrocytes and leukocytes do not contribute significantly to clogging. However, when we run a combination of leukocytes and platelet-rich plasma diluted 4x in running buffer relative to the original volume of blood from which these were obtained (without erythrocytes), we see a substantial increase in clogging. Following this, we run a combination of erythrocytes, leukocytes, and platelet-rich plasma diluted 4x in running buffer relative to the original volume of blood from which these were obtained, and we observe a slight further increase in clogging, which is consistent with platelets being able to adhere to not just other platelets and leukocytes but also erythrocytes. These results suggest a conventional clotting process driven by platelets is the primary cause of clogging in the DLD array.
The surface of our chips is a thin coating of silicon dioxide from the oxygen plasma treatment and from reaction with air. Since it is well-known that contact with hydrophilic silicon dioxide causes clot formation through contact-activation coagulation [12], we examine two methods of preventing this: direct inhibition of the contact activation coagulation pathway and surface coatings. We used corn trypsin inhibitor to break the coagulation cascade due to contact activation by the surface by preventing the conversion of coagulation factor XII into XIIa [12]. Our results show that a 3.5μM concentration of corn trypsin inhibitor results in a 40% decrease in clot formation, but not enough to enable 10X higher throughputs. We also examined the effect of a fluorocarbon coating to reduce the hydrophilic nature of the surface. The coating increased angle of 112° compared to a contact angle of 4° for our control surface. However, we found that this results in a two-fold increase in clot formation. This is consistent with prior work that showed with a wettability gradient on polyethylene that platelets under shear conditions adhere more strongly to hydrophobic surfaces compared to hydrophilic surfaces [13]. In order to further examine the contribution of protein adsorption on the silicon dioxide surface to clot formation, we use Pluronic F108, which is a block copolymer consisting of ethylene oxide and propylene oxide, in the running buffer at a concentration of 2 mg/mL instead of BSA [14]. Pluronic F108 reduces clot formation by less than 10% compared with BSA, which is consistent with protein adsorption onto the silicon surface not playing a major role in clot formation. The combination of these three results lead us to conclude that it is not surface effects but rather biological mechanisms that are involved in clot formation in DLD arrays.
III. Clot Formation Mechanisms
Clot formation is a very extensive field, and the processes driving clot formation in vivo are well understood. However, clot formation in our devices occurs in a shear-dependent manner in a silicon device environment at shear rates higher than typical physiological levels (>1500 s-1) and in a relatively short time (<1s in the array). Thus, while the conventional understanding of clot formation in vivo may not be directly applicable, we use it as a framework to determine the mechanisms driving clot formation in DLD arrays.
Clot formation is driven by two complementary, mutually dependent processes shown schematically in Figure 3: platelet activation and coagulation. During platelet activation, the contents of stored granules are released into the blood plasma, triggering a clotting cascade, and the platelets change shape from spherical to stellate. Platelet activation can be triggered by a variety of factors, with thrombin-induced platelet activation and mechanical stress-induced platelet activation being the two most relevant to DLD arrays. Coagulation involves the conversion of the soluble protein fibrinogen into insoluble strands of fibrin. In the coagulation cascade, prothrombin is converted into thrombin, which catalyzes the conversion of fibrinogen into fibrin in the presence of calcium to form a clot [15].
Figure 3.
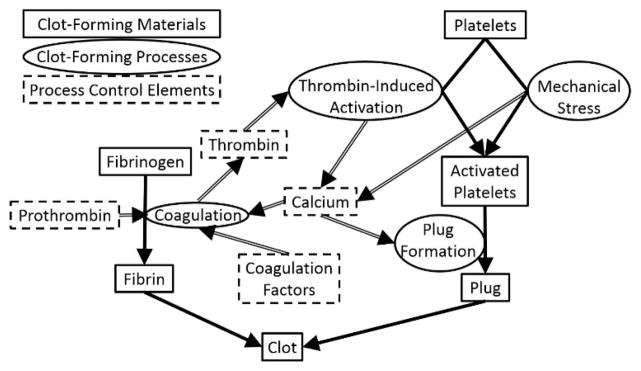
Simplified schematic diagram of conventional clot formation process involving both coagulation (right side) and platelet-activation (left side). Shown are the clot-forming materials (rectangles with solid borders), the mechanistic processes acting on these materials (dark arrows) and names of these processes (ovals adjacent to the dark arrows), and elements in blood that control these processes (rectangles with dashed borders). The light arrows show how the elements control the processes and which process create the elements. Note the feedback loop between the production of thrombin and the generation of calcium connecting the coagulation and platelet activation pathways. Adapted from [15].
From this diagram, we notice two mutual positive feedback interactions between platelet activation and coagulation. First, thrombin, which is a product of the coagulation cascade, induces platelet activation by activating protease-activated receptors on the cell membrane of platelets [16]. Second, platelet activation causes the release of calcium ions into the blood plasma, which promotes coagulation. Therefore, both inhibiting the action of thrombin and chelating calcium ions should result in a significant reduction in clot formation due to the breaking of this feedback loop [15].
IV. Reduction of Clogging
IV.A Chelation of Calcium and Inhibition of Thrombin
In order to inhibit the effect of calcium ions in the blood plasma, either ethylenediaminetetraacetic acid (EDTA) or acid citrate dextrose (ACD) can be used. While both work by chelating calcium, EDTA binds calcium more strongly and irreversibly than ACD. Recent studies have also found EDTA to be more effective than ACD at inhibiting the activity of the glycoprotein IIb/IIIa receptor, which is a key calcium-dependent integrin involved in platelet aggregation [17]. For these reasons, our work focuses primarily on EDTA. Our results (Figure 4) show that increasing the concentration of EDTA from 1mM to 5mM results in a 10-fold reduction in clot formation as measured by the brightness of stuck leukocytes for up to ~0.7 mL equivalent volume of undiluted whole blood processed over a time of 30 minutes. While this is a significant reduction in clot formation, an even larger reduction is necessary to prevent an increase in pressure due to clot formation since pressure scales nonlinearly with the shrinkage of the gap caused by clot formation.
Figure 4.

Effect of the calcium-chelating anticoagulant EDTA and the direct thrombin inhibitor PPACK on clot formation in the DLD array at flow velocities of 1.8cm/s, 4.5cm/s, and 20.3cm/s. Clot formation is measured as the fluorescent brightness of stuck leukocytes as a function of the equivalent volume of undiluted whole blood that has passed through a single DLD array. Leukocytes are stained with SYTO13 at a concentration of 6 μL per mL of whole blood. Blood is diluted 1:3 in a running buffer composed of PBS, 1% BSA (1% = 1g per 100 mL), and either 1mM or 5mM EDTA. PPACK is then added so that the final concentration in the diluted blood is 40μM. DLD array parameters are the same as in Figure 1.
In order to inhibit thrombin-induced platelet activation, we use the direct thrombin inhibitor D-Phenylalanyl-L-prolyl-L-arginine chloromethyl ketone (PPACK). Compared to heparin, PPACK is more effective since it is able to act against both free thrombin and clot-bound thrombin, while heparin can only act against free thrombin [18]. We do not examine the effect of the direct thrombin inhibitor hirudin, as previous studies have found PPACK to be a similarly effective anticoagulant for blood when used at a concentration of at least 40 μM [19]. Adding PPACK at a concentration of 40 μM on top of the 5mM EDTA results in a further 5-fold reduction in clot formation (Figure 4). At a flow rate of 1.8 cm/s, after 30 minutes, during which time 0.7 mL of undiluted blood has been processed, only a barely discernible increase in stuck leukocytes due to clot formation is observed.
We also examined the effect of EDTA and PPACK on reducing clogging in arrays with circular posts. The results (Figure 5) were qualitatively similar. As with triangular posts, we observe a significant decrease in clot formation with the combination of 5mM EDTA and 40μM PPACK compared to the control of 1mM EDTA.
Figure 5.

Effect of the calcium-chelating anticoagulant EDTA and the direct thrombin inhibitor PPACK on clot formation in a DLD array with circular posts at flow velocities of 0.4 cm/s and 0.9 cm/s. Except for DLD array parameters of 18μm circular posts, 18 μm gaps, and 1/42 tilt angle, experimental conditions are as in Figure 4.
In order to keep processing times under one hour even when processing large volumes of blood, we next examine the effect of flow rate on clot formation under conditions of optimal calcium chelation and thrombin inhibition described here.
IV.B. Clot Formation, High Flow Velocity, and Processing Large Volumes of Blood
In addition to keeping processing times short even for large volumes of blood, there are two further reasons for increasing the flow velocity. First, increasing the flow velocity reduces the time in which platelets can form an aggregate within the array and reduces the time in which leukocytes can adhere to the micro-posts. Second, the higher shear stress from the higher flow velocity has been shown to cause disaggregation of platelet aggregates that have already formed [20]. On the other hand, a higher velocity gives a higher shear, which could cause more shear-induced platelet activation and clogging. Thus we performed experiments increasing the flow velocity first by a factor of 2.5 and then by a factor of 11.3 from the velocity of the previous section for triangular posts.
When we increase the flow velocity by a factor of 2.5 to 4.5 cm/s to achieve a higher processed volume in 30 minutes, we observe an additional two-fold reduction in clot formation over the first 0.7 mL and were able to successfully process 2.2 mL equivalent volume of undiluted whole blood over 35 minutes. We then increase the flow velocity to 20.3 cm/s to measure the extent of clot formation as 14 mL of blood flows through a single DLD array in 45 minutes. We again observe a similarly slow linear increase in the fluorescent brightness of stuck leukocytes over the entire 14 mL of blood (Figure 4).
At all three flow velocities, over the 30–45 minute experimental time, the stuck leukocytes do not appear primarily near the input end of the chip, but are rather uniformly distributed throughout the array. This leads us to conclude that no platelet-driven plug formation is observed with 5mM EDTA and 40μM PPACK, and that the slow linear increase in fluorescent brightness of stuck leukocytes is due to isolated leukocyte adhesion to the posts. Furthermore, the average shear rate at the flow velocity of 20.3 cm/s is 25,000 s−1, which is more than 10 times typical physiological shear rates of 50 s−1 to 2000 s−1 [21] and well above the 10,000 s−1 at which shear-induced platelet activation has been reported [22]. Even under these conditions, the combination of 5mM EDTA and 40μM PPACK prevents platelet plug formation in DLD arrays. We note that the high shear may also have a positive benefit of detaching adherent cells from the posts [23]. High flow rates were also tested with circular posts (Figure 5), and again large volumes could be processed with minimal clogging.
IV.C. Effects of Mechanical Stress and Gap Scaling on Clot Formation
We seek the source which initiates the clogging process in the array. Mechanical stress, particularly in the form of shear stress in a microfluidic channel, is a well-known cause of platelet activation, which could lead to clot formation [24, 25, 26]. From Figure 2 and similar experiments, we do not observe any clogging in the injector channels leading to the array. This implies that shear at sidewall alone is not a major source of clogging. Figure 6 shows a 2-D simulation of the flow speeds in the injector channels and DLD array with triangular posts. For 150 μm depth channels, the simulation condition represents a flow of 110 μL/min per injector channel, which is comparable to an input flow rate of 1.30 mL/min for the chip of Figure 1. Shear stresses in the injector channels have a peak of 16,000 s−1, which is comparable to the peak shear stress in the gap in the array. However, experimentally, even at shear rates exceeding this, only negligible clogging is observed in the injector channels.
Figure 6.

Color contour plot of the magnitude of the flow velocity in the injector channels and beginning of the DLD micro-post array. The injector channels are 40 μm wide, and the micro-post array is composed of 60 μm right isosceles triangles with 40 μm gaps and a 1/50 tilt. Note that the magnitude of the velocity is constant in the injector channels whereas there is acceleration and deceleration in the micro-post array. The conditions in this simulation correspond to an average flow velocity of 11 cm/s as described in Figure 1.
As seen in Figure 1, the clogging begins at the start of the DLD array. From the simulations, the peak shear stress in the injector channels does not differ significantly from the peak shear stress in the array, but the shear stress increases and decreases rapidly vs. time as the fluid accelerates and decelerates in the array. It has previously been shown that for a single constriction, similar to a single gap in the array, in a blood vessel, a clot expands from a small aggregate of platelets through adhesion of platelets in the low-shear zones at the downstream face of the clot [27]. While no such low-shear zones exist in the injector channels, the acceleration and deceleration of the fluid in the gaps provide a number of such low-shear zones for a clot to form.
Shear-induced platelet activation requires platelet membrane glycoproteins Ib and IIb–IIIa as well as the presence of von Willebrand factor [28]. We measure the effect of the glycoprotein IIb–IIIa inhibitor tirofiban at a concentration of 100 ng/mL of blood to test the contribution of shear-induced platelet aggregation to clot formation [29]. Our results (with 1mM EDTA) show that tirofiban at this concentration reduces clot formation by 40% at a flow velocity of 1.8 cm/s for the first 0.7 mL of blood through the array. This provides further support that mechanical shear stress is an important factor in initiating the clogging process in the array.
We examined the effect of scaling the gap size by comparing the clogging in two triangular arrays – one with post and gap of 40 and 27 microns, respectively, and the second with 60 and 40 microns, with only 1 mM EDTA added to the input mixture (Figure 7). A qualitatively different clogging pattern was observed as the gap was reduced; there was more clogging immediately after the beginning of the array (much more intense fluorescence), and less farther downstream. This qualitative difference was consistently observed over different flow speeds. In order for a larger gap to become clogged by a clot, an aggregate of platelets at least as large as the gap needs to form. Thus, for a given concentration of platelets, it takes longer for such an aggregate to form since it would require a greater number of platelet-platelet interactions. Furthermore, if the inlets are held at a fixed pressure, the flow velocity in the DLD array with the smaller gap will be slower than in the DLD array with the larger gap, leading to more time for clots to form. Rapid clogging near the array inlet would prevent the transport of white blood cells (and platelets and other clotting agents) downstream to the farther end of the array. The combination of these effects explains the more rapid clogging right at the beginning of the array with smaller gaps.
Figure 7.
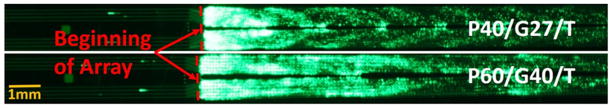
Fluorescent image of stained leukocytes in whole blood entering two DLD micro-post arrays (right of dashed red line) through injector channels (left of dashed red line). Leukocytes are stained with SYTO13 at a concentration of 10μL per mL of whole blood. Blood is diluted 1:3 in a running buffer composed of PBS, 1% BSA (1% = 1g per 100 mL), and 1 mM EDTA. The DLD arrays are a mirrored design as in Figure 1. The array parameters are 40 μm right isosceles triangles, 27 μm gaps, and 1/28 tilt angle for the top DLD array and 60 μm right isosceles triangles, 40 μm gaps, and 1/50 tilt angle for the bottom DLD array. This image was taken with an exposure time of 2.5 seconds at t=30 minutes, after 0.4 mL equivalent volume of undiluted whole blood (1.6 mL of diluted blood in running buffer) had flowed through the top DLD array and 0.7 mL equivalent volume of undiluted whole blood (2.8 mL of diluted blood in running buffer) had flowed through the bottom DLD array.
V. DLD Array Performance for High Volume Separation at High Flow Rate
We then tested the performance of three-input mirrored DLD arrays, as in Figure 1, to harvest prostate cancer cells (PC3) from blood using the conditions for minimum clogging from Section IV. The fractions of the total number of cancer cells, leukocytes, and erythrocytes, respectively that appear in the product compared to that processed through the input are measured to characterize the device performance. The fraction of cancer cells, the diameters of which are above the critical size of the array, is taken as a measure of the collection efficiency. The fraction of undesired erythrocytes (RBCs) appearing in the product is a measure of the depletion efficiency, which is another important parameter in characterizing three-input mirrored DLD arrays (a low “yield” is desired). The fraction of leukocytes (WBCs) appearing in the product is also measured so that the enrichment of cancer cells and purity of the product can be calculated. The target PC3 prostate cancer cells have an average diameter of 17 μm [30]. The results of our experiments are summarized in Table 1.
Table 1.
DLD Array Performance for High Volume Separation at High Flow Rates for Different Array Parameters
| PC3 Cancer Cells | Leukocytes | Erythrocytes | |
|---|---|---|---|
| Post: 60μm, Gap: 40μm, Tilt: 1/50, Triangular Posts, Center Wall Sample Input Volume: 56 mL |
Sample: 3.1×10⁴/mL Product: 8.2×10⁴/mL Sample/Product Volume: 3.4 Yield: 77% |
Sample: 1.7×10⁶/mL Product: 5.0×10⁵/mL Sample/Product Volume: 3.4 Yield: 8.6% |
Sample: 1.2×10⁹/mL Product: 1.8×10⁸/mL Sample/Product Volume: 3.4 Yield: 4.5% |
| Post: 64μm, Gap: 34μm, Tilt: 1/26, Circular Posts, No Center Wall Sample Input Volume: 56 mL |
Sample: 3.2×10⁴/mL Product: 8.0×10⁴/mL Sample/Product Volume: 2.9 Yield: 86% |
Sample: 1.9×10⁶/mL Product: 7.1×10⁴/mL Sample/Product Volume: 2.9 Yield: 1.3% |
Sample: 1.3×10⁹/mL Product: 1.1×10⁶/mL Sample/Product Volume: 2.9 Yield: 0.03% |
As a first experiment, the PC3 cells are collected along a central wall in the middle of the array with triangular posts, as in Figure 1 [31]. With array parameters of 60 μm triangular posts, 40 μm gaps, and 1/50 tilt angle, the critical size is approximately 6.1 μm. The array length was 40.00 mm, the total width of the array region including the center wall was 1.44 mm, with 0.62 mm width of post array in both the top half and bottom half of the array. The product is collected from a region spanning the central 0.22 mm of the array including the center wall. GFP-labelled PC3 cells were spiked in 14 mL of whole blood diluted 1:3 in a running buffer composed of PBS, 1% BSA, 5mM EDTA, and 40 μM PPACK at an approximate concentration of 3x10⁴ per mL. After running through the array for 45 minutes at a flow velocity of 20.3 cm/s (processing an input volume of 56 mL), the collection efficiency of PC3 cells into the product outlet was 77%. However, erythrocyte contamination of the product was significant with nearly 4.5% of the input erythrocytes appearing in the product. At the high Reynolds number used in these flows (Re ~ 10), it has recently been reported that erythrocytes, which have a discoid shape, behave in a DLD array as if they have a much larger size than they do at low Reynolds number, an effect not observed for circular posts [32]. Thus more are collected as “large cells” than would otherwise occur.
We then created an array with 64 μm circular posts, 34 μm gaps, and 1/26 tilt angle, for which the critical size is approximately 10 μm. The central “collection” wall in the mirrored array was also removed to present fewer surface for leukocyte sticking – the fluidic balance between the top and bottom regions kept the output buffer stream confined to this central region [31]. The array length was 38.22 mm, the total width of the array region including the central collection region was 2.24 mm, with 1.06 mm width of post array in both the top half and bottom half of the array. The product is collected from a region spanning the central 0.35 mm of the array including the collection region. The experiment is run under the same conditions as the first experiment except that the duration is now 38 minutes and the average flow velocity is 21.7 cm/s. The collection efficiency of PC3 cells is 86%, slightly higher than in the triangle post chip, but the erythrocyte yield has dropped over 100X, from 4.5% to 0.03%, and now consists of small clumps of 3–5 erythrocytes.
This represents the highest collection efficiency of cancer cells for a large volume of diluted whole blood (>7.5 mL) processed in a short time (<1 hour). By comparison, E. Sollier et al. used size-selective vortex technology to process 7.5 mL of blood in 20 minutes but achieved a maximum collection efficiency of less than 10% [33]. Using another inertial cell separation technique, slanted spiral microfluidics, M.E. Warkiani et al. processed 7.5 mL of blood in 8 minutes achieving a capture efficiency greater than 80%, but use of this technology requires lysis of red blood cells before processing [34].
Conclusions
Clogging in DLD arrays processing blood has limited their applicability for capture of rare cells to blood volumes well under 1 mL for each array. In this paper, we have first shown that clogging of the array is caused by a conventional platelet-driven clot formation process. Next, we identified the presence of calcium ions and thrombin as drivers of platelet-driven clot formation process and disabled these two drivers using the calcium-chelating anticoagulant EDTA and the direct thrombin inhibitor PPACK.
Using these approaches, we have demonstrated that 14 mL of blood can be processed using a single DLD array in less than 45 minutes at flow velocities as high as 20 cm/s with no significant clot formation by the successful harvesting of PC3 prostate cancer cells from blood. Future work could include using a second DLD array in series to further concentrate the harvested cells [1]. Standard micro-fabrication techniques have been previously used to produce a chip containing 15 DLD arrays in parallel, which would require an area of 36mm by 70mm for the array presented in this paper [4, 35]. Combining a chip containing 15 of our DLD arrays in parallel with the advances presented in this paper should allow for processing of well over 100 mL of blood for rare cell capture in less than one hour.
Acknowledgments
The research described was funded by GPB Scientific LLC, an NIH STTR Award (Project 1R41HL110574) via GPB Scientific LLC, and by the National Cancer Institute (U54CA143803) through the Physical Sciences in Oncology Program. We also thank Dr. Ken Pienta for providing the PC3 cancer cells.
References
- 1.Huang LR, Cox EC, Austin RH, Sturm JC. Science. 2004;304:987–990. doi: 10.1126/science.1094567. [DOI] [PubMed] [Google Scholar]
- 2.Inglis DW, Davis JA, Austin RH, Sturm JC. Lab on a Chip. 2006;6:655–658. doi: 10.1039/b515371a. [DOI] [PubMed] [Google Scholar]
- 3.Davis JA, Inglis DW, Morton KJ, Lawrence DA, Huang LR, Chou SY, Sturm JC, Austin RH. Proceedings of the National Academy of Sciences. 2006;103:14779–14784. doi: 10.1073/pnas.0605967103. [DOI] [PMC free article] [PubMed] [Google Scholar]
- 4.Inglis DW, Davis JA, Zieziulewicz TJ, Lawrence DA, Austin RH, Sturm JC. Journal of Immunological Methods. 2008;329:151–156. doi: 10.1016/j.jim.2007.10.004. [DOI] [PubMed] [Google Scholar]
- 5.Huang R, Barber TA, Schmidt MA, Tompkins RG, Toner M, Bianchi DW, Kapur R, Flejter WL. Prenatal Diagnosis. 2008;28:892–899. doi: 10.1002/pd.2079. [DOI] [PMC free article] [PubMed] [Google Scholar]
- 6.Holm SH, Beech JP, Barrett MP, Tegenfeldt JO. Lab on a Chip. 2011;11:1326–1332. doi: 10.1039/c0lc00560f. [DOI] [PubMed] [Google Scholar]
- 7.Zhang B, Green JV, Murthy SK, Radisic M. PloS One. 2012;7:e37619. doi: 10.1371/journal.pone.0037619. [DOI] [PMC free article] [PubMed] [Google Scholar]
- 8.Loutherback K, D’Silva J, Liu L, Wu A, Austin RH, Sturm JC. AIP Advances. 2012;2:042107. doi: 10.1063/1.4758131. [DOI] [PMC free article] [PubMed] [Google Scholar]
- 9.Zheng S, Yung R, Tai YC, Kasdan H. Micro Electro Mechanical Systems, 2005. MEMS 2005. 18th IEEE International Conference on; 2005. pp. 851–854. [Google Scholar]
- 10.Inglis DW, Lord M, Nordon RE. Journal of Micromechanics and Microengineering. 2011;21:054024. [Google Scholar]
- 11.Vadgama P. Surfaces and interfaces for biomaterials. CRC Press; 2005. [Google Scholar]
- 12.Bäck J, Lang MH, Elgue G, Kalbitz M, Sanchez J, Ekdahl KN, Nilsson B. Biomaterials. 2009;30(34):6573–6580. doi: 10.1016/j.biomaterials.2009.07.052. [DOI] [PubMed] [Google Scholar]
- 13.Spijker HT, Bos R, Busscher HJ, van Kooten TG, van Oeveren W. Biomaterials. 2002;23(3):757–766. doi: 10.1016/s0142-9612(01)00181-8. [DOI] [PubMed] [Google Scholar]
- 14.Li XJJ, Zhou Y, editors. Microfluidic devices for biomedical applications. Elsevier; 2013. [Google Scholar]
- 15.Heemskerk JWM, Bevers EM, Lindhout T. THROMBOSIS AND HAEMOSTASIS-STUTTGART. 2002;88:186–194. [PubMed] [Google Scholar]
- 16.Nylander S, Mattsson C. Blood coagulation & fibrinolysis. 2003;14:159–167. doi: 10.1097/00001721-200302000-00007. [DOI] [PubMed] [Google Scholar]
- 17.Colace TV, Tormoen GW, McCarty OJT, Diamond SL. Annual review of biomedical engineering. 2013;15:283–303. doi: 10.1146/annurev-bioeng-071812-152406. [DOI] [PMC free article] [PubMed] [Google Scholar]
- 18.Weitz JI. The American Journal of Cardiology. 1995;75:18B–22B. doi: 10.1016/0002-9149(95)80005-d. [DOI] [PubMed] [Google Scholar]
- 19.May JA, Heptinstall S. Platelets and Megakaryocytes. Humana Press; 2004. pp. 3–11. [Google Scholar]
- 20.Huang PY, Hellums JD. Biophysical journal. 1993;65:54–361. doi: 10.1016/S0006-3495(93)81080-4. [DOI] [PMC free article] [PubMed] [Google Scholar]
- 21.Freitas RA., Jr . Nanomedicine, vol I, Basic Capabilities. Landes Bioscience; 1999. [Google Scholar]
- 22.Holme PA, Ørvim U, Hamers MJAG, Solum NO, Brosstad FR, Barstad RM, Sakariassen KS. Arteriosclerosis, thrombosis, and vascular biology. 1997;17:646–653. doi: 10.1161/01.atv.17.4.646. [DOI] [PubMed] [Google Scholar]
- 23.Lu H, Koo LY, Wang WM, Lauffenburger DA, Griffith LG, Jensen KF. Analytical chemistry. 2004;76(18):5257–5264. doi: 10.1021/ac049837t. [DOI] [PubMed] [Google Scholar]
- 24.Ramstack JM, Zuckerman L, Mockros LF. Journal of biomechanics. 1979;12:113–125. doi: 10.1016/0021-9290(79)90150-7. [DOI] [PubMed] [Google Scholar]
- 25.Holme PA, Ørvim U, Hamers MJAG, Solum NO, Brosstad FR, Barstad RM, Sakariassen KS. Arteriosclerosis, thrombosis, and vascular biology. 1997;17:646–653. doi: 10.1161/01.atv.17.4.646. [DOI] [PubMed] [Google Scholar]
- 26.Hellums JD, Peterson DM, Stathopoulos NA, Moake JL, Giorgio TD. Cerebral ischemia and hemorheology. Springer; Berlin Heidelberg: 1987. pp. 80–89. [Google Scholar]
- 27.Nesbitt WS, Westein E, Tovar-Lopez FJ, Tolouei E, Mitchell A, Fu J, Carberry J, Fouras A, Jackson SP. Nature medicine. 2009;15:665–673. doi: 10.1038/nm.1955. [DOI] [PubMed] [Google Scholar]
- 28.Peterson DM, Stathopoulos NA, Giorgio TD, Hellums JD, Moake JL. Blood. 1987;69:625–628. [PubMed] [Google Scholar]
- 29.Schneider DJ, Baumann PQ, Whitaker DA, Sobel BE. Journal of cardiovascular pharmacology. 2005;46:41–45. doi: 10.1097/01.fjc.0000162770.83324.17. [DOI] [PubMed] [Google Scholar]
- 30.Lu B, Xu T, Zheng S, Goldkorn A, Tai YC. Micro Electro Mechanical Systems (MEMS), 2010 IEEE 23rd International Conference on; 2010. pp. 935–938. [Google Scholar]
- 31.Inglis DW. Applied Physics Letters. 2009;94:013510. [Google Scholar]
- 32.Ranjan S, Zeming KK, Jureen R, Fisher D, Zhang Y. Lab on a Chip. 2014;14:4250–4262. doi: 10.1039/c4lc00578c. [DOI] [PubMed] [Google Scholar]
- 33.Sollier E, Go DE, Che J, Gossett DR, O’Byrne S, Weaver WM, Kummer N, et al. Lab on a Chip. 2014;14:63–77. doi: 10.1039/c3lc50689d. [DOI] [PubMed] [Google Scholar]
- 34.Warkiani ME, Guan G, Luan KB, Lee WC, Bhagat AAS, Chaudhuri PK, Tan DSW, et al. Lab on a Chip. 2014;14:128–137. doi: 10.1039/c3lc50617g. [DOI] [PubMed] [Google Scholar]
- 35.Karabacak NM, Spuhler PS, Fachin F, Lim EJ, Pai V, Ozkumur E, Martel JM, et al. Nature protocols. 2014;9:694–710. doi: 10.1038/nprot.2014.044. [DOI] [PMC free article] [PubMed] [Google Scholar]