Abstract
Objective
To evaluate the relationship of coronary artery calcium (CAC) to coronary heart disease (CHD) events among young and elderly individuals.
Participants and Methods
This is a secondary analysis of data from a prospective, multi-ethnic, population-based cohort study designed to study subclinical atherosclerosis. A total of 6809 persons aged 45 to 84 years old without known cardiovascular disease at baseline were enrolled from July 2000-September 2002. All participants had CAC scoring performed, and were followed up for a median of 8.5 years. The main outcome measures studied were CHD events, defined as myocardial infarction, definite angina or probable angina followed by revascularization, resuscitated cardiac arrest or death attributable to coronary heart disease.
Results
Comparing individuals with CAC=0 to those with CAC > 100, there was an increased incidence of CHD events from 1 to 21/1000 person-years, and 2 to 23/1000 person-years in the 45-54 and 75-84 year old age groups respectively. Compared to CAC=0, CAC 1-100 and CAC >100 impart an increased multi-variable adjusted CHD event risk in both the 45-54 and 75-84 year old age groups [HR (95% CI): 45-54 years old, CAC 1-100: 2.3 (0.9-5.8), CAC>100: 12.4 (5.1-30.0); 75-84 years old, CAC 1-100: 5.4 (1.2-23.8), CAC>100: 12.1 (2.9-50.2)].
Conclusions
Increased CAC imparts an increased CHD risk in younger and elderly individuals, suggesting that once CAC is known chronologic age has less importance. The utility of CAC scoring as a risk-stratification tool extends both to younger and elderly patients.
Keywords: coronary artery calcium, coronary artery disease, aging
Introduction
The American Heart Association and the European Society of Cardiology guidelines ascribe a Class IIA recommendation for coronary artery calcium (CAC) testing in asymptomatic patients at intermediate-risk for coronary heart disease (CHD) (1, 2). Given the reliance of risk-scoring algorithms on chronologic age, this recommendation excludes many young and elderly patients who are typically classified as low or high risk respectively. Less than 10% of young patients, and approximately 22% of elderly patients are considered intermediate risk (3, 4). The utility of CAC testing in young and elderly patients has therefore not been well delineated.
A potential argument against the use of CAC scoring in elderly patients is that since the burden of calcified coronary atherosclerotic plaque increases with age (5), most elderly patients will have some CAC, thus reducing the ability of CAC to refine risk-stratification in the elderly. Although elderly individuals might be expected to have an increased prevalence of CAC, few studies have specifically investigated the impact of increasing CAC on the incidence of CHD events in elderly individuals (4, 6-9).
In contrast, the utility of CAC scoring in young patients may be questioned because of the potential burden of non-calcified coronary plaque (5). CAC scoring may therefore not fully capture the potential CHD risk associated with rupture-prone, non-calcified coronary plaque (10). The utility of CAC scoring in young patients is even more obscure, given the concerns of radiation exposure and cost-effectiveness. Prior attempts to clarify the role of CAC testing in young individuals have been limited by a low incidence of CHD events (11) and referral bias (6).
We hypothesized that CAC would be a similarly strong, independent predictor of absolute and relative risk of CHD events in patients 75-84 years old, as well as in young patients aged 45-54 years old. We also studied whether the CHD-event risk would be lower in an elderly patient with a CAC score of zero when compared to a young individual with high CAC.
Methodology
The Multi-Ethnic Study of Atherosclerosis (MESA) is a prospective population-based cohort comprising 4 pre-specified ethnicities (White, African American, Hispanic, Chinese), and 6 US communities-Baltimore City and Baltimore County, Maryland; Chicago, Illinois; Forsyth County, North Carolina; Los Angeles County, California; New York, New York; and St. Paul, Minnesota. The primary goal of the MESA is to evaluate the characteristics and risk factors of subclinical cardiovascular disease. The study design has been previously published (12).
A total of 6809 persons aged 45 to 84 years old without known cardiovascular disease at baseline were recruited from July 2000 to September 2002, and had CAC scoring performed. The institutional review boards of each site approved the study, and all participants gave written informed consent.
Risk Factor Measurement
A questionnaire was used to obtain demographic data, cardiovascular risk factors and medical history. Resting blood pressure was measured three times in the seated position using a Dinamap model Pro 100 automated oscillometric sphygmomanometer (Critikon, Tampa, Florida). The average of the last two measurements was used in analysis. Total cholesterol, high-density lipoprotein cholesterol (HDL), triglycerides, and plasma glucose were measured after a 12-hour fast.
Hypertension was defined as a blood pressure of ≥ 140 mm Hg/90 mm Hg or the use of anti-hypertensive medications. Diabetes was defined as a fasting glucose level of ≥126 mg/deciliter or the use of anti-hyperglycemic medications. A family history of CHD was defined as a first degree relative with a history of CHD, coronary angioplasty, or coronary-artery bypass surgery. Participants were classified as current smokers, former smokers, or never smokers.
CAC Measurement
The MESA CAC scanning protocol has been previously published (13). Chest computed tomography (CT) was performed using either a cardiac-gated electron-beam CT scanner (Chicago, Los Angeles, and New York field centers), (Imatron C-150; Imatron, San Francisco, California), or a prospective electrocardiogram-triggered multi-detector CT scanner acquired at 50 percent of the R-R interval. Four 2.5-mm slices were acquired for each cardiac cycle in sequential or axial scan mode (the Baltimore, Forsyth County, and St. Paul field centers) (Lightspeed, General Electric Medical Systems, Waukesha, Wisconsin; or Volume Zoom, Siemens, Erlanger, Germany).
Each participant underwent two CT scans, and the mean of both Agatston CAC scores (14) was used in analysis. All CT scans were read at a single center by two independent cardiologists. There was acceptable intra-observer and inter-observer agreement (kappa statistics, 0.93 and 0.90, respectively).
Definition of CHD Event
The primary endpoint was the incidence of all CHD events over the study period. A CHD event was defined as myocardial infarction, definite angina or probable angina followed by revascularization, resuscitated cardiac arrest or CHD death, while a hard CHD event was defined as CHD death or non-fatal myocardial infarction. Angina was graded as absent, probable, or definite based on clinical judgment. Definite angina required documentation of symptoms distinct from myocardial infarction diagnoses. A classification of definite angina required documentation of reversible myocardial ischemia or obstructive coronary artery disease.
Follow-up
Participants were contacted every 6-12 months for development of new medical conditions, and had follow-up examinations every 18-24 months. The median follow-up was 8.5 years (inter-quartile range 7.7-8.6 years).
Two independent paired cardiologists or cardiac epidemiologists reviewed medical records for classification of all cardiovascular events. If disagreements occurred, medical records were reviewed by a third reviewer, or by the mortality and morbidity review committee prior to making the final classification.
Reviewers classified myocardial infarction as present based on a combination of symptoms, electrocardiographic findings, and cardiac biomarker levels. A determination of CHD death was made if death occurred within 28 days after myocardial infarction, if there was chest pain within 72 hours preceding death, or if there was a history of CHD and no known non-cardiovascular cause of death.
Statistical Analysis
The study population was stratified into the following baseline age groups (45-54, 55-64, 65-74, 75-84) and CAC groups (0, 1-100, >100). Chi-square testing was employed to determine statistical significance for discrete variables, while Analysis of Variance test (ANOVA) and Kruskal Wallis tests were used for parametric and non-parametric continuous variables respectively.
The study population was divided by age into 20 smaller age categories with approximately equivalent numbers of participants. The percentage of participants within each CAC group was plotted against age to generate a continuous curve of the prevalence of different CAC groups with increasing age.
The incidence of all CHD events and hard CHD events per 1000 person-years, as well as Kaplan–Meier survival curves were calculated across age groups and CAC groups. Cox proportional hazards regression models were computed to determine the hazard ratio of CHD events with increasing CAC groups and age groups, compared to CAC=0 and age group 45-54 respectively. The final model adjusted for age (as a continuous variable to adjust for residual confounding within each age group), gender, ethnicity, MESA site, education level, hypertension, diabetes mellitus, smoking, LDL cholesterol, HDL cholesterol, family history of CHD, triglycerides, BMI, anti-hypertensive and lipid-lowering medication, and CAC score. All analyses were conducted with Stata software, version 11.0 (Stata Corp, College Station, Texas).
Results
Baseline Characteristics
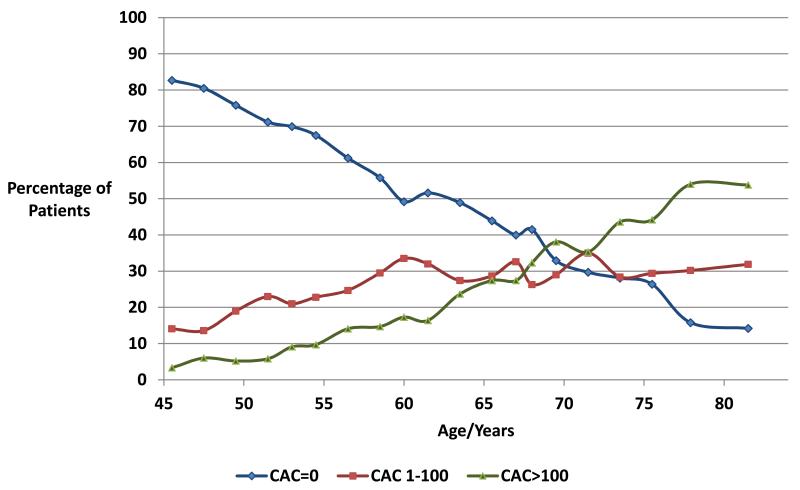
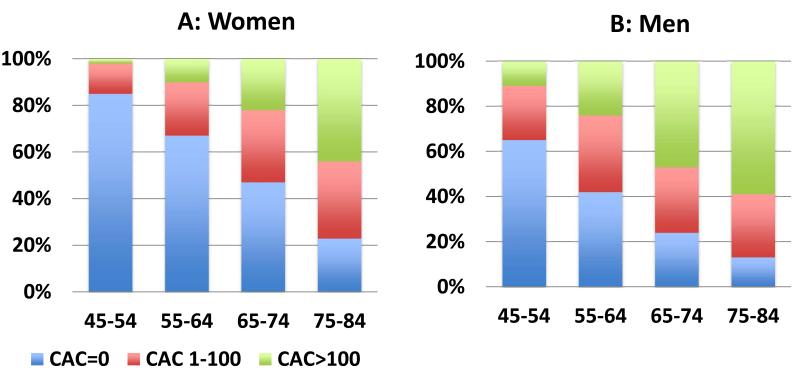
Males constituted 47% of the population. As age group increased, the percentage of patients with hypertension and diabetes mellitus increased while the proportion of current smokers decreased (Table 1). With increasing age, there was an increased proportion of patients in the CAC 1-100 and CAC>100 groups (Figure 1). The percentage of patients with CAC >100 increased from 3% at age 45 years old to 54% at age 82 years old. Conversely, the proportion of patients with CAC=0 decreased from 83% in patients aged 45 years old to 14% in patients aged 82 years old. There were lower proportions of women with CAC compared to men in all age groups (Figure 2A, 2B). In the 45-54 year old age group, 11% of men had CAC >100, compared to only 2% of women.
Table 1.
Baseline Characteristics Of The Population
| Characteristic | Age 45-54 N=1947 |
Age 55-64 N=1882 |
Age 65-74 N=2015 |
Age 75-84 N=965 |
P value |
|---|---|---|---|---|---|
| Male | 909/46.7 | 881/46.8 | 962/47.7 | 458/47.5 | 0.90 |
| Education Level * | 992/50.9 | 1119/59.4 | 1267/62.9 | 677/70.2 | <.001 |
| Caucasian | 723/37.1 | 711/37.8 | 795/39.5 | 390/40.4 | 0.14 |
| Chinese | 224/11.5 | 222/11.8 | 236/11.7 | 121/12.5 | |
|
African-
American |
536/27.5 | 519/27.6 | 584/29.0 | 253/26.2 | |
| Hispanic | 464/23.8 | 430/22.9 | 400/19.9 | 201/20.8 | |
| Smoking:Never | 1001/51.5 | 916/48.8 | 964/48.1 | 535/55.7 | <.001 |
| Former | 575/29.6 | 672/35.8 | 858/42.8 | 379/39.4 | |
| Current | 367/18.9 | 289/15.4 | 184/9.2 | 47/4.9 | |
| Family History ** | 705/37.8 | 797/44.6 | 843/45.4 | 385/44.0 | <.001 |
| Hypertension | 479/24.6 | 790/42.0 | 1156/57.4 | 631/65.4 | <.001 |
| SBP | 116.7 (17.2) | 125.3 (19.6) | 132.1 (21.7) | 137.6 (23.3) | <.001 |
| DBP | 72.0 (10.3) | 73.1 (10.1) | 71.8 (10.4) | 69.7 (9.9) | 0.31 |
| Diabetes mellitus | 150/7.8 | 248/13.2 | 307/15.3 | 152/15.8 | <.001 |
| LDL-C | 118.2 (31.1) | 119.0 (33.0) | 116.0 (30.5) | 114.3 (30.7) | 0.003 |
| HDL-C | 49.5 (14.1) | 50.8 (15.0) | 51.9 (15.3) | 52.1 (14.6) | 0.002 |
| Triglycerides § | 108(75-160) | 116 (83-169) | 110 (79-160) | 107 (75-151) | <.001 |
| hs-CRP § | 1.7 (0.7-4.3) | 2.1 (0.9-4.6) | 2.0 (0.9-4.3) | 1.7 (0.9-3.6) | <.001 |
| BMI | 28.7 (5.9) | 28.8 (5.6) | 28.2 (5.3) | 27.1 (4.6) | <.001 |
| Mean heart rate | 63.3 (9.4) | 63.4 (9.5) | 62.7 (9.8) | 63.0 (10.0) | 0.054 |
| Lipid medication | 150/7.7 | 288/15.3 | 457/22.7 | 204/21.1 | <.001 |
|
Hypertensive on
medication |
394/20.3 | 653/34.7 | 977/48.5 | 509/52.8 | <.001 |
|
Metabolic
Syndrome |
504 (25.9) | 630 (33.5) | 769 (38.2) | 340 (35.2) | <.001 |
| FRS (%) | 3.6 (4.1) | 6.8 (6.0) | 10.3 (6.8) | 15.8 (7.4) | <.001 |
Categorical variables expressed as number/%, continuous variables expressed as mean/standard deviation.
Education level: finished high school;
Indicates a positive family history of premature CHD (men <55, women<65);
parameter expressed as median (inter-quartile range); SBP: systolic blood pressure;
DBP: diastolic blood pressure; LDL-C: LDL cholesterol; HDL-C: HDL cholesterol; hs-CRP: high sensitivity C-reactive protein; BMI: body mass index; FRS: Framingham risk score.
Figure 1. Proportion of Patients in Each CAC Group with Increasing Age.
CAC: coronary artery calcium.
Figure 2. Gender-based CAC Distribution Across Age Groups.
P <.001 for trends in both 2A and 2B. CAC: coronary artery calcium.
The mean Framingham Risk Score (FRS) increased with increasing CAC group in all age groups. In the 45-54 year old age group, all participants had a low FRS despite increasing CAC categories from 0 to >100 (age 45-54: FRS for CAC=0: 3%, CAC 1-100: 5%, CAC>100: 8%). In the 75-84 year old age group, FRS increased from 13% to 17% as CAC increased from 0 to >100.
CHD Events Across Increasing CAC and Age Groups
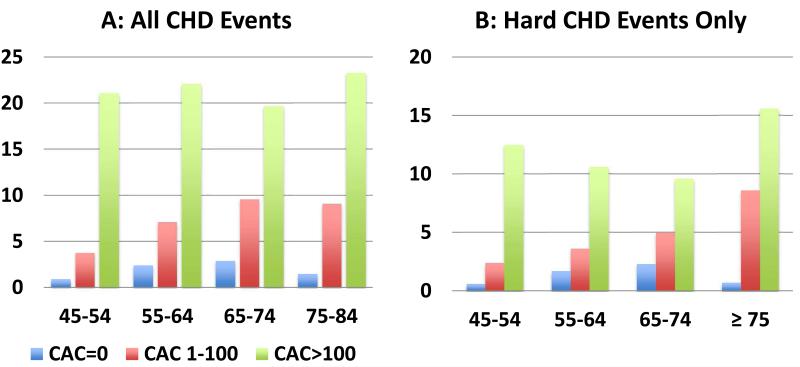
An increase in all CHD event rates was noted with increasing age group (45-54 year old group: 2.5/1000 person-years, 75-84 year old group: 14.4/1000 person-years, P<.001), and increasing CAC group (CAC=0: 1.8/1000 person-years, CAC >100: 21.3/1000 person-years, P<.001) (Figure 3A). This trend persisted for both all CHD events as well as hard CHD events only (Figure 3B).
Figure 3. Incident CHD Rate/1000 Person-Years- Distribution Among Age Groups And CAC Groups.
P<.001 for trends in both 3A and 3B. CAC: coronary artery calcium; CHD: coronary heart disease.
When CHD event rates were stratified by CAC group across age groups, the trend of increasing CHD event rate with increasing CAC group persisted, even in the oldest and youngest age groups (Figure 3A, 3B). In the 45-54 year old age group, an increase in CAC group from 0 to >100 resulted in an increase in all CHD events from 0.9 to 21.1/1000 person-years, while a similar increase in CAC group in the 75-84 year old age group was associated with an increase in all CHD events from 1.5 to 23.3/1000 person- years. CAC=0 in the 75-84 year old age group was associated with a lower incidence of all CHD events than CAC 1-100 and >100 in the 45-54 year old age group (75-84 years old- CAC=0: 1.5/1000 person-years, 45-54 years old- CAC 1-100: 3.8/1000 person- years, CAC >100: 21.1/1000 person-years).
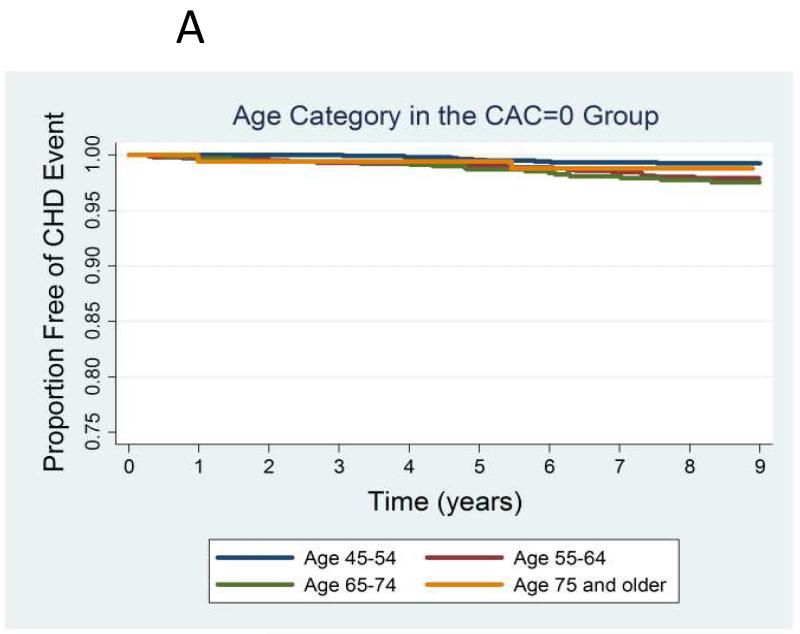
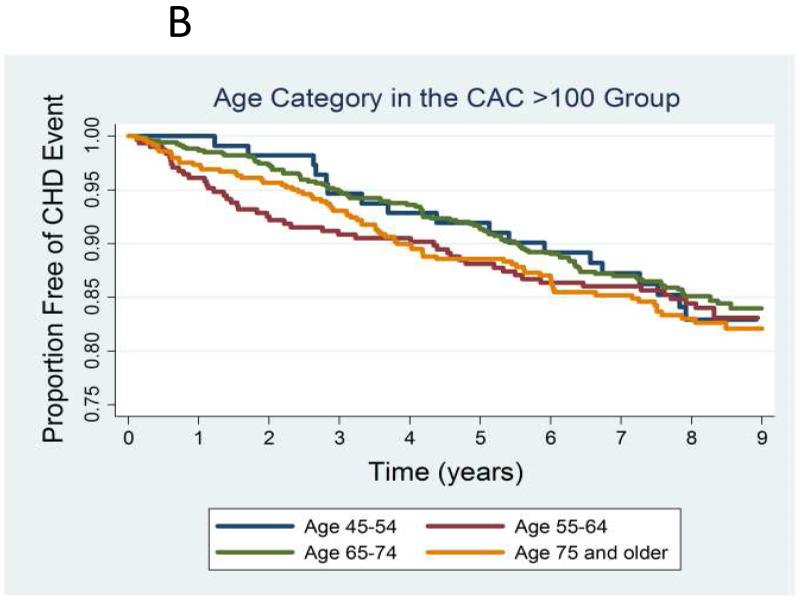
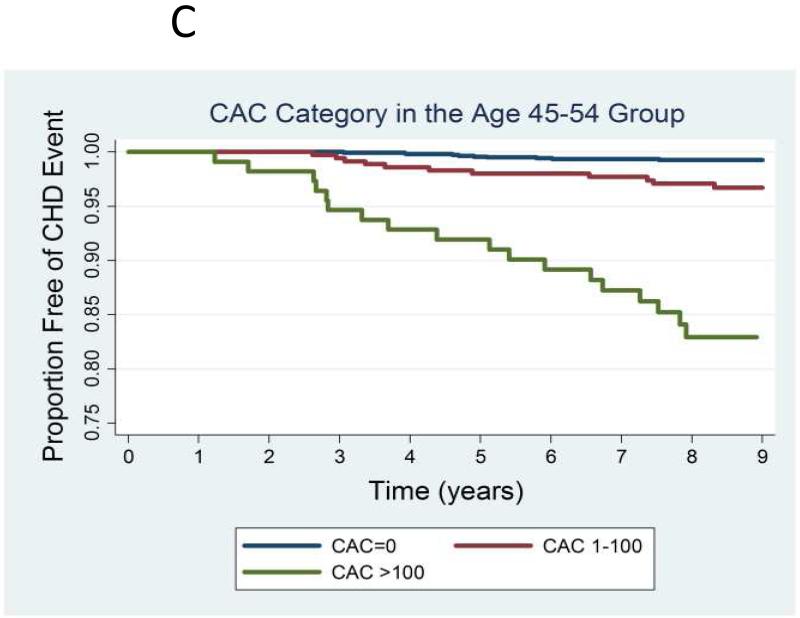
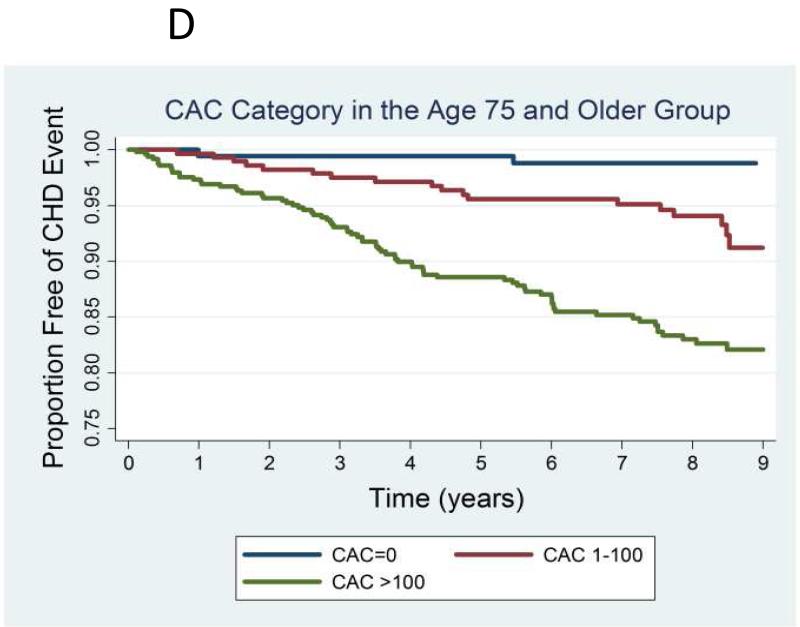
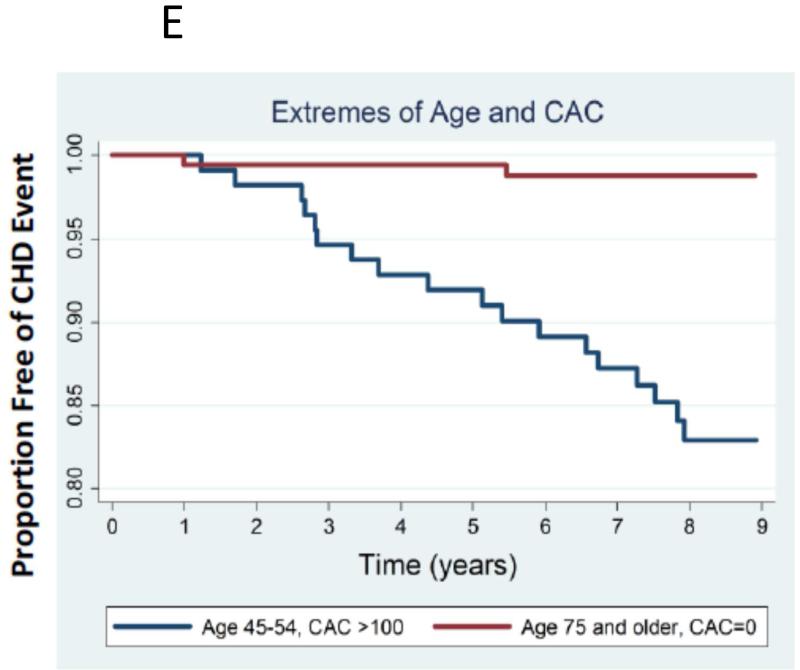
The Kaplan-Meier curves for CHD event-free survival for different age groups were similar within the CAC=0 (Figure 4A) and CAC >100 groups (Figure 4B). In the 45-54 year old age group, as CAC group increased from zero to >100, CHD event-free survival decreased from 99% to 83%. A similar trend was noted in the 75-84 year old group (Figures 4C-D). Figure 4E demonstrates that patients 75-84 years old with CAC=0 had a higher CHD event-free survival (98%) compared to 45-54 year old patients with CAC >100 (83%).
Figure 4. A-E: Kaplan-Meier Curves of all CHD Event-free Survival Among Age and CAC Groups.
CHD: coronary heart disease. CAC: coronary artery calcium.
CHD Risk Ratio Across Increasing CAC Groups and Age Groups
Increasing age group predicts an increased risk of CHD events after adjustment for cardiovascular and demographic risk factors (Table 2). Model 3 demonstrates a four-fold increased CHD event risk in the 75-84 year old age group compared to the 45-54 year old age group. After adjustment for CAC score, the increased CHD risk portended by increasing age group attenuates significantly for all age groups. A similar trend is noted when only hard CHD events are considered, when comparing the 45-54 year old and 75-84 year old groups (P<.001, Table 2). Participants 75-84 years old still had an increased though attenuated risk of hard CHD events compared to the 45-54 year old age group, after adjustment for cardiovascular risk factors and CAC.
Table 2.
Hazard Ratio For CHD Events Across Age Groups With Multi-Variable Adjustment
| All CHD Events |
Age Group |
Hazard Ratio (95% Confidence Interval) | P values Model 4 |
|||
|---|---|---|---|---|---|---|
| Model 1 | Model 2 | Model 3 | Model 4 | |||
| Age 45-54 | 1 (ref) | 1 (ref) | 1 (ref) | 1 (ref) | -- | |
| Age 55-64 | 2.7 (1.8-3.9) | 2.7 (1.8-3.9) | 2.1 (1.4- 3.1) |
1.6 (1.1- 2.4) |
0.016 | |
| Age 65-74 | 4.1 (2.9-5.8) | 4.1 (2.9-5.8) | 3.2 (2.2- 4.6) |
1.8 (1.2- 2.6) |
0.005 | |
| Age 75-84 | 5.7 (4.0-8.3) | 5.8 (4.0-8.4) | 4.3 (2.9- 6.5) |
1.9 (1.2- 2.9) |
0.004 | |
|
Hard
CHD Events |
||||||
| Age 45-54 | 1 (ref) | 1 (ref) | 1 (ref) | 1 (ref) | -- | |
| Age 55-64 | 2.3 (1.4-3.6) | 2.3 (1.4-3.6) | 1.8 (1.1- 2.9) |
1.4 (0.9- 2.4) |
0.16 | |
| Age 65-74 | 3.5 (2.2-5.4) | 3.5 (2.2-5.4) | 2.7 (1.6- 4.3) |
1.7 (1.0- 2.7) |
0.05 | |
| Age 75-84 | 6.6 (4.2- 10.4) |
6.7 (4.2- 10.6) |
4.7 (2.8- 7.9) |
2.4 (1.4- 4.2) |
0.002 | |
Model 1: unadjusted; Model 2: adjusted for gender, ethnicity and MESA site; Model 3: multi-variable adjustment of Model 2, including hypertension, diabetes mellitus, LDL, HDL, triglycerides, smoking status, family history, BMI, mean heart rate, hypertensive medications, lipid-lowering medications, education level; Model 4: Model 3 adjusted for CAC. P-values for models 1-3 are <.001; P-values for model 4 are shown above.
Compared to CAC=0, CAC 1-100 and CAC >100 impart a two-fold and twelve-fold increased risk of all CHD events in patients 45-54 years old after multi-variable adjustment (Table 3). In this age group, CAC>100 also leads to a significantly increased risk of hard CHD events compared to CAC=0 (hazard ratio 7.8 [95% CI 2.5-24.0], P<.001).
Table 3.
Hazard Ratios For CHD Events Across Age Groups Stratified By CAC Group
| Age Group |
CAC Score |
Hazard Ratio (95% CI) | ||||
|---|---|---|---|---|---|---|
| Model 1 | Model 2 | p-valuea | Model 2- Hard CHD Events only |
p-valueB | ||
| 45-54 | 0 | 1 (ref) | 1 (ref) | -- | 1 (ref) | -- |
| 1-100 | 4.4 (1.9-10.5) | 2.3 (0.9-5.8) | 0.08 | 2.3 (0.8-6.8) | 0.14 | |
| >100 | 24.9 (11.5-54.0) | 12.4 (5.1-30.0) | <0.001 | 7.8 (2.5-24.0) | <.001 | |
| 55-64 | 0 | 1 (ref) | 1 (ref) | -- | 1 (ref) | -- |
| 1-100 | 2.9 (1.6-5.1) | 1.7 (0.9-3.2) | 0.08 | 1.3 (0.6-2.9) | 0.49 | |
| >100 | 9.0 (5.4-15.1) | 5.3 (3.0-9.3) | <0.001 | 3.8 (1.8-7.9) | <.001 | |
| 65-74 | 0 | 1 (ref) | 1 (ref) | -- | 1 (ref) | -- |
| 1-100 | 3.4 (1.9-6.0) | 2.7 (1.5-4.9) | 0.002 | 1.8 (0.9-3.8) | 0.10 | |
| >100 | 6.9 (4.1-11.7) | 4.9 (2.8-8.8) | <0.001 | 2.7 (1.4-5.4) | 0.005 | |
| 75-84 | 0 | 1 (ref) | 1 (ref) | -- | 1 (ref) | -- |
| 1-100 | 6.1 (1.4-26.1) | 5.4 (1.2-23.8) | 0.024 | 11.6 (1.5-88.3) | 0.02 | |
| >100 | 15.6 (3.8-63.5) | 12.1 (2.9-50.2) | 0.001 | 20.3 (2.8-149.8) | 0.003 | |
p-value for model 2.
p-value for model 2- hard events.
Model 1: unadjusted; Model 2: multi-variable adjustment of Model 1, including hypertension, diabetes mellitus, LDL, HDL, triglycerides, smoking status, family history, BMI, mean heart rate, hypertensive medications, lipid-lowering medications, education level.
In participants 75-84 years old, CAC 1-100 and >100 convey a significantly increased risk of all CHD events and hard CHD events compared to CAC=0 (Table 3). Participants in this age group with CAC 1-100 and >100 have an eleven-fold and twenty-fold increased risk of hard CHD events compared with those with CAC=0
Discussion
We demonstrated that increasing CAC group is significantly associated with a higher risk of all CHD events and hard CHD events, both in the 45-54 year old and 75-84 year old groups. The absence of CAC imparted a high CHD event-free survival regardless of age group. While there was a higher risk of CHD events with increasing age, this risk was significantly attenuated after adjustment for CAC. At the extremes of age and CAC burden, younger adults with a high CAC score had a higher CHD risk than elderly adults with no CAC. Ours is the first study to document these findings in a multi-ethnic population-based cohort, allowing for the broader applicability of our results to the general population.
Comparison With Other Studies
Taylor et al (11) studied 1983 40-50 year old participants with no baseline CHD and noted a twelve-fold increased incidence of CHD events if CAC was present. Another cohort demonstrated a significantly increased all-cause mortality risk with increasing CAC among patients <45 years old and 45-54 years old (6). Both studies were limited by a short follow-up period (3 years and 5.6 years respectively). Both studies have limited applicability to the general population, as the former evaluated army recruits, while the latter study consisted of participants referred based on cardiovascular risk factors, thereby selecting for a higher risk group of patients.
In comparison, the cardiovascular risk factor burden of our study’s 45-54 year old age group is comparable to the wider US population (NHANES data, 45-64 year old population: hypertension 30.4%, diabetes mellitus 13.7%, tobacco use 21.1%) (15-17). Nasir et al demonstrated that patients with a significant risk factor burden but no CAC have a better prognosis than patients with no risk factors but a high CAC score (18). This is highly pertinent in younger patients, in whom the burden of cardiovascular risk factors is lower than older patients for whom conventional risk-scoring algorithms have proven utility. Our study therefore emphasizes the potential for elevated CAC in this age group to independently predict CHD events, including cardiovascular death and myocardial infarction in the general population.
We demonstrated that CAC=0 in the 75-84 year old age group had an 8.5-year survival approaching 98%, comparable to younger patients with no CAC (Figure 3A/3B). Our findings with regards to CAC in older patients mirror those of prior studies (4, 6-9). The Rotterdam study determined that patients >70 years old with CAC >100 had a significantly higher CHD event risk compared to CAC 0-100 (19). In comparison, our study recognizes the prominence of a CAC score of 0 as a negative cardiovascular risk factor (20), and extends this finding to elderly patients.
A large cohort of referred patients confirmed that patients ≥75 years old with CAC=0 had a median 5.6-year survival of 98% (6). This study also demonstrated that elderly patients with a low CAC score had a lower mortality rate than younger patients with CAC>100. Our study has strengthened prior research by demonstrating the predictive ability of CAC in elderly patients, not only for all-cause mortality, but also for CHD events. Our findings extend those of the Rotterdam study (21) by demonstrating that elderly patients in a multi-ethnic cohort with CAC=0 have an excellent prognosis for up to 8.5 years after CAC scanning.
Interpretation of the Study: Implications For Clinicians and Policy-Makers
Elderly patients with CAC=0 have an excellent prognosis for up to 8.5 years after CAC scanning. With the introduction of new American Heart Association cardiovascular risk assessment and cholesterol treatment guidelines (21, 22), and the possibility for more widespread use of statins, our study’s findings with regards to elderly patients have much more potential for clinical utility. The Pooled Cohort Equation over-estimates cardiovascular risk in MESA participants (23), a finding likely to extend to the 75-84 year old age group (average Framingham risk score 16%). Our study demonstrated a graded increase in CHD event rates based on CAC group in the 75-84 year old age group, suggesting that patients in this age group with increased CAC might benefit from statin therapy. This is in contrast to the Pooled Cohort Equations’ estimation where the overwhelming majority of this age group would qualify for statin therapy based on a 10-year cardiovascular risk of >7.5%.
An attenuation of the CHD event risk with increasing age group was noted after CAC adjustment (Table 2). This confirms that once overall atherosclerotic burden is accounted for, age is a less significant predictor of CHD events. This concept is critical in the young and elderly due to the prevailing emphasis of age in risk-scoring algorithms. A secondary analysis of MESA examining the predictive value of age/gender-adjusted percentile CAC scores versus absolute CAC scores exemplifies this finding by demonstrating that absolute CAC scores were better predictors of CHD events than age-adjusted CAC scores (24).
Limitations
An age-based CAC estimate (average, below average, or above average) was revealed to participants and their physicians. Knowledge of a high CAC score may possibly affect the diagnosis of angina leading to an increase in CHD events. However, the trends noted in both age groups are similar when just hard CHD events are considered, suggesting that this factor did not significantly affect overall findings.
Participants with a high CAC score may have had more intensive risk factor modification, thereby reducing the number of CHD events noted in follow-up. This has the potential of biasing the results towards the null hypothesis.
As age increases, the burden of cardiovascular risk factors also increases. MESA only enrolled participants without known CHD, suggesting that there may have been a selection bias towards a healthier elderly sample than is truly representative of the general population. However, our results in the 75-84 year old age group reflect those of other population-based studies, suggesting that this factor did not significantly impact our findings.
Conclusion
A CAC score of 0 in 75-84 year old patients is associated with a lower risk of CHD events compared to higher CAC subgroups, and compared to 45-54 year old patients with high CAC scores. In the 45-54 year old age group, CAC has the potential to identify a subgroup of patients with advanced atherosclerosis who are at a much higher risk of death and CHD. This finding has immense potential in terms of refinement of current risk stratification methods so that aggressive preventive treatment can be targeted towards young patients at increased cardiovascular risk.
Acknowledgments
The authors thank the other investigators, the staff, and the participants of the MESA study for their valuable contributions. A full list of participating MESA investigators and institutions can be found at http://www.mesa-nhlbi.org.
This research was supported by grants N01-HC-95159 through N01-HC-95169 from the National Heart, Lung, and Blood Institute.
Abbreviations
- CAC
coronary artery calcium
- CHD
coronary heart disease
- CT
computed tomography
- MESA
Multi-Ethnic Study of Atherosclerosis
- HDL
high-density lipoprotein
- BMI
body mass index
- FRS
Framingham risk score
Footnotes
Financial support and disclosures: Dr Matthew Budoff is on the speakers’ bureau for General Electric. All other authors report no relevant financial disclosure.
Publisher's Disclaimer: This is a PDF file of an unedited manuscript that has been accepted for publication. As a service to our customers we are providing this early version of the manuscript. The manuscript will undergo copyediting, typesetting, and review of the resulting proof before it is published in its final citable form. Please note that during the production process errors may be discovered which could affect the content, and all legal disclaimers that apply to the journal pertain.
References
- 1.Taylor AJ, Cerqueira M, Hodgson JM, et al. ACCF/SCCT/ACR/AHA/ASE/ASNC/NASCI/SCAI/SCMR 2010 Appropriate Use Criteria for Cardiac Computed Tomography. Circulation. 2010;122(21):e525–55. doi: 10.1161/CIR.0b013e3181fcae66. [DOI] [PubMed] [Google Scholar]
- 2.Perk J, De Backer G, Gohlke H, et al. European Guidelines on cardiovascular disease prevention in clinical practice (version 2012) Eur Heart J. 2012;33(13):1635–701. doi: 10.1093/eurheartj/ehs092. [DOI] [PubMed] [Google Scholar]
- 3.Berry JD, Lloyd-Jones DM, Garside DB, Greenland P. Framingham risk score and prediction of coronary heart disease death in young men. Am Heart J. 2007;154(1):80–6. doi: 10.1016/j.ahj.2007.03.042. [DOI] [PMC free article] [PubMed] [Google Scholar]
- 4.Elias-Smale SE, Proença RV, Koller MT, et al. Coronary Calcium Score Improves Classification of Coronary Heart Disease Risk in the Elderly: The Rotterdam Study. J Am Coll Cardiol. 2010;56(17):1407–14. doi: 10.1016/j.jacc.2010.06.029. [DOI] [PubMed] [Google Scholar]
- 5.Tota-Maharaj R, Blaha MJ, Rivera JJ, et al. Differences in coronary plaque composition with aging measured by coronary computed tomography angiography. Int J Cardiol. 2012;158(2):240–5. doi: 10.1016/j.ijcard.2011.01.041. [DOI] [PubMed] [Google Scholar]
- 6.Tota-Maharaj R, Blaha MJ, McEvoy JW, et al. Coronary artery calcium for the prediction of mortality in young adults <45 years old and elderly adults >75 years old. Eur Heart J. 2012;33(23):2955–62. doi: 10.1093/eurheartj/ehs230. [DOI] [PubMed] [Google Scholar]
- 7.Raggi P, Gongora MC, Gopal A, Callister TQ, Budoff M, Shaw LJ. Coronary artery calcium to predict all-cause mortality in elderly men and women. J Am Coll Cardiol. 2008;52(1):17–23. doi: 10.1016/j.jacc.2008.04.004. [DOI] [PubMed] [Google Scholar]
- 8.Newman AB, Naydeck BL, Ives DG, et al. Coronary artery calcium, carotid artery wall thickness, and cardiovascular disease outcomes in adults 70 to 99 years old. Am J Cardiol. 2008;101(2):186–92. doi: 10.1016/j.amjcard.2007.07.075. [DOI] [PMC free article] [PubMed] [Google Scholar]
- 9.LaMonte MJ, FitzGerald SJ, Church TS, et al. Coronary artery calcium score and coronary heart disease events in a large cohort of asymptomatic men and women. Am J Epidemiol. 2005;162(5):421–9. doi: 10.1093/aje/kwi228. [DOI] [PubMed] [Google Scholar]
- 10.Villines TC, Hulten EA, Shaw LJ, et al. CONFIRM Registry Investigators: Prevalence and severity of coronary artery disease and adverse events among symptomatic patients with coronary artery calcification scores of zero undergoing coronary computed tomography angiography: results from the CONFIRM (Coronary CT Angiography Evaluation for Clinical Outcomes: An International Multicenter) registry. J Am Coll Cardiol. 2011;58(24):2533–40. doi: 10.1016/j.jacc.2011.10.851. [DOI] [PubMed] [Google Scholar]
- 11.Taylor AJ, Fiorilli PN, Wu H, et al. Relation between the Framingham Risk Score, coronary calcium, and incident coronary heart disease among low-risk men. Am J Cardiol. 2010;106(1):47–50. doi: 10.1016/j.amjcard.2010.02.009. [DOI] [PubMed] [Google Scholar]
- 12.Bild DE, Bluemke DA, Burke GL, et al. Multi-Ethnic Study of Atherosclerosis: Objectives and Design. Am J Epidemiol. 2002;156:871–881. doi: 10.1093/aje/kwf113. [DOI] [PubMed] [Google Scholar]
- 13.Carr JJ, Nelson JC, Wong ND, et al. Calcified coronary artery plaque measurement with cardiac CT in population-based studies: standardized protocol of Multi-Ethnic Study of Atherosclerosis (MESA) and Coronary Artery Risk Development in Young Adults (CARDIA) study. Radiology. 2005;234:35–43. doi: 10.1148/radiol.2341040439. [DOI] [PubMed] [Google Scholar]
- 14.Agatston AS, Janowitz WR, Hildner FJ, Zusmer NR, Viamonte M, Jr, Detrano R. Quantification of coronary artery calcium using ultrafast computed tomography. J Am Coll Cardiol. 1990;15:827–32. doi: 10.1016/0735-1097(90)90282-t. [DOI] [PubMed] [Google Scholar]
- 15.Yoon SS, Burt V, Louis T, Carroll MD. NCHS Data Brief. Vol. 107. National Center for Health Statistics; Hyattsville, MD: 2012. Hypertension among adults in the United States, 2009-2010. [PubMed] [Google Scholar]
- 16.Centers for Disease Control and Prevention . National diabetes fact sheet: national estimates and general information on diabetes and prediabetes in the United States, 2011. U.S. Department of Health and Human Services, Centers for Disease Control and Prevention; Atlanta, GA: 2011. [Google Scholar]
- 17.Centers for Disease Control and Prevention Vital Signs: Current Cigarette Smoking Among Adults Aged ≥ 18 Years—United States, 2005-2010. Morbidity and Mortality Weekly Report. 2011;60(33):1207–12. [PubMed] [Google Scholar]
- 18.Nasir K, Rubin J, Blaha MJ, et al. Interplay of coronary artery calcification and traditional risk factors for the prediction of all-cause mortality in asymptomatic individuals. Circ Cardiovasc Imaging. 2012;5(4):467–73. doi: 10.1161/CIRCIMAGING.111.964528. [DOI] [PubMed] [Google Scholar]
- 19.Vliegenthart R, Oudkerk M, Hofman A, et al. Coronary calcification improves cardiovascular risk prediction in the elderly. Circulation. 2005;112(4):572–7. doi: 10.1161/CIRCULATIONAHA.104.488916. [DOI] [PubMed] [Google Scholar]
- 20.Blaha M, Budoff MJ, Shaw LJ, et al. Absence of Coronary Artery Calcification and All-Cause Mortality. JACC Cardiovasc Imaging. 2009;2(6):692–700. doi: 10.1016/j.jcmg.2009.03.009. [DOI] [PubMed] [Google Scholar]
- 21.Goff DC, Jr, Lloyd-Jones DM, Bennett G, et al. 2013 ACC/AHA guideline on the assessment of cardiovascular risk: a report of the American College of Cardiology/American Heart Association Task Force on Practice Guidelines. Circulation. 2013;00:000–000. [Google Scholar]
- 22.Stone NJ, Robinson J, Lichtenstein AH, et al. 2013 ACC/AHA guideline on the treatment of blood cholesterol to reduce atherosclerotic cardiovascular risk in adults: a report of the American College of Cardiology/American Heart Association Task Force on Practice Guidelines. Circulation. 2013;00:000–000. [Google Scholar]
- 23.Ridker PM, Cook NR. Statins: New American guidelines for prevention of cardiovascular disease. Lancet. 2013;382(9907):1762–5. doi: 10.1016/S0140-6736(13)62388-0. [DOI] [PubMed] [Google Scholar]
- 24.Budoff MJ, Nasir K, McClelland RL, et al. Coronary calcium predicts events better with absolute calcium scores than age-sex-race/ethnicity percentiles: MESA (Multi-Ethnic Study of Atherosclerosis) J Am Coll Cardiol. 2009;53(4):345–52. doi: 10.1016/j.jacc.2008.07.072. [DOI] [PMC free article] [PubMed] [Google Scholar]


