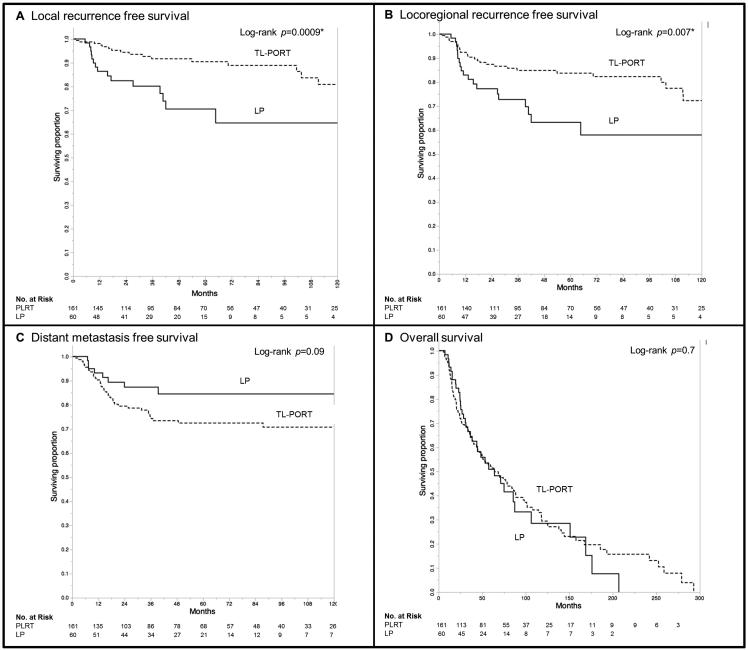
Figure 3.
Kaplan-Meier curves depicting; local recurrence free survival (A), locoregional recurrence free survival (B), distant metastasis free survival (C), and overall survival (D) for patients stratified by type of treatment received (LP=laryngeal preservation, TL-PORT=post-laryngectomy radiotherapy)

