Abstract
Speech sounds evoke unique neural activity patterns in primary auditory cortex (A1). Extensive speech sound discrimination training alters A1 responses. While the neighboring auditory cortical fields each contain information about speech sound identity, each field processes speech sounds differently. We hypothesized that while all fields would exhibit training-induced plasticity following speech training, there would be unique differences in how each field changes. In this study, rats were trained to discriminate speech sounds by consonant or vowel in quiet and in varying levels of background speech-shaped noise. Local field potential and multiunit responses were recorded from four auditory cortex fields in rats that had received 10 weeks of speech discrimination training. Our results reveal that training alters speech evoked responses in each of the auditory fields tested. The neural response to consonants was significantly stronger in anterior auditory field (AAF) and A1 following speech training. The neural response to vowels following speech training was significantly weaker in ventral auditory field (VAF) and posterior auditory field (PAF). This differential plasticity of consonant and vowel sound responses may result from the greater paired pulse depression, expanded low frequency tuning, reduced frequency selectivity, and lower tone thresholds, which occurred across the four auditory fields. These findings suggest that alterations in the distributed processing of behaviorally relevant sounds may contribute to robust speech discrimination.
Keywords: Speech therapy, Auditory processing, Receptive field plasticity, Map reorganization
1. Introduction
Speech sounds each evoke a unique neural pattern of activation in primary auditory cortex [1,2]. For example, the consonant ‘b’ evokes activity from low frequency tuned neurons first, followed by high frequency tuned neurons, while the consonant ‘d’ evokes activity from high frequency tuned neurons first, followed by low frequency neurons. Like humans, animals can easily discriminate between speech sounds. Behavioral discrimination accuracy can be predicted by the neural similarity of the A1 pattern of response to pairs of speech sounds [1,3]. Pairs of sounds that evoke very similar A1 patterns of activity are difficult for animals to discriminate, while pairs of sounds that evoke very distinct A1 patterns of activity are easy for animals to discriminate. Consonant processing relies on precise spike timing information, while vowel processing relies on mean spike count information [3]. Extensive speech sound discrimination training alters A1 responses in both humans and animals [4,5].
Previous studies suggest that the different fields of auditory cortex have different functions. For example, deactivation of PAF impairs spatial sound localization ability, while deactivation of AAF impairs temporal sound identification ability [6,7]. Multiple auditory fields contain information about speech sound identity, although there are differences in the representation across fields [3,8,9]. At higher levels of the central auditory system, responses to speech sounds become more diverse and less determined by spectral power alone. For example, speech responses in inferior colliculus are more influenced by spectral power compared to neurons in A1 [3,9,10]. PAF and VAF neurons with similar frequency tuning have speech responses that are more independent, which indicates that acoustic features other than spectral power are more important in these fields than in earlier fields [8]. Previous studies have documented an increased or a decreased response to trained songs in songbirds, depending on which non-primary auditory field the responses are recorded from [11,12]. We hypothesized that speech training would alter responses across each of the auditory cortex fields. We expected that some training-induced changes would be common to all of the fields, while other changes would differ from field to field. As in the songbird studies, we predicted that some fields would exhibit an increased response to speech sounds, while other fields would exhibit a decreased response to speech sounds.
2. Materials and methods
2.1 Speech sounds
The speech sounds ‘bad’, ‘chad’, ‘dad’, ‘dead’, ‘deed’, ‘dood’, ‘dud’, ‘gad’, ‘sad’, ‘shad’, and ‘tad’ spoken by a female native English speaker were used in this study, as in our previous studies [1,4,8,13]. The sounds were individually recorded in a double-walled soundproof booth using a 1/4” ACO Pacific microphone (PS9200-7016) with a 10 µs sampling rate and 32-bit resolution. Each sound was shifted up one octave using the STRAIGHT vocoder [14] to better match the rat hearing range. Both the fundamental frequency and the spectrum envelope were shifted up in frequency by a factor of two, while leaving all temporal information intact. Speech sounds were presented so that the loudest 100 ms of the vowel portion of the sound was 60 dB SPL.
2.2 Speech training
Rats were trained to discriminate speech sounds by differences in initial consonant or vowel, as in our previous studies [1,4,15,16]. Rats were trained for two 1 hour sessions per day, 5 days a week. Rats were initially trained to press a lever in response to the sound ‘dad’ to receive a sugar pellet reward (45 mg, Bio-Serv). When rats reached the performance criteria of a d’ ≥ 1.5 on this sound detection task, they were advanced to a consonant discrimination task. For this first discrimination task, rats were trained to press the lever in response to the target sound ‘dad’, and refrain from pressing the lever in response to the non-target sounds ‘bad’, ‘gad’, ‘sad’, and ‘tad’. 50% of the speech sounds presented were target sounds, and 50% were non-target sounds. Rats performed this consonant discrimination task for 20 days, and then advanced to a vowel discrimination task. For this second discrimination task, rats were trained to press the lever in response to the sound ‘dad’, and refrain from pressing the lever in response to the sounds ‘deed’, ‘dood’, and ‘dud’. Rats performed this vowel discrimination task for 15 days, and then advanced to a speech-in-noise discrimination task. For this third discrimination task, rats were trained to press the lever in response to the sound ‘dad’, and refrain from pressing the lever in response to sounds differing in either consonant or vowel (‘bad’, ‘gad’, ‘sad’, ‘tad’, ‘deed’, ‘dood’, and ‘dud’) in varying levels of background noise. Sounds were presented in blocks of progressively increasing or decreasing background noise levels at each of 5 speech-shaped noise levels: 0, 48, 54, 60, and 72 dB. Rats performed this speech-in-noise discrimination task for 15 days. Rats took an average of 14 ± 0.3 weeks to complete all stages of speech training.
We have previously observed order effects relating to the task difficulty for a similar auditory discrimination task [17]. We found that rats initially trained on a perceptually more difficult task had better behavioral performance on a final common task than rats that were initially trained on a perceptually easier task. For the current study, we first trained rats to discriminate consonant sounds (with high spatiotemporal similarity), then vowel sounds (which are more distinct) in order to have high task performance on the final speech-in-noise task.
2.3 Physiology
Following the last day of speech training, auditory cortex responses to the trained sounds were recorded in 4 auditory fields: AAF, A1, VAF, and PAF. Recordings were obtained from 460 auditory cortex sites in 5 speech trained rats, and 404 auditory cortex sites in 5 experimentally naïve control rats. All recording procedures were identical to our previous studies [1,8,13,16,18]. Rats were anesthetized with sodium pentobarbital (50 mg/kg), and received supplemental dilute pentobarbital (8 mg/mL) throughout the experiment to maintain anesthesia levels. Auditory cortex recording sessions were an average of 15.95 ± 0.73 hours (with a range of 10.5 – 18 hours). Local field potential (0 – 300 Hz) and multiunit responses using 4 simultaneously lowered FHC Parylene-coated tungsten microelectrodes (1.5 – 2.5 MΩ) were obtained from right auditory cortex. Tones, noise burst trains, and speech sounds were presented at each recording site. Tone frequency intensity tuning curves were obtained for each site using 25 ms tones ranging from 1 – 48 kHz in frequency in 0.125 octave steps and 0 – 75 dB in intensity in 5 dB steps. Trains of 6 noise bursts were presented at 4 speeds: 7, 10, 12.5, and 15 Hz. Each of the speech sounds presented during speech training were presented at each site, as well as 3 novel speech sounds (‘chad’, ‘dead’, and ‘shad’) with an average power spectrum that largely overlaps with the power spectrum of the trained sounds (Supplementary Figure 1). Twenty repeats of each noise burst train and speech sound were collected at each auditory cortex recording site.
2.4 Data analysis
Behavioral performance was measured as the percent correct on each of the discrimination tasks. Percent correct is the average of the correct lever press responses following the target sound and the correct rejections following the non-target sounds. The measure d prime (d’) was used to quantify behavioral performance on the speech detection task in order to advance to the consonant discrimination task. A d’ of 1.5 indicates that the rats are reliably pressing the lever to the target sound, while a d’ of 0 indicates that rats are unable to distinguish between target and non-target sounds (Supplementary Figure 2). The measure c was used to quantify response bias, where a positive value indicates a bias against lever pressing, and a negative value indicates a bias towards lever pressing (Supplementary Figure 3) [19]. Repeated measures ANOVAs were used to determine significance.
The local field potential N1, P2, N2, and P3 peak amplitudes and latencies were quantified for each recording site using custom MATLAB software. The response strength to speech sounds was quantified as the driven number of spikes evoked during 1) the first 40 ms of the neural response to the initial consonant and 2) the first 300 ms of the neural response to the vowel [1,3,8,20]. The onset latency to speech sounds was quantified as the latency of the first spike within the 40 ms window after sound onset. Neural discrimination accuracy was determined using a nearest-neighbor classifier to assign a single trial response pattern to the average response pattern that it most closely resembled using the smallest Euclidean distance [1,21]. For consonants, response patterns consisted of the 40 ms neural response to the initial consonant of the trained consonant pairs (‘d’ vs. ‘b’, ‘d’ vs. ‘g’, ‘d’ vs. ‘s’, ‘d’ vs. ‘t’) using 1 ms precision. For vowels, responses consisted of the 300 ms neural response to the vowel of the trained vowel pairs (‘dad’ vs. ‘deed’, ‘dad’ vs. ‘dood’, ‘dad’ vs. ‘dud’) using the mean rate over a 300 ms bin. Neural diversity was quantified by comparing the correlation coefficient (R) between the responses to speech sounds of randomly selected pairs of neurons with similar characteristic frequencies (within ¼ octave), as in previous studies [8,9].
Individual recording sites were assigned to each auditory field using tonotopy, response latency, and response selectivity, as in previous studies [8,22]. The characteristic frequency was defined as the frequency at which a response was evoked at the lowest intensity. Threshold was defined as the lowest intensity that evoked a response at each recording site’s characteristic frequency. Bandwidth was defined as the frequency range that evoked a response at 40 dB above the threshold. The peak latency was defined as the time point with the maximum firing rate. The driven rate was defined as the average number of spikes evoked per tone during the period of time when the population response for each field was significantly greater than spontaneous firing (AAF: 13 – 48 ms; A1: 15 – 60 ms; VAF: 16 – 66 ms; PAF: 26 – 98 ms) [23]. The percent of each cortical field responding was calculated for each tone at each intensity using data from rats with at least 10 recording sites in the field. The firing rate to noise bursts was quantified as the peak firing rate to each noise burst within the 30 ms window after the noise burst onset.
3. Results
3.1 Speech training
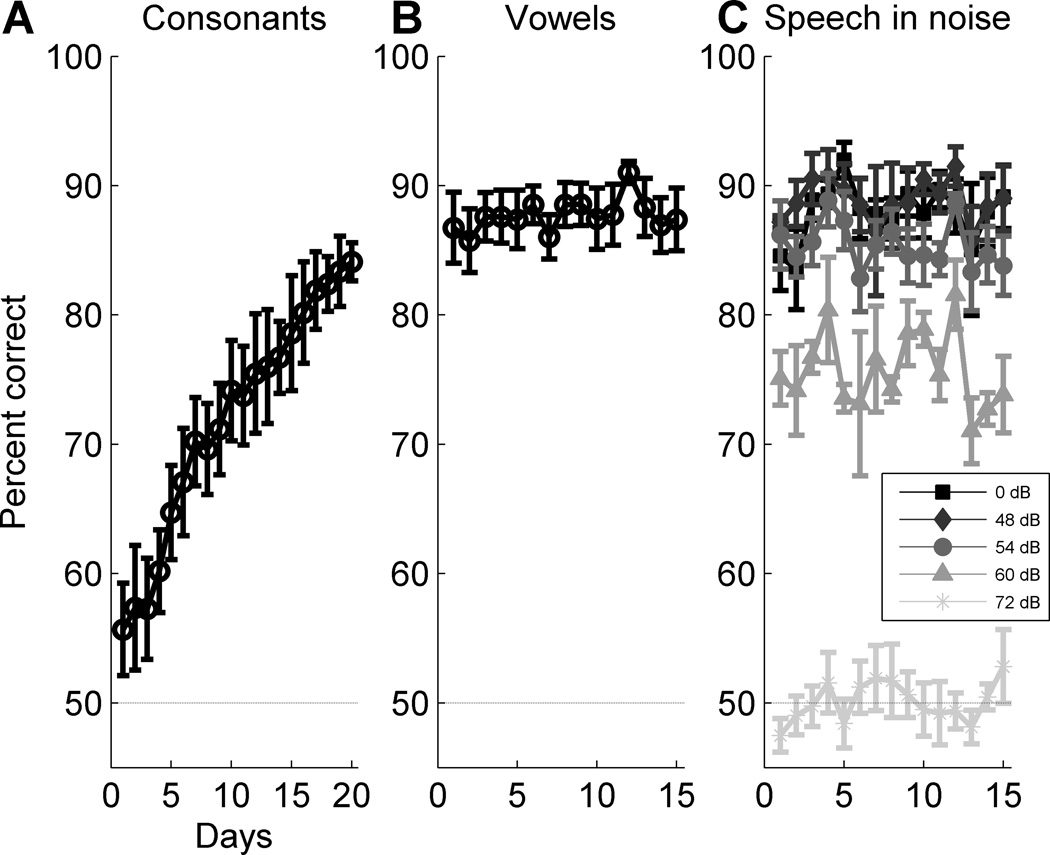
Five rats were trained to discriminate consonant and vowel sounds in quiet and in varying levels of background speech-shaped noise. Rats were first trained on the consonant discrimination task, where they learned to discriminate the target word (‘dad’) from words with a different initial consonant (for example, ‘bad’), and their performance significantly improved over time (F(19, 76) = 20.04, p < 0.0001, one-way repeated measures ANOVA, Figure 1a & Supplementary Figure 2). On the final day of consonant discrimination training, rats were able to discriminate consonant sounds with 84.1 ± 1.5% accuracy. These rats were then trained on a vowel discrimination task, where they learned to discriminate the target word ‘dad’ from words with a different vowel (for example, ‘deed’), and performance on this task did not improve over time (F(14, 56) = 0.59, p = 0.86, one-way repeated measures ANOVA, Figure 1b). On the final day of vowel discrimination training, rats were able to discriminate vowel sounds with 87.4 ± 2.4% accuracy. Rats were next trained to discriminate the target sound from the complete set of sounds that differed in either initial consonant or vowel. During this stage of training, background speech-shaped noise was introduced, and the intensity of background noise was varied across blocks from 0 dB SPL up to 72 dB SPL to ensure that the task remained challenging. As expected from earlier studies, accuracy was significantly impaired with increasing levels of background noise (F(4, 280) = 445.61, p < 0.0001, two-way repeated measures ANOVA, Figure 1c). Rats performed this speech-in-noise task with 89.1 ± 2.4% accuracy on the last day of training in 0 dB of background noise, but only 52.8 ± 2.8% accuracy in 72 dB of background noise, which was not significantly different from chance performance (p = 0.33, Figure 1c).
Figure 1.
Speech training time course. (a) Rats trained on the consonant discrimination task for 20 days. Error bars indicate s.e.m. across rats (n = 5 rats). The dashed line at 50% correct indicates chance performance. (b) Following the consonant discrimination task, rats trained on the vowel discrimination task for 15 days. (c) Following the vowel discrimination task, rats trained on the speech-in-noise discrimination task for 15 days in varying levels of background speech-shaped noise (range of 0 – 72 dB background noise). All speech sounds were presented at 60 dB.
3.2 Neural response to speech sounds following speech training
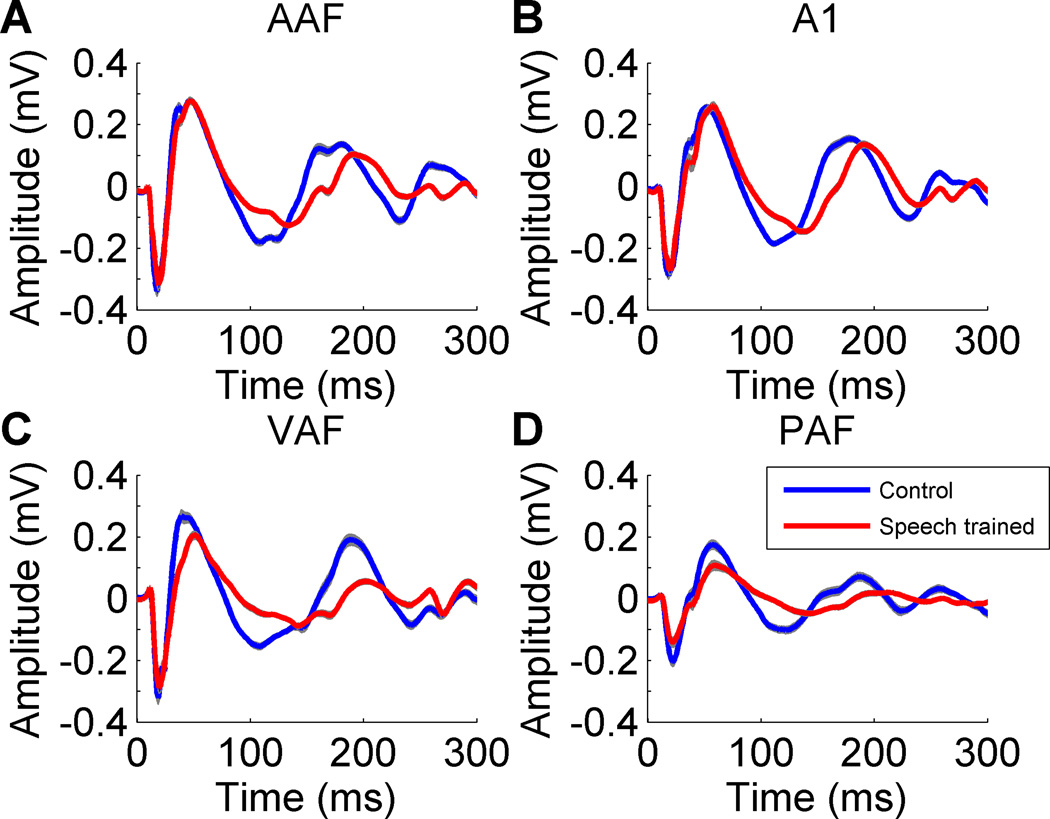
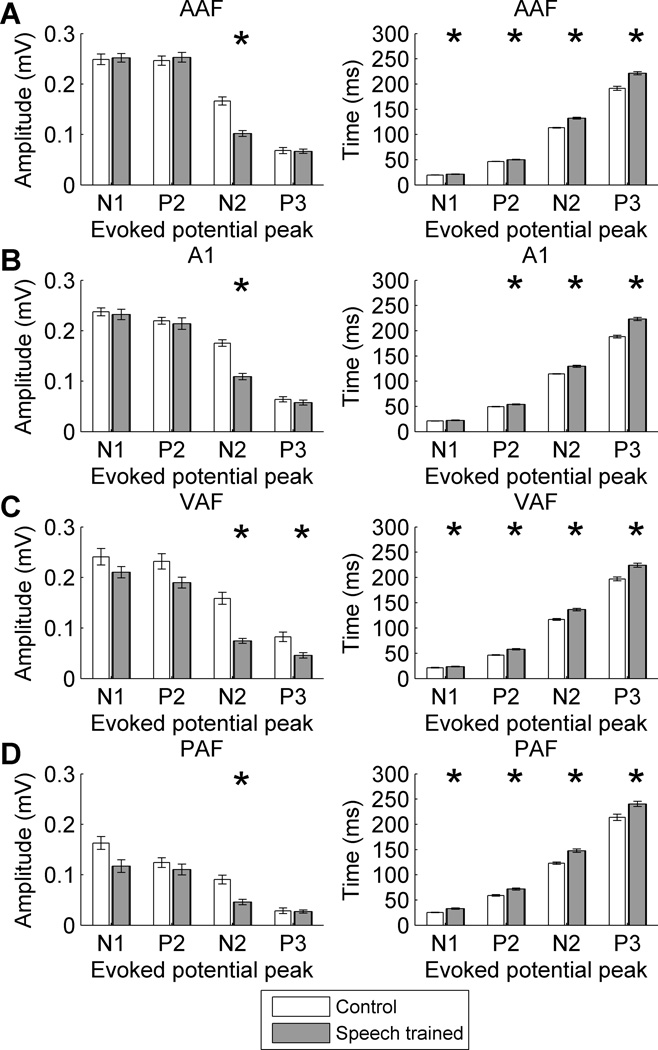
Following the last day of speech training, local field potential and multiunit responses were recorded from four auditory cortical fields: anterior auditory field (AAF), primary auditory cortex (A1), ventral auditory field (VAF), and posterior auditory field (PAF). Previous studies have documented altered auditory evoked potential responses following speech training [24–26]. The local field potential response to speech sounds was both weaker and delayed in each of the auditory fields in speech trained rats compared to control rats. The N1 and P2 component amplitudes were unaltered in each of the four auditory fields in speech trained rats compared to control rats (p > 0.01). The N2 component amplitude was significantly weaker across all four fields in speech trained rats compared to control rats (p < 0.01, Figures 2 & 3). While the P3 potential amplitude was unaltered in AAF, A1, and PAF, this potential was weaker in VAF following speech training (p < 0.01, Figures 2 & 3). Except for the A1 N1 component latency, the latency for the N1, P2, N2, and P3 components of the local field potential were all significantly delayed following speech training in each of the fields (p < 0.01, Figures 2 & 3).
Figure 2.
Speech training altered the local field potential response to the speech sound ‘dad’ in each of the four auditory fields. Speech training altered both the amplitude and latency of the local field potential response in (a) AAF, (b) A1, (c) VAF, and (d) PAF. Gray shading behind each line indicates s.e.m. across recording sites.
Figure 3.
Speech training decreased the amplitude and increased the latency of the local field potential response to speech sounds in each of the four auditory fields. (a) In AAF, the N2 peak amplitude was weaker and the N1, P2, N2, and P3 latencies were longer following speech training. Error bars indicate s.e.m. across recording sites. Stars indicate statistically significant differences between speech trained rats and control rats (p < 0.01). (b) In A1, the N2 peak amplitude was weaker and the P2, N2, and P3 latencies were longer following speech training. (c) In VAF, the P2, N2, and P3 peak amplitudes were weaker and the N1, P2, N2, and P3 latencies were longer following speech training. (d) In PAF, the N1 and N2 peak amplitudes were weaker and the N1, P2, N2, and P3 latencies were longer following speech training.
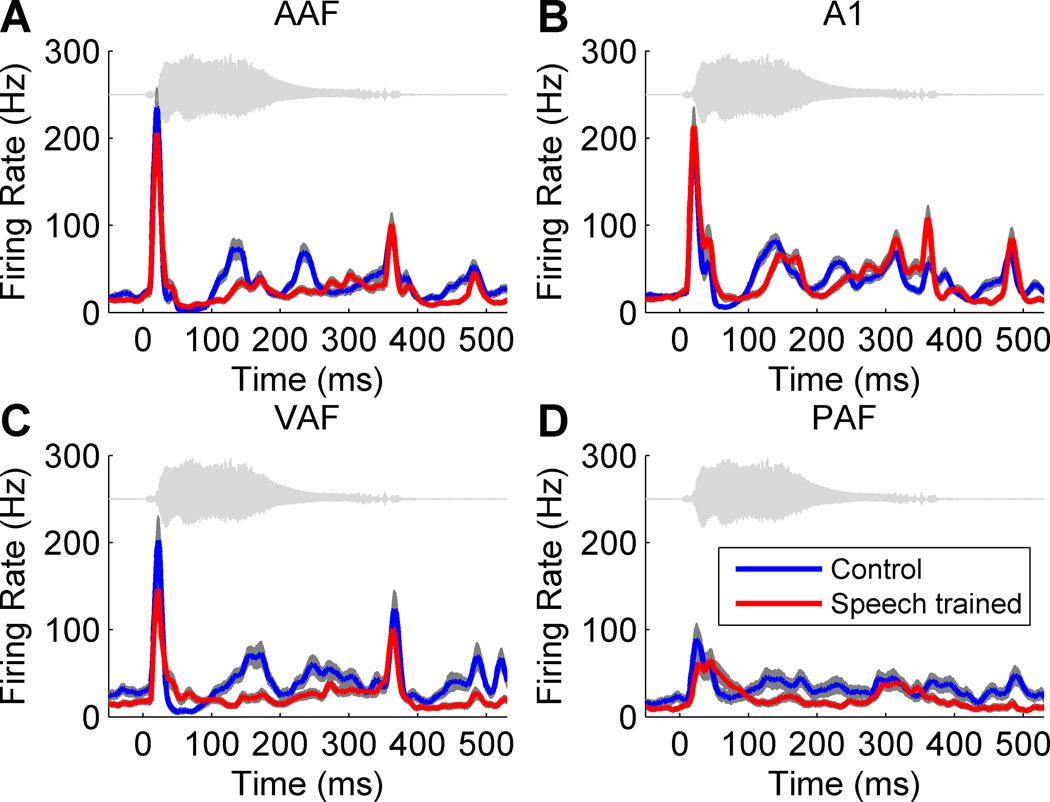
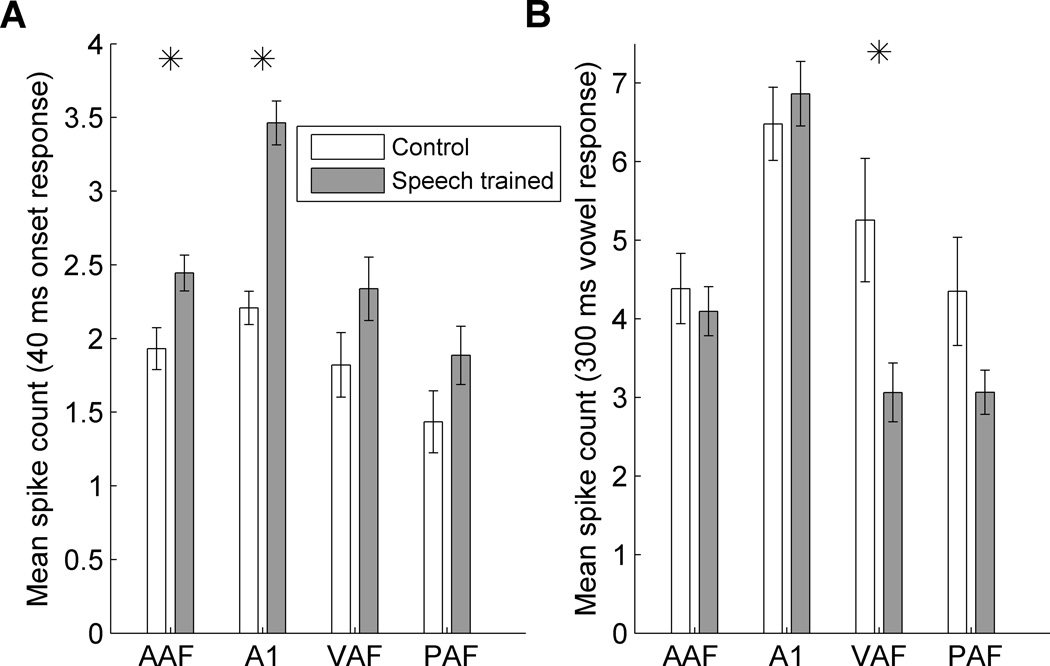
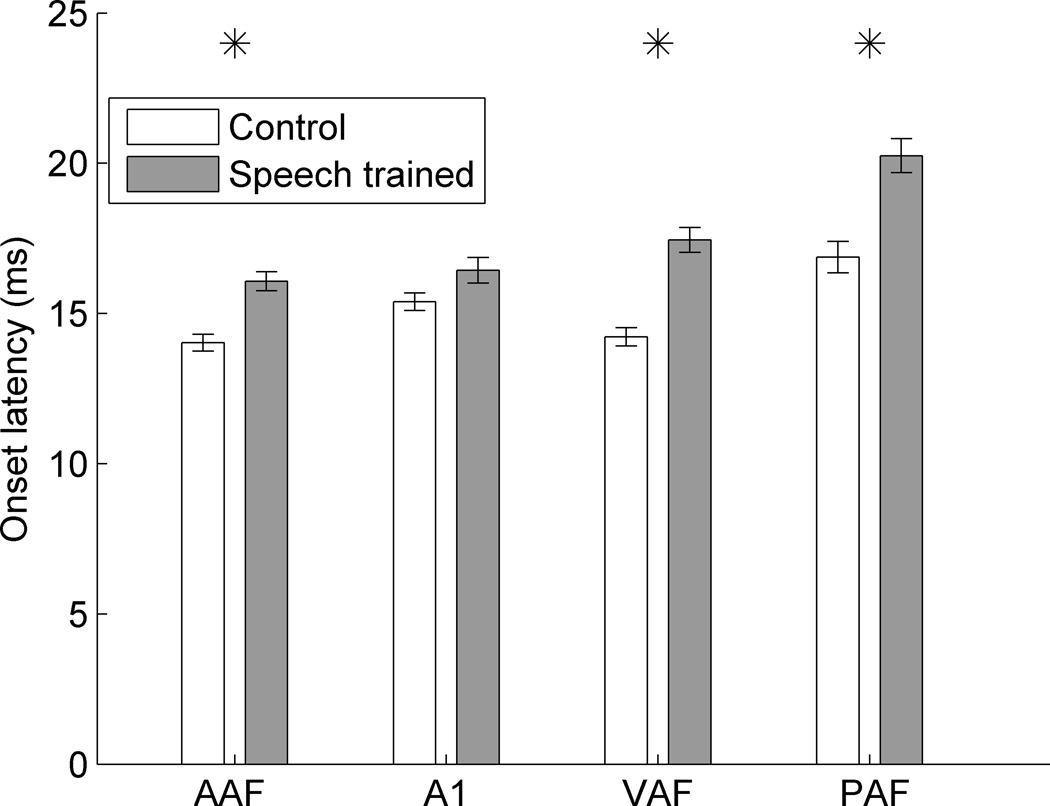
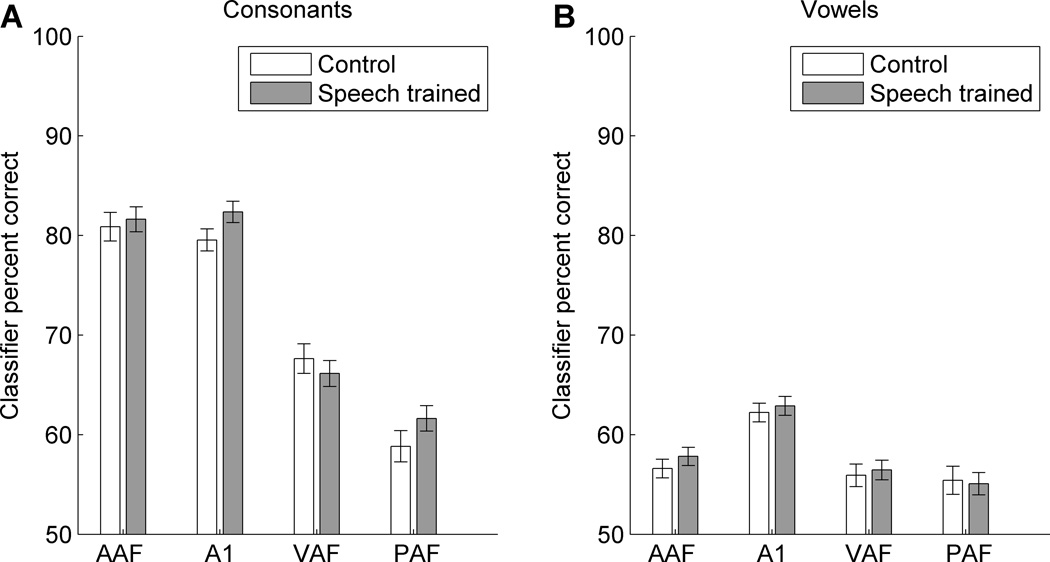
Multiunit responses to speech sounds were also altered following speech training (Figure 4). The number of action potentials (spikes) evoked in response to the initial consonant was increased by 27% in AAF (p = 0.006) and 57% in A1 (p < 0.0001) in speech trained rats compared to control rats (Figure 5a). Training did not alter the number of spikes evoked in response to the initial consonant in VAF or PAF (p > 0.05, Figure 5a). The number of spikes evoked in response to the vowel was not altered in AAF or A1 (p > 0.05, Figure 5b), but was decreased by 42% in VAF (p = 0.005) and 30% in PAF (p = 0.04, Figure 5b). There was no increase in the response to the target sound relative to the non-target sounds in any of the fields (p > 0.05). The onset latency to speech sounds was significantly longer in all non-primary auditory fields following speech training. The onset latency was 2.1 ms slower in AAF (p < 0.0001), 1.1 ms slower in A1 (p = 0.04), 3.2 ms slower in VAF (p < 0.0001), and 3.4 ms slower in PAF (p = 0.0001) in speech trained rats compared to control rats (Figure 6). We hypothesized that alterations in both response strength and response latency could alter the ability of a nearest-neighbor neural classifier to correctly identify which sound was presented. The classifier compared single trial responses to pairs of response templates, and classified each response as belonging to the template that was the most similar. Speech training did not significantly alter neural classifier accuracy in any of the four auditory cortex fields tested (p > 0.05, Figure 7). Speech training altered auditory cortex response strength and latency to speech sounds, but did not result in more discriminable neural patterns of activation.
Figure 4.
The neural response to the target speech sound ‘dad’ in each of the auditory fields. The neural response to ‘dad’ was altered following speech training in (a) AAF, (b) A1, (c) VAF, and (d) PAF. Gray shading behind each line represents s.e.m. across recording sites. The ‘dad’ waveform is plotted above each neural response in gray.
Figure 5.
Speech training altered the number of spikes evoked in response to speech sounds. (a) The number of spikes evoked during the first 40 ms response to the consonant significantly increased in AAF and A1 following speech training. Error bars indicate s.e.m. across recording sites. Stars indicate a statistically significant difference between speech trained and control rats (p < 0.01). (b) The number of spikes evoked during the 300 ms vowel response significantly decreased in VAF and PAF following speech training.
Figure 6.
Speech training altered the response latency to speech sounds. The onset latency was significantly longer in speech trained rats compared to control rats in all four auditory fields. Error bars indicate s.e.m. across recording sites. Stars indicate a statistically significant difference between speech trained and control rats (p < 0.01).
Figure 7.
Neural classifier accuracy was unaltered following speech training. (a) Neural discrimination between pairs of trained consonant sounds (‘dad’ vs. ‘bad’; ‘dad’ vs. ‘gad’; ‘dad’ vs. ‘sad’; ‘dad’ vs. ‘tad’) was not significantly different in speech trained rats compared to control rats in all four auditory fields (p > 0.05). Error bars indicate s.e.m. across recording sites. (b) Neural discrimination between pairs of trained vowel sounds (‘dad’ vs. ‘deed’; ‘dad’ vs. ‘dood’; ‘dad’ vs. ‘dud’) was not significantly different in speech trained rats compared to control rats in all four auditory fields.
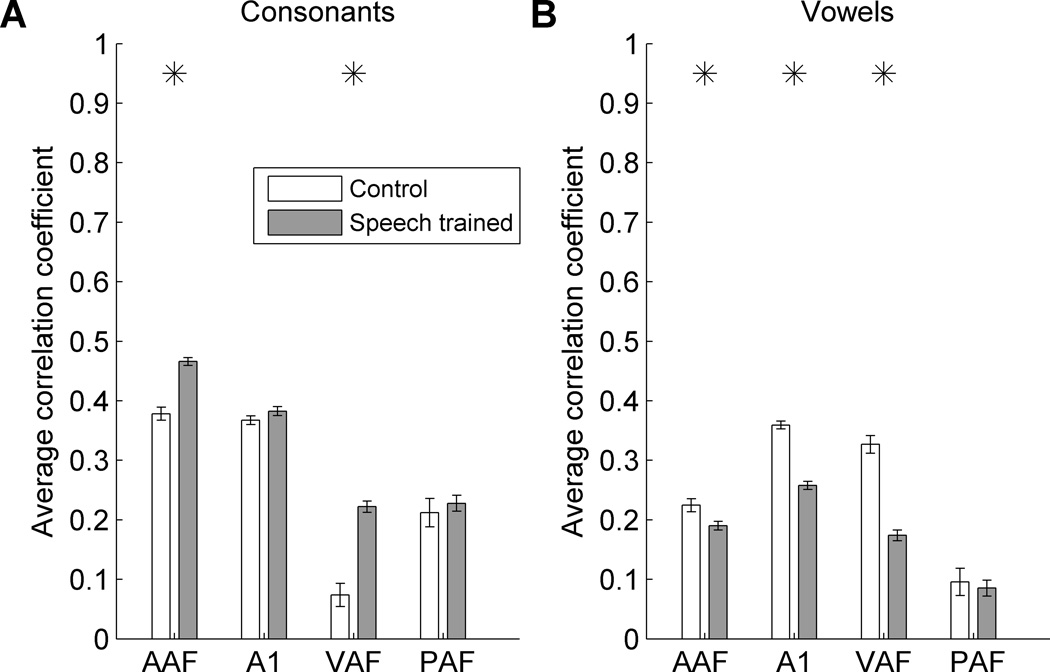
To determine whether speech training altered the diversity of the neural response to speech sounds in each auditory field, the response to each sound was compared between pairs of neurons with characteristic frequencies within ¼ octave of each other (Supplementary Figure 4). Pairs of closely tuned neurons that respond similarly to each speech sound resulted in a high correlation coefficient, while pairs of neurons that respond uniquely resulted in a low correlation coefficient. As in previous studies [8–10], closely tuned pairs of neurons in AAF and A1 in control rats responded similarly to speech sounds, while closely tuned pairs of neurons in VAF and PAF in control rats responded more distinctly to speech sounds (Figure 8a). Following speech training, pairs of closely tuned neurons responded more similarly to consonants in AAF (p < 0.0001) and VAF (p < 0.0001, Figure 8a). This increase in response similarity between pairs of closely tuned neurons was not due to an increased response strength to these sounds (Figure 5a). When only the weakest pairs of neurons were considered to eliminate the training effect on response strength, response similarity between pairs of closely tuned neurons was still significantly increased in AAF, A1, and VAF in speech trained rats compared to control rats (p < 0.001). In contrast, pairs of closely tuned neurons responded significantly more distinctly to vowels following speech training in AAF (p = 0.008), A1 (p < 0.0001), and VAF (p < 0.0001, Figure 8b). In summary, pairs of closely tuned neurons responded with greater redundancy to consonants following speech training, but with greater diversity to vowels following speech training.
Figure 8.
Speech training altered the neural redundancy between pairs of closely tuned neurons. (a) Pairs of closely tuned neurons (with characteristic frequencies within ¼ octave of each other) fired more similarly to consonant sounds following speech training in AAF and VAF. Error bars indicate s.e.m. across recording sites. Stars indicate a statistically significant difference between speech trained and control rats (p < 0.01). (b) Pairs of closely tuned neurons fired more distinctly to vowel sounds following speech training in AAF, A1, and VAF.
3.3 Neural response to non-speech sounds following speech training
Speech training also altered the response to tones in each of the four auditory cortex fields. Across the fields, neurons in speech trained rats responded to quieter tones, responded to a wider range of tone frequencies, and were slower to respond to tones compared to neurons from control rats (Table 1). Speech trained rats had tone response thresholds that were 5.4 dB quieter in AAF (p = 0.0002), 3.8 dB quieter in A1 (p = 0.0008), 6.3 dB quieter in VAF (p = 0.01), and 9.6 dB quieter in PAF (p < 0.0001) compared to control rats (Table 1). Trained rats had tone frequency bandwidths that were 0.5 – 1.1 octaves wider than control rats (p < 0.0005, Table 1). The peak response latency was slower in speech trained rats across all four fields, and was 2.1 ms slower in AAF (p = 0.003), 1.5 ms slower in A1 (p = 0.007), 5.2 ms slower in VAF (p = 0.05), and 10.6 ms slower in PAF (p = 0.0009, Table 1). While the response strength to tones was significantly stronger in A1 following speech training (p < 0.0001, Table 1), the response strength to tones in the other fields was unaltered compared to control rats (p > 0.05).
Table 1.
Speech training altered receptive field properties. Speech training lowered thresholds, widened bandwidths, and increased response latency in all four fields compared to control rats.
| Threshold (dB) |
Bandwidth 40 (octaves) |
Peak latency (ms) |
Driven rate (spikes/tone) |
||
|---|---|---|---|---|---|
| AAF | Control | 15.4 | 3.1 | 17.2 | 1.5 |
| Trained | 10.0* | 3.6* | 19.3* | 1.5 | |
| A1 | Control | 11.0 | 2.7 | 18.5 | 1.6 |
| Trained | 7.2* | 3.4* | 20.0* | 2.0* | |
| VAF | Control | 16.9 | 2.8 | 22.7 | 2.0 |
| Trained | 10.6* | 3.7* | 27.9 | 1.8 | |
| PAF | Control | 19.8 | 3.5 | 28.5 | 1.6 |
| Trained | 10.2* | 4.6* | 39.1* | 2.0 |
Bold numbers marked with a star were significantly different in speech trained rats compared to control rats (p < 0.01).
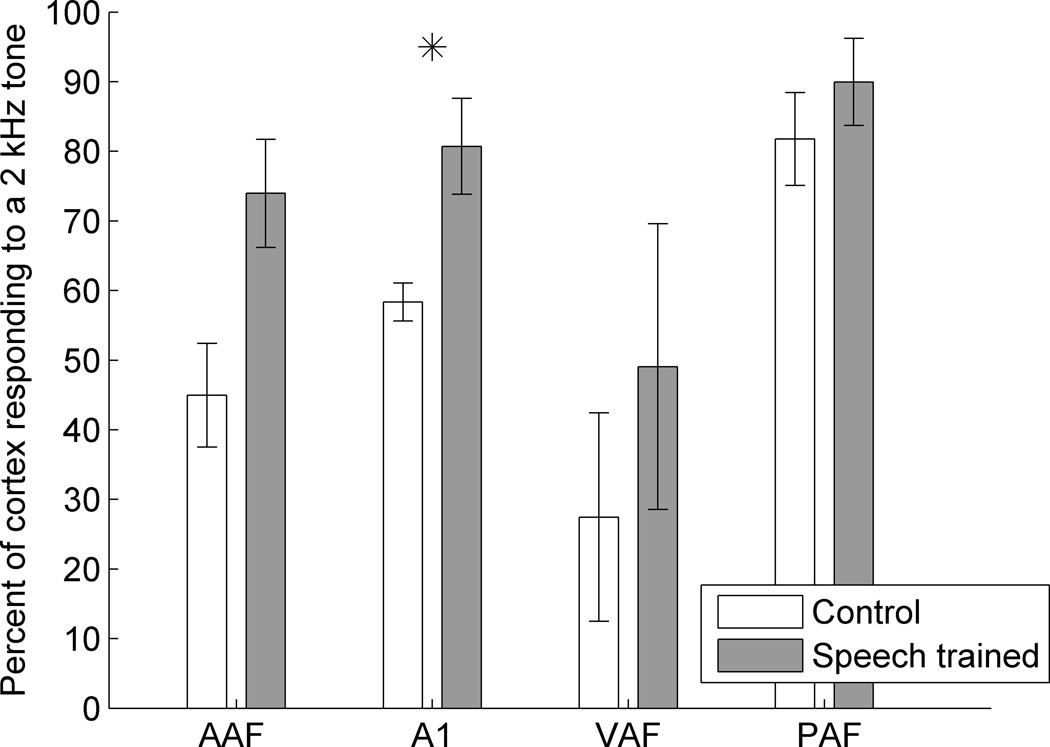
Previous auditory training studies have documented an increase in the percent of auditory cortex responding to the trained sound [4,27,28]. The speech sounds used in this study had a peak in their spectral energy around 2 kHz [4]. Speech trained rats exhibited a 65% increase in the percent of cortex responding to a 2 kHz tone in AAF (p = 0.02), and a 38% increase in the percent responding to a 2 kHz tone in A1 (p = 0.01, Figure 9). VAF and PAF did not have significant changes in the percent of cortex responding to a 2 kHz tone following speech training, but both fields trended towards an increase in the percent of cortex responding (p > 0.05, Figure 9). This increase in the percent of cortex responding was specific to low frequency tones, and no fields exhibited an increase in the percent of cortex responding to a high frequency tone following speech training (p > 0.05, 16 kHz tone presented at 60 dB).
Figure 9.
The percent of cortex responding to a low frequency tone increased following speech training. Speech trained rats had a larger percent of cortex that could respond to a 2 kHz tone in AAF and A1 compared to control rats. Error bars indicate s.e.m. across recording sites. Stars indicate a statistically significant difference between speech trained and control rats (p < 0.01).
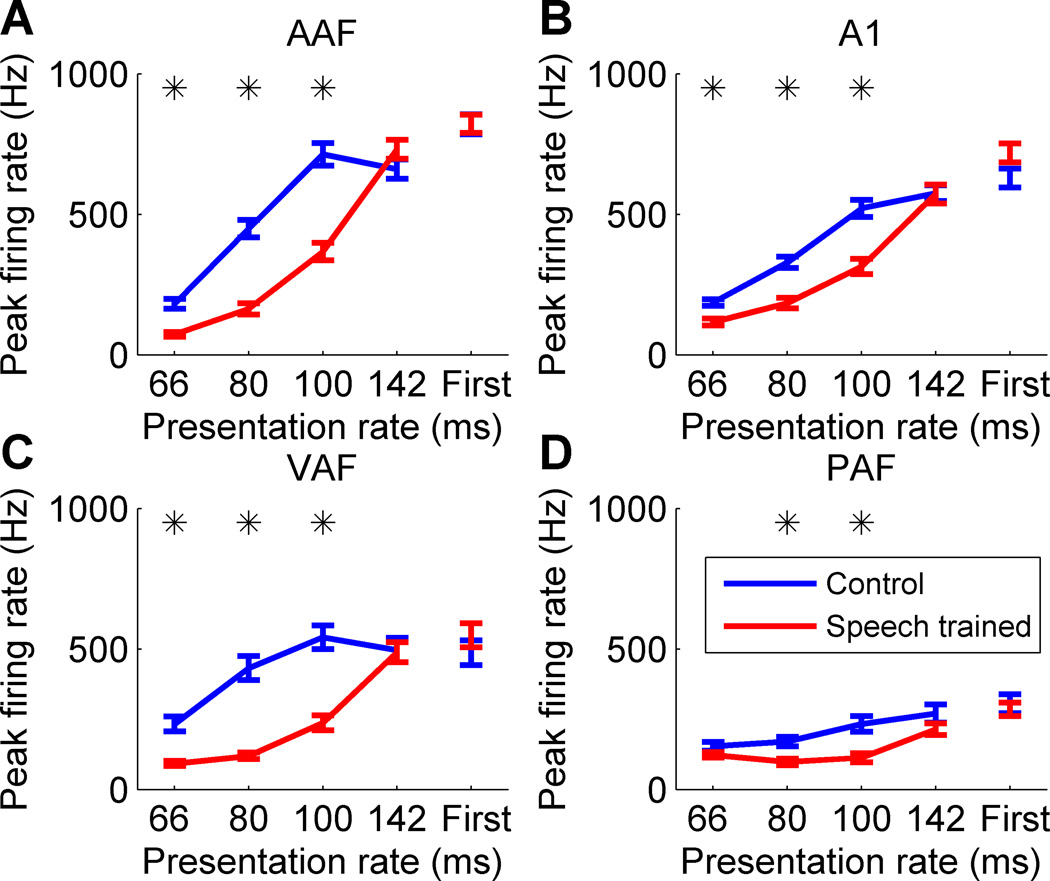
Previous studies have documented alterations in the temporal following rate of auditory cortex neurons following speech training [13,16]. Trains of noise bursts at varying presentation rates were presented to examine whether speech training alters the ability of auditory cortex neurons to follow rapidly presented sounds. The response strength to the first noise burst in the train was unaltered in speech trained rats compared to control rats in each of the four auditory fields (p > 0.05, Figure 10). However, the response strength to the second noise burst in the train was greatly impaired in each of the four fields, particularly at faster presentation rates (p < 0.0005, Figure 10).
Figure 10.
The peak firing rate to the second noise burst in the noise burst train was impaired following speech training in (a) AAF, (b) A1, (c) VAF, and (d) PAF. While the response evoked by the first noise burst in the train was unaltered in each of the fields following speech training (‘First’), the response evoked by the second noise burst in the train was weaker in speech trained rats compared to control rats, particularly at faster presentation rates. Error bars indicate s.e.m. across recording sites. Stars indicate a statistically significant difference between speech trained and control rats (p < 0.0005).
4. Discussion
Previous studies have reported auditory cortex plasticity following speech training. This study extends those findings by documenting that different fields within auditory cortex respond differently to consonant and vowel sounds following speech training. Responses to tones and noise burst trains indicate that receptive field and temporal plasticity appear to explain much of the differential changes that speech training causes between consonant and vowel responses. Trained rats were able to accurately discriminate speech sounds by consonant or vowel, and were still able to discriminate these sounds in the presence of substantial background noise. Speech training enhanced the neural response to consonant onsets in AAF and A1 and reduced the neural response to vowels in VAF and PAF. The response latency to both speech sounds and tones was significantly longer following speech training, and speech trained neurons were unable to follow rapidly presented bursts of noise. After training, a larger fraction of AAF and A1 neurons were tuned to low frequency tones with energy near the peak in the power spectrum of the trained speech sounds. Neurons in all four fields became more sensitive and less selective (lowered threshold and wider bandwidths), which may contribute to the differential plasticity of consonant and vowel responses.
4.1 Receptive field plasticity
Previous studies have documented changes in the frequency tuning of neurons following auditory training. Following training on a fine tone discrimination task, A1 bandwidths are narrower, or more selective [27]. Following training on a speech discrimination task using speech sounds that activate a large frequency range, A1 bandwidths are broader, or less selective [4]. Similarly, rats reared in an environment where they are only exposed to single frequency tone sequences have narrower A1 bandwidths, while rats reared in an environment where they are exposed to a full range of tone frequencies have broader A1 bandwidths [29]. The current study extends these previous findings by showing that bandwidth plasticity is not specific to A1, but is seen consistently across multiple auditory fields following speech training.
This study is consistent with many previous findings documenting frequency specific map plasticity following auditory training [4,27,28,30,31]. For example, monkeys trained to discriminate tones exhibit an increase in the A1 area that responds specifically to the trained tone frequency [27]. This same increase in the cortical area that represents a specific tone following tone training is also observed in other auditory cortex fields [28,30]. Rats trained to discriminate speech sounds that are low-frequency biased exhibit an increase in the percent of A1 responding to low frequency sounds [4]. The current study extends these previous findings by demonstrating that speech training, unlike tone training, results in trained sound specific map plasticity in some auditory fields, but not others. This result suggests that low level acoustic features contribute to the plasticity resulting from speech sound training.
4.2 Consonant and vowel processing
In the current study, rats were trained to discriminate speech sounds by consonant or vowel. This study is consistent with previous studies documenting that both humans and animals can accurately discriminate consonant and vowel sounds [1,3,32,33], even in the presence of substantial levels of background noise [15,34,35]. Following training, AAF and A1 responses to consonants were stronger, while VAF and PAF responses to vowels were weaker. This finding is in agreement with many previous behavioral and physiological studies suggesting that consonants and vowels are processed differently [36–40]. These sounds have distinct neural representations in A1 [3]. Consonants have rapid spectrotemporal acoustic changes that are encoded by precise spike timing, while the spectral characteristics of vowels are encoded by mean spike rate.
4.3 Speech and vocalization sound plasticity
Many studies have documented that discrimination training using acoustically complex sounds, such as human speech or animal vocalization sounds, leads to auditory cortex plasticity [24,26,41]. Typically, speech training results in strengthened auditory cortical evoked potentials. For example, individuals trained to categorize the prevoiced consonant /ba/ exhibit an increased N1-P2 amplitude [24] and an increased P2m amplitude [25] following training. The increased P2m amplitude was localized to anterior auditory cortex, which is where we observed a stronger response strength to consonants following training as well as an increase in the response similarity between closely tuned neurons.
While auditory training-induced plasticity is commonly associated with an increase in the response strength to the trained sounds or an expansion of the representation of the trained sounds, not all studies have documented this. The current study does observe an expansion of the representation of the trained sounds. However, the results are less clear in terms of response strength: while there is a stronger response to the 40 ms onset of the trained sounds in AAF and A1, the N1 and P2 amplitudes are unaltered across the four fields. However, there is a significantly weaker N2 response across each of the fields. In relation to human auditory training studies, there is generally an increase in the N1-P2 amplitude following training, but N2 amplitudes are less often reported [24]. A previous study found that improved auditory discrimination was associated with a decrease of the N2 amplitude over the course of training, which matches our finding [42]. Their result was seen after extensive auditory training occurring daily over 3 months, which is significantly more training than most human auditory training-induced plasticity studies, but is more closely aligned with our study, which involved daily discrimination training sessions lasting 2.5 months (3.5 months including procedural learning). Interestingly, the Cansino study also found both primary and non-primary auditory cortex plasticity. Similar to our finding of strengthened or weakened responses in different fields, previous studies have documented an increased or a decreased response to trained songs in songbirds, depending on which non-primary auditory field the responses are recorded from [11,12]. Although the current study did not observe target sound specific plasticity, it is possible that target specific plasticity occurred at an earlier stage of learning, and was not necessary to maintain accurate task performance [31,43].
Previous studies have demonstrated that the type of training greatly impacts the plasticity observed in auditory cortex. For example, rats trained to discriminate tones by frequency exhibited frequency-specific plasticity, while rats trained to discriminate an identical set of tones by intensity exhibited intensity-specific plasticity [30]. It is possible that we observed an increased response strength to consonants in our study because learning occurred during the consonant task, but not the vowel task. Future research is needed to document the auditory cortex plasticity occurring after each of the tasks in isolation, as well as to document how initial training can or cannot be influenced by later training.
4.4 Plasticity differences between auditory fields
Inactivation and lesion studies suggest that cortical subfields are specialized for different properties of sound. Lesion studies have shown that dorsal and rostral auditory cortex are necessary for accurate discrimination of vowel sounds, although these fields are not necessary for tone discrimination [44]. Deactivation studies have documented that anterior auditory field is necessary for sound pattern discrimination tasks but not sound localization, while posterior auditory field is necessary for sound localization but not sound pattern discrimination [6,7].
Following speech training, each of the auditory fields tested exhibited speech sound plasticity. While AAF and A1 responded stronger to consonant sounds, VAF and PAF responses to consonants were not altered. While VAF and PAF responses to vowel sounds were weaker after training, AAF and A1 responses to vowels were not altered. Previous studies have documented auditory cortex plasticity differences between fields following tone training [28]. Our study supports the growing body of evidence that different cortical subfields are specialized for different aspects of sound, and contribute to the distributed processing of speech [45].
4.5 Mechanisms and relation to clinical populations
After speech training, neurons in all four auditory fields exhibited paired pulse depression, and were unable to keep up with rapidly presented stimuli. This training paradigm may prove useful in conditions with patients with inhibition deficits, such as autism or schizophrenia [46–49]. Additionally, many patient populations have difficulty with speech perception in background noise [50–52]. Following speech in noise training, human subjects exhibit both enhanced speech in noise perception and stronger subcortical responses to speech [53]. While extensive rehabilitation training has also resulted in behavioral and neural improvements in individuals with autism and in a rat model of autism [54–56], future studies are needed to determine how speech training impacts auditory processing in multiple auditory fields in disease models.
Supplementary Material
Each of the auditory fields exhibit speech sound plasticity after speech training
There are differences in plasticity between consonant and vowel sounds
Basic receptive field plasticity in each field may explain these differences
Acknowledgements
We would like to thank Michael Borland and Linda Wilson for assistance with auditory cortex recordings, and Bogdan Bordieanu for assistance with speech training sessions. This research was supported by a grant from the National Institutes of Health to MPK (Grant # R01DC010433).
Footnotes
Publisher's Disclaimer: This is a PDF file of an unedited manuscript that has been accepted for publication. As a service to our customers we are providing this early version of the manuscript. The manuscript will undergo copyediting, typesetting, and review of the resulting proof before it is published in its final citable form. Please note that during the production process errors may be discovered which could affect the content, and all legal disclaimers that apply to the journal pertain.
References
- 1.Engineer CT, Perez CA, Chen YH, Carraway RS, Reed AC, Shetake JA, et al. Cortical activity patterns predict speech discrimination ability. Nat Neurosci. 2008;11:603–608. doi: 10.1038/nn.2109. [DOI] [PMC free article] [PubMed] [Google Scholar]
- 2.Mesgarani N, David SV, Fritz JB, Shamma SA. Phoneme representation and classification in primary auditory cortex. J Acoust Soc Am. 2008;123:899. doi: 10.1121/1.2816572. [DOI] [PubMed] [Google Scholar]
- 3.Perez CA, Engineer CT, Jakkamsetti V, Carraway RS, Perry MS, Kilgard MP. Different timescales for the neural coding of consonant and vowel sounds. Cereb Cortex. 2013;23:670–683. doi: 10.1093/cercor/bhs045. [DOI] [PMC free article] [PubMed] [Google Scholar]
- 4.Engineer CT, Perez CA, Carraway RS, Chang KQ, Roland JL, Kilgard MP. Speech training alters tone frequency tuning in rat primary auditory cortex. Behav Brain Res. 2014;258:166–178. doi: 10.1016/j.bbr.2013.10.021. [DOI] [PMC free article] [PubMed] [Google Scholar]
- 5.Callan DE, Tajima K, Callan AM, Kubo R, Masaki S, Akahane-Yamada R. Learning-induced neural plasticity associated with improved identification performance after training of a difficult second-language phonetic contrast. Neuroimage. 2003;19:113–124. doi: 10.1016/s1053-8119(03)00020-x. [DOI] [PubMed] [Google Scholar]
- 6.Ahveninen J, Huang S, Nummenmaa A, Belliveau JW, Hung A-Y, Jääskeläinen IP, et al. Evidence for distinct human auditory cortex regions for sound location versus identity processing. Nat Commun. 2013;4:2585. doi: 10.1038/ncomms3585. [DOI] [PMC free article] [PubMed] [Google Scholar]
- 7.Lomber SG, Malhotra S. Double dissociation of “what” and “where” processing in auditory cortex. Nat Neurosci. 2008;11:609–616. doi: 10.1038/nn.2108. [DOI] [PubMed] [Google Scholar]
- 8.Centanni TM, Engineer CT, Kilgard MP. Cortical speech-evoked response patterns in multiple auditory fields are correlated with behavioral discrimination ability. J Neurophysiol. 2013;110:177–189. doi: 10.1152/jn.00092.2013. [DOI] [PMC free article] [PubMed] [Google Scholar]
- 9.Ranasinghe KG, Vrana WA, Matney CJ, Kilgard MP. Increasing diversity of neural responses to speech sounds across the central auditory pathway. Neuroscience. 2013 doi: 10.1016/j.neuroscience.2013.08.005. [DOI] [PMC free article] [PubMed] [Google Scholar]
- 10.Chechik G, Anderson MJ, Bar-Yosef O, Young ED, Tishby N, Nelken I. Reduction of information redundancy in the ascending auditory pathway. Neuron. 2006;51:359–368. doi: 10.1016/j.neuron.2006.06.030. [DOI] [PubMed] [Google Scholar]
- 11.Gentner TQ, Margoliash D. Neuronal populations and single cells representing learned auditory objects. Nature. 2003;424:669–674. doi: 10.1038/nature01731. [DOI] [PMC free article] [PubMed] [Google Scholar]
- 12.Thompson JV, Gentner TQ. Song recognition learning and stimulus-specific weakening of neural responses in the avian auditory forebrain. J Neurophysiol. 2010;103:1785–1797. doi: 10.1152/jn.00885.2009. [DOI] [PMC free article] [PubMed] [Google Scholar]
- 13.Engineer CT, Centanni TM, Im KW, Kilgard MP. Speech sound discrimination training improves auditory cortex responses in a rat model of autism. Front Syst Neurosci. 2014 doi: 10.3389/fnsys.2014.00137. [DOI] [PMC free article] [PubMed] [Google Scholar]
- 14.Kawahara H. Speech representation and transformation using adaptive interpolation of weighted spectrum: Vocoder revisited. Proc ICASSP. 1997;2:1303–1306. [Google Scholar]
- 15.Shetake JA, Wolf JT, Cheung RJ, Engineer CT, Ram SK, Kilgard MP. Cortical activity patterns predict robust speech discrimination ability in noise. Eur J Neurosci. 2011;34:1823–1838. doi: 10.1111/j.1460-9568.2011.07887.x. [DOI] [PMC free article] [PubMed] [Google Scholar]
- 16.Centanni TM, Chen F, Booker AM, Engineer CT, Sloan AM, Rennaker RL, et al. Speech sound processing deficits and training-induced neural plasticity in rats with dyslexia gene knockdown. PLoS One. 2014;9:e98439. doi: 10.1371/journal.pone.0098439. [DOI] [PMC free article] [PubMed] [Google Scholar]
- 17.Engineer ND, Engineer CT, Reed AC, Pandya PK, Jakkamsetti V, Moucha R, et al. Inverted-U function relating cortical plasticity and task difficulty. Neuroscience. 2012;205:81–90. doi: 10.1016/j.neuroscience.2011.12.056. [DOI] [PMC free article] [PubMed] [Google Scholar]
- 18.Engineer CT, Centanni TM, Im KW, Borland MS, Moreno NA, Carraway RS, et al. Degraded auditory processing in a rat model of autism limits the speech representation in non-primary auditory cortex. Dev Neurobiol. 2014;74:972–986. doi: 10.1002/dneu.22175. [DOI] [PMC free article] [PubMed] [Google Scholar]
- 19.Stanislaw H, Todorov N. Calculation of signal detection theory measures. Behav Res Methods Instrum Comput. 1999;31:137–149. doi: 10.3758/bf03207704. [DOI] [PubMed] [Google Scholar]
- 20.Ranasinghe KG, Vrana WA, Matney CJ, Kilgard MP. Increasing diversity of neural responses to speech sounds across the central auditory pathway. Neuroscience. 2013;252:80–97. doi: 10.1016/j.neuroscience.2013.08.005. [DOI] [PMC free article] [PubMed] [Google Scholar]
- 21.Foffani G, Moxon KA. PSTH-based classification of sensory stimuli using ensembles of single neurons. J Neurosci Methods. 2004;135:107–120. doi: 10.1016/j.jneumeth.2003.12.011. [DOI] [PubMed] [Google Scholar]
- 22.Polley DB, Read HL, Storace DA, Merzenich MM. Multiparametric auditory receptive field organization across five cortical fields in the albino rat. J Neurophysiol. 2007;97:3621–3638. doi: 10.1152/jn.01298.2006. [DOI] [PubMed] [Google Scholar]
- 23.Pandya PK, Rathbun DL, Moucha R, Engineer ND, Kilgard MP. Spectral and temporal processing in rat posterior auditory cortex. Cereb Cortex. 2008;18:301–314. doi: 10.1093/cercor/bhm055. [DOI] [PMC free article] [PubMed] [Google Scholar]
- 24.Tremblay K, Kraus N, McGee T, Ponton C, Otis B. Central auditory plasticity: changes in the N1-P2 complex after speech-sound training. Ear Hear. 2001;22:79–90. doi: 10.1097/00003446-200104000-00001. [DOI] [PubMed] [Google Scholar]
- 25.Ross B, Jamali S, Tremblay KL. Plasticity in neuromagnetic cortical responses suggests enhanced auditory object representation. BMC Neurosci. 2013;14:151. doi: 10.1186/1471-2202-14-151. [DOI] [PMC free article] [PubMed] [Google Scholar]
- 26.Talebi H, Moossavi A, Lotfi Y, Faghihzadeh S. Effects of Vowel Auditory Training on Concurrent Speech Segregation in Hearing Impaired Children. Ann Otol Rhinol Laryngol. 2014 doi: 10.1177/0003489414540604. [DOI] [PubMed] [Google Scholar]
- 27.Recanzone GH, Schreiner CE, Merzenich MM. Plasticity in the frequency representation of primary auditory cortex following discrimination training in adult owl monkeys. J Neurosci. 1993;13:87–103. doi: 10.1523/JNEUROSCI.13-01-00087.1993. [DOI] [PMC free article] [PubMed] [Google Scholar]
- 28.Takahashi H, Yokota R, Funamizu A, Kose H, Kanzaki R. Learning-stage-dependent, field-specific, map plasticity in the rat auditory cortex during appetitive operant conditioning. Neuroscience. 2011;199:243–258. doi: 10.1016/j.neuroscience.2011.09.046. [DOI] [PubMed] [Google Scholar]
- 29.Köver H, Gill K, Tseng Y-TL, Bao S. Perceptual and neuronal boundary learned from higher-order stimulus probabilities. J Neurosci. 2013;33:3699–3705. doi: 10.1523/JNEUROSCI.3166-12.2013. [DOI] [PMC free article] [PubMed] [Google Scholar]
- 30.Polley DB, Steinberg EE, Merzenich MM. Perceptual learning directs auditory cortical map reorganization through top-down influences. J Neurosci. 2006;26:4970–4982. doi: 10.1523/JNEUROSCI.3771-05.2006. [DOI] [PMC free article] [PubMed] [Google Scholar]
- 31.Reed AC, Riley J, Carraway RS, Carrasco A, Perez CA, Jakkamsetti V, et al. Cortical map plasticity improves learning but is not necessary for improved performance. Neuron. 2011;70:121–131. doi: 10.1016/j.neuron.2011.02.038. [DOI] [PubMed] [Google Scholar]
- 32.Reed P, Howell P, Sackin S, Pizzimenti L, Rosen S. Speech perception in rats: use of duration and rise time cues in labeling of affricate/fricative sounds. J Exp Anal Behav. 2003;80:205–215. doi: 10.1901/jeab.2003.80-205. [DOI] [PMC free article] [PubMed] [Google Scholar]
- 33.De la Mora DM, Toro JM. Rule learning over consonants and vowels in a non-human animal. Cognition. 2013;126(2):307–312. doi: 10.1016/j.cognition.2012.09.015. [DOI] [PMC free article] [PubMed] [Google Scholar]
- 34.Miller GA, Nicely PE. An Analysis of Perceptual Confusions Among Some English Consonants. J Acoust Soc Am. 1955;27:338–352. [Google Scholar]
- 35.Phatak SA, Lovitt A, Allen JB. Consonant confusions in white noise. J Acoust Soc Am. 2008;124:1220–1233. doi: 10.1121/1.2913251. [DOI] [PubMed] [Google Scholar]
- 36.Pisoni DB. Auditory and phonetic memory codes in the discrimination of consonants and vowels. Percept Psychophys. 1973;13:253–260. doi: 10.3758/BF03214136. [DOI] [PMC free article] [PubMed] [Google Scholar]
- 37.Caramazza A, Chialant D, Capasso R, Miceli G. Separable processing of consonants and vowels. Nature. 2000;403:428–430. doi: 10.1038/35000206. [DOI] [PubMed] [Google Scholar]
- 38.Boatman D, Hall C, Goldstein MH, Lesser R, Gordon B. Neuroperceptual differences in consonant and vowel discrimination: as revealed by direct cortical electrical interference. Cortex. 1997;33:83–98. doi: 10.1016/s0010-9452(97)80006-8. [DOI] [PubMed] [Google Scholar]
- 39.Poeppel D. The analysis of speech in different temporal integration windows: cerebral lateralization as “asymmetric sampling in time”. Speech Commun. 2003;41:245–255. [Google Scholar]
- 40.Obleser J, Leaver AM, Vanmeter J, Rauschecker JP. Segregation of vowels and consonants in human auditory cortex: evidence for distributed hierarchical organization. Front Psychol. 2010;1:232. doi: 10.3389/fpsyg.2010.00232. [DOI] [PMC free article] [PubMed] [Google Scholar]
- 41.Schnupp JW, Hall TM, Kokelaar RF, Ahmed B. Plasticity of temporal pattern codes for vocalization stimuli in primary auditory cortex. J Neurosci. 2006;26:4785–4795. doi: 10.1523/JNEUROSCI.4330-05.2006. [DOI] [PMC free article] [PubMed] [Google Scholar]
- 42.Cansino S, Williamson SJ. Neuromagnetic fields reveal cortical plasticity when learning an auditory discrimination task. Brain Res. 1997;764:53–66. doi: 10.1016/s0006-8993(97)00321-1. [DOI] [PubMed] [Google Scholar]
- 43.Atienza M, Cantero JL, Dominguez-Marin E. The time course of neural changes underlying auditory perceptual learning. Learn Mem. 2002;9:138–150. doi: 10.1101/lm.46502. [DOI] [PMC free article] [PubMed] [Google Scholar]
- 44.Kudoh M, Nakayama Y, Hishida R, Shibuki K. Requirement of the auditory association cortex for discrimination of vowel-like sounds in rats. Neuroreport. 2006;17:1761–1766. doi: 10.1097/WNR.0b013e32800fef9d. [DOI] [PubMed] [Google Scholar]
- 45.Porter BA, Rosenthal TR, Ranasinghe KG, Kilgard MP. Discrimination of brief speech sounds is impaired in rats with auditory cortex lesions. Behav Brain Res. 2011;219:68–74. doi: 10.1016/j.bbr.2010.12.015. [DOI] [PMC free article] [PubMed] [Google Scholar]
- 46.Braff DL, Geyer MA. Sensorimotor gating and schizophrenia. Human and animal model studies. Arch Gen Psychiatry. 1990;47:181–188. doi: 10.1001/archpsyc.1990.01810140081011. [DOI] [PubMed] [Google Scholar]
- 47.Siegel C, Waldo M, Mizner G, Adler LE, Freedman R. Deficits in sensory gating in schizophrenic patients and their relatives. Evidence obtained with auditory evoked responses. Arch Gen Psychiatry. 1984;41:607–612. doi: 10.1001/archpsyc.1984.01790170081009. [DOI] [PubMed] [Google Scholar]
- 48.Perry W, Minassian A, Lopez B, Maron L, Lincoln A. Sensorimotor gating deficits in adults with autism. Biol Psychiatry. 2007;61:482–486. doi: 10.1016/j.biopsych.2005.09.025. [DOI] [PubMed] [Google Scholar]
- 49.Frankland PW, Wang Y, Rosner B, Shimizu T, Balleine BW, Dykens EM, et al. Sensorimotor gating abnormalities in young males with fragile X syndrome and Fmr1-knockout mice. 2004 doi: 10.1038/sj.mp.4001432. [DOI] [PubMed] [Google Scholar]
- 50.Anderson S, Kraus N. Sensory-cognitive interaction in the neural encoding of speech in noise: a review. J Am Acad Audiol. 2010;21:575–585. doi: 10.3766/jaaa.21.9.3. [DOI] [PMC free article] [PubMed] [Google Scholar]
- 51.Russo N, Zecker S, Trommer B, Chen J, Kraus N. Effects of background noise on cortical encoding of speech in autism spectrum disorders. J Autism Dev Disord. 2009;39:1185–1196. doi: 10.1007/s10803-009-0737-0. [DOI] [PMC free article] [PubMed] [Google Scholar]
- 52.Alcantara JI, Weisblatt EJ, Moore BC, Bolton PF. Speech-in-noise perception in high-functioning individuals with autism or Asperger’s syndrome. J Child Psychol Psychiatry. 2004;45:1107–1114. doi: 10.1111/j.1469-7610.2004.t01-1-00303.x. [DOI] [PubMed] [Google Scholar]
- 53.Song JH, Skoe E, Banai K, Kraus N. Training to improve hearing speech in noise: biological mechanisms. Cereb Cortex. 2012;22:1180–1190. doi: 10.1093/cercor/bhr196. [DOI] [PMC free article] [PubMed] [Google Scholar]
- 54.Dawson G, Rogers S, Munson J, Smith M, Winter J, Greenson J, et al. Randomized, controlled trial of an intervention for toddlers with autism: the Early Start Denver Model. Pediatrics. 2010;125:e17–e23. doi: 10.1542/peds.2009-0958. [DOI] [PMC free article] [PubMed] [Google Scholar]
- 55.Dawson G, Jones EJH, Merkle K, Venema K, Lowy R, Faja S, et al. Early behavioral intervention is associated with normalized brain activity in young children with autism. J Am Acad Child Adolesc Psychiatry. 2012;51:1150–1159. doi: 10.1016/j.jaac.2012.08.018. [DOI] [PMC free article] [PubMed] [Google Scholar]
- 56.Engineer CT, Centanni TM, Im KW, Kilgard MP. Speech sound discrimination training improves auditory cortex responses in a rat model of autism. Front Syst Neurosci. 2014;8:137. doi: 10.3389/fnsys.2014.00137. [DOI] [PMC free article] [PubMed] [Google Scholar]
Associated Data
This section collects any data citations, data availability statements, or supplementary materials included in this article.


