

Background: The RAG1-RAG2 interaction is critical for V(D)J recombination but is poorly understood.
Results: The RAG1-RAG2 interaction has a binding constant of ∼0.4 μm and requires only a small portion of RAG1.
Conclusion: RAG1 and RAG2 interact with modest affinity using regions of RAG1 flanking the RAG1 catalytic region.
Significance: Inefficient association of RAG1 with RAG2 could help limit damage to the genome.
Keywords: Amino Acid, Biosensor, DNA Recombination, Protein Structure, Protein-Protein Interaction, DNA Cleavage, RAG1, RAG2, V(D)J Recombination
Abstract
The RAG endonuclease consists of RAG1, which contains the active site for DNA cleavage, and RAG2, an accessory factor whose interaction with RAG1 is critical for catalytic function. How RAG2 activates RAG1 is not understood. Here, we used biolayer interferometry and pulldown assays to identify regions of RAG1 necessary for interaction with RAG2 and to measure the RAG1-RAG2 binding affinity (KD ∼0.4 μm) (where RAG1 and RAG2 are recombination activating genes 1 or 2). Using the Hermes transposase as a guide, we constructed a 36-kDa “mini” RAG1 capable of interacting robustly with RAG2. Mini-RAG1 consists primarily of the catalytic center and the residues N-terminal to it, but it lacks a zinc finger region in RAG1 previously implicated in binding RAG2. The ability of Mini-RAG1 to interact with RAG2 depends on a predicted α-helix (amino acids 997–1008) near the RAG1 C terminus and a region of RAG1 from amino acids 479 to 559. Two adjacent acidic amino acids in this region (Asp-546 and Glu-547) are important for both the RAG1-RAG2 interaction and recombination activity, with Asp-546 of particular importance. Structural modeling of Mini-RAG1 suggests that Asp-546/Glu-547 lie near the predicted 997-1008 α-helix and components of the active site, raising the possibility that RAG2 binding alters the structure of the RAG1 active site. Quantitative Western blotting allowed us to estimate that mouse thymocytes contain on average ∼1,800 monomers of RAG1 and ∼15,000 molecules of RAG2, implying that nuclear concentrations of RAG1 and RAG2 are below the KD value for their interaction, which could help limit off-target RAG activity.
Introduction
RAG1 and RAG2 (known collectively as RAG; where RAG1 and RAG2 are the proteins encoded by the recombination activating genes 1 or 2) are the critical lymphocyte-specific proteins required for V(D)J recombination, which assembles the variable regions of immunoglobulin and T cell receptor genes in developing B and T lymphocytes. The RAG1-RAG2 complex, together with an architectural DNA binding/bending factor HMGB1 (or HMGB2; where HMGB1 and -2 are high mobility group proteins B1 and B2), initiates V(D)J recombination by binding to a DNA recognition motif known as the recombination signal sequence (RSS).3 The RSS is composed of conserved heptamer and nonamer motifs separated by a poorly conserved spacer whose length is 12 or 23 bp, resulting in two forms of the RSS known as the 12RSS and 23RSS. Efficient V(D)J recombination takes place only between a 12RSS and a 23RSS, a restriction known as the 12/23 rule. After binding to one RSS, the RAG-HMGB1 complex captures a 12/23 appropriate partner RSS to form the paired complex, within which RAG catalyzes the formation of DNA double strand breaks immediately adjacent to the heptamers of the RSSs. DNA cleavage occurs in two steps, with one strand nicked to create a 3′-hydroxyl group, which then attacks the opposite strand to create a hairpin sealed flank and a blunt RSS end. The reaction is completed by the action of ubiquitously expressed DNA repair proteins (1–3).
RAG1 is the major player in DNA binding and cleavage. Its “core” region (the minimal portion required for activity; defined as aa 384–1008 of the 1040-aa protein (4)) contains a tightly dimeric nonamer binding domain (NBD), a central region containing two critical active site residues (Asp-600 and Asp-708), and a large C-terminal region that contributes the third essential active site residue (Glu-962) (Fig. 1A). In addition to making direct contact with the nonamer, the RAG1 core is responsible for heptamer recognition, interaction with RAG2, and is likely to contain the entire active site (2, 5). Nonetheless, it displays no catalytic activity in vitro in the absence of RAG2, and RAG2-deficient mice display a complete absence of V(D)J recombination activity (6). RAG2 is thus a vital accessory factor, with a core region (aa 1–383 of the 527 aa protein; Fig. 1A) whose primary function appears to interact with RAG1, thereby activating RAG1 endonuclease function. This interaction has also been demonstrated to enhance RSS recognition, particularly in the vicinity of the heptamer, and to decrease nonspecific DNA binding by RAG1 (7, 8). The mechanism by which the RAG2 core alters the DNA binding and catalytic functions of RAG1 core is not known, although it is widely speculated to be the result of a RAG2-induced conformational change in RAG1. The non-core regions of RAG1 and RAG2, although not required for catalytic activity or V(D)J recombination, play important roles in vivo and contain multiple regulatory domains, some of which mediate chromatin interactions (9).
FIGURE 1.

Zinc finger B is not required for the RAG1-RAG2 interaction. A, schematic diagram of RAG1 and RAG2 proteins. RING+ZFA, RING finger plus zinc finger A; NBD, nonamer binding domain; ZFB, zinc finger B; PHD, plant homeodomain. Numbers refer to aa in the mouse RAG proteins. B, diagram of MBP-tagged R1c proteins used in in vivo and in vitro GST pulldown experiments. 5GS, five repeats of Gly-Ser. C, in vitro GST pulldown experiment. GST or GST-R2c was used to pull down MBP-tagged R1c proteins as indicated below the lanes, with the results revealed by Western blotting with the indicated antibodies. Data are representative of two experiments. D, in vivo GST pulldown experiment. GST or GST-R2c was used to pull down MBP-tagged R1c proteins as indicated below the lanes from whole cell extracts of transfected HEK293T cells, with the results revealed by Western blotting with the indicated antibodies. Data are representative of four experiments. E, biolayer interferometry (BLItz) sensorgrams obtained using GST-R2c-loaded biosensors and a 20 μm solution of WT or ZFB-deleted R1c proteins, with red dotted lines indicating the start of the binding (left) and dissociation (right) phases. F, sensorgrams obtained using biosensors loaded with MBP-tagged WT and ZFB-double cysteine mutant (Cys-M) R1c proteins, incubated with different concentrations of MBP-R2c, as indicated, were used as analysts and generated a series of sensorgrams. Binding curves were fit globally to a 1:1 binding model to yield equilibrium dissociation constant (KD), and association (ka) and dissociation (kd) rate constants. G, in vivo V(D)J recombination assay of R1c and Cys-M. Diagram of the starting and recombined substrates is shown with RSSs (triangles), coding flanks (rectangles), and PCR primers (arrows) indicated. The upper (755 bp) and lower (350 bp) bands in the agarose gel analysis are the products from the unrecombined and recombined substrates, respectively. FLR1 and FLR2, full-length RAG1 and RAG2, respectively. Data are representative of four experiments.
The only high resolution structural information available for either RAG core region is for the RAG1 NBD in complex with the nonamer (10). Sequence analysis, modeling, and mutagenesis suggest that the RAG2 core adopts a six-bladed β-propeller structure (11, 12). The minimal functional RAG complex is likely to be a heterotetramer consisting of a tight RAG1 dimer bound to two monomers of RAG2 (2, 5).
RAG exhibits striking functional similarities with cut and paste transposases such as those encoded by Tn5, Tn10, Transib, and Hermes. The similarities include a nick-hairpin mechanism of DNA cleavage, a similar active site architecture (resembling the RNase H fold) containing a glutamate and two aspartate catalytic residues, and the ability of the RAG core proteins to mediate transposition efficiently in vitro (13). The Transib and Hermes transposases are of particular interest because they cleave DNA with a similar polarity to RAG (leaving hairpins on the flanking DNA rather than on the terminal inverted repeat ends of the transposon) (14, 15) and, like RAG, have an extended region of amino acids (the insertion domain) separating the active site glutamate from the second active site aspartate (Fig. 1A). The structure of Hermes transposase has been determined alone (16) and in complex with DNA (17), and it provides potential structural parallels with the RAG1 core.
The region of RAG1 responsible for interacting with RAG2 was initially mapped to a large portion of the RAG1 core (aa 504–1008) (18). Subsequent studies implicated the RAG1 central core domain (aa 528–760) (19) or a putative zinc finger in RAG1 (zinc finger B, or ZFB; aa 727–750) (20) as sufficient for the interaction, although in both cases the interaction appeared less efficient than with the entire RAG1 core. The importance of ZFB was subsequently questioned by a large scale mutagenesis analysis of RAG1 (21). Finally, several acidic residues in the region from aa 546 to 560 of RAG1 were shown to be important for binding to RAG2 (22). A limitation of these studies was the use of qualitative co-immunoprecipitation or pulldown methods to assess the RAG1-RAG2 interaction. The use of more quantitative biochemical approaches has not been reported, likely because of the difficulty in obtaining sufficient amounts of purified RAG2 for study. As a result, many basic parameters of the interaction remain uncharacterized, including the binding affinity.
Here, we use biolayer interferometry to identify the regions of RAG1 necessary for interaction with RAG2, and Western blotting to estimate the concentration of RAG1 and RAG2 in mouse thymocytes. Our data yield a KD value of ∼0.4 μm for the RAG1-RAG2 interaction and suggest that the nuclear concentrations of both RAG1 and RAG2 are below this value. Our results also demonstrate that ZFB is not required for the RAG1-RAG2 interaction and lead to the definition of a truncated minimal RAG1 protein, lacking about half of the RAG1 core, that is sufficient for robust binding to RAG2. Residues of RAG1 critical for the interaction are located in a region structurally different from Hermes transposase, and modeling suggests that this region lies near a portion of the RAG1 active site. Interaction with RAG2 might therefore alter the conformation of this critical region of RAG1.
EXPERIMENTAL PROCEDURES
Protein Expression and Purification
RAG1 core (aa 384–1008) and RAG1 mutants (as indicated in Table 1) were cloned into pMH6 (23), which provides an N-terminal MBP tag and C-terminal His6 tag, and expressed in Escherichia coli. Proteins were purified through two affinity columns (nickel-nitrilotriacetic acid (NTA) and amylose) followed by size-exclusion chromatography using a Superdex 200 10/300 GL column (GE Healthcare) in buffer PB500 (25 mm Tris-HCl, pH 7.5, 500 mm NaCl, 0.5% glycerol). MBP-tagged Mini-RAG1 and truncations or mutations (subset shown in Table 2) were also cloned in pMH6 and purified in the same way but in a different buffer (25 mm Tris-HCl, pH 8.5, 200 mm NaCl, and 0.5% glycerol). C-terminal His6-tagged Mini-RAG1 lacking MBP was prepared from a modified pMH6 vector with a tobacco etch virus (TEV) protease cleavage site between MBP and the RAG1 open reading frame. The MBP tag was removed by TEV protease cleavage (4 °C overnight) followed by nickel-NTA and gel filtration column purification. MBP- and GST-tagged RAG2 core (aa 1–383) were expressed in HEK293T cells and purified as described previously (24). His-tagged HMGB1 was expressed and purified as described previously (25).
TABLE 1.
Expression and binding of RAG1 core variants
| R1 variantsa | Protein yieldb | RAG2 bindingc | |
|---|---|---|---|
| 1 | 384–1008 | ++ | ++ |
| 2 | 528–777 | + | − |
| 3 | 528–1008 | ++ | − |
| 4 | 761–980 | +++ | − |
| 5 | 761–1008 | − | NDd |
| 6 | Δ721–760 | +++ | ++ |
| 7 | Δ464–512 | + | − |
| 8 | 499–508Ae | − | ND |
| 9 | 477–493Ae | − | ND |
| 10 | Δ512–528 | − | ND |
| 11 | 384–555∼983–1008 | − | ND |
| 12 | 464–555∼983–1008 | − | ND |
| 13 | 384–518∼960–1008 | + | − |
| 14 | 383–732∼960–1008 | ++ | ++ |
| 15 | 384–585∼960–1008 | − | ND |
| 16 | 464–732∼960–1008 | ++++ | ++ |
| 17 | 384–732 | + | − |
| 18 | 528–732∼960–1008 | +++ | − |
| 19 | 479–732∼960–1008 | ++++ | ++ |
| 20 | 508–732∼960–1008 | +++ | + |
| 21 | 508–732∼960–997 | +++ | − |
a All variants were N-terminal MBP- and C-terminal His6-tagged.
b Protein yield and quality were evaluated by FPLC. ++, expression typical for MBP-R1c; ++++, expression typical for MBP-Mini-RAG1, which is ∼5-fold greater than that of MBP-R1c; +, expression reduced at least 2-fold from MBP-R1c.
c Ability to bind to GST-RAG2 core was tested by BLItz and GST pulldown. ++, binding as seen between R2c and either R1c or Mini-RAG1; +, binding reduced 3–20 fold; −, little or no binding detected.
d ND means not done.
e The indicated residues were substituted by alanine.
TABLE 2.
Single and double point mutations in the context of Mini-RAG1
| Position and mutationa | Amino acidb | Protein yieldc | RAG2 bindingd | |
|---|---|---|---|---|
| 1 | 524D | Lys | ++++ | + |
| 2 | 531K | Asp | ++++ | ++ |
| 3 | 541N | Leu | ++++ | + |
| 4 | 546N | Asp | ++++ | − |
| 5 | 547Q | Gln | ++++ | − |
| 6 | 551K | Asp | ++++ | ++ |
| 7 | 997Q | Lys | ++++ | − |
| 8 | 997E | Lys | ++++ | + |
| 9 | 1001E | Lys | ++++ | ++ |
| 10 | S517N/S519N | Phe-Trp | − | NDe |
| 11 | N529S/N530A | Arg-Thr | ++++ | + |
| 12 | Lys-546/Lys-547 | Asp-Glu | ++++ | − |
| 13 | Asn-536/Gln-Q547 | Asp-Glu | ++++ | − |
a All mutants were N-terminal MBP- and C-terminal His6-tagged.
b These are the residue(s) mutated.
c Protein yield and quality were evaluated by FPLC. ++++, expression typical for MBP-Mini-RAG1, which is ∼5-fold greater than that of MBP-R1c; −, no protein expression detected.
d The ability to bind to GST-RAG2 core was tested by BLItz. ++, binding as seen between R2c and either R1c or Mini-RAG1; +, binding reduced 3–20 fold; −, little or no binding detected.
e ND means not done.
Pulldown Interaction Assays
In vitro GST pulldown assays were performed by incubating 400 ng of GST-RAG2 core and 1 μg of MBP-RAG1 core or variants together with glutathione-Sepharose 4B resin in interaction buffer (25 mm Tris, pH 8.0, 200 mm NaCl, 1 mm DTT), with 1 mg/ml BSA added to decrease nonspecific interactions, for 30 min at 4 °C. After three 3-min washes, proteins were eluted with 10 mm glutathione and SDS-PAGE sample buffer and analyzed by SDS-PAGE. Western blots were developed with anti-GST (Santa Cruz Biotechnology), anti-MBP (Cell Signaling), or anti-RAG2 monoclonal antibody (mAb) number 39 (26).
For in vivo pulldown assays, 20 μg of RAG1 and RAG2 pEBB expression vectors (27) were co-transfected into a 10-cm dish of HEK293T cells using calcium phosphate. Forty eight h after transfection, cells were incubated with lysis buffer (50 mm Tris-HCl, pH 7.5, 150 mm NaCl, 1 mm DTT, 1% Nonidet P-40, protease-inhibitor mixture (Roche Applied Science)) on ice for 30 min, and after centrifugation (15,000 rpm, 30 min), supernatants were incubated with glutathione-Sepharose 4B resin or amylose resin at 4 °C for 1 h. After three 5-min washes, proteins were eluted and analyzed as described above.
V(D)J Recombination Assay
The pSF-12con/23con substrate plasmid contains consensus 12 and 23 RSSs separated by 405 bp and oriented so as to retain a signal joint on the plasmid.4 Three μg of each of three plasmids (pEBB-R1c or mutants, pEBB-R2c, and pSF-12con/23con) were co-transfected into a 6-cm dish of HEK293T cell with Lipofectamine 2000 (Invitrogen). Cells were harvested 48 h post-transfection, and extrachromosomal plasmid DNA was purified with a Qiagen miniprep kit. Recombination products were detected by PCR (34–35 cycles) or nested PCR (35 cycles followed by 35 cycles) followed by agarose gel electrophoresis,4 with some products confirmed to be proper signal joints by DNA sequencing.
Biolayer Interferometry and KD Calculation
Measurements were performed on a BLItz instrument (ForteBio). Prior to use, biosensors were soaked in BLItz assay buffer (20 mm Tris-HCl, pH 8.0, 150 mm KCl, 0.02% Tween 20, 2 mm DTT, 1 mg/ml BSA) for at least 10 min. Biolayer interferometry assays consisted of five steps, all performed in BLItz assay buffer: initial base line (30 s), loading, base line (30 s), association and dissociation. GST-R2c and MBP-R1c-His6 were immobilized on anti-GST or anti-His sensors separately. For the loading step, protein concentrations were adjusted to yield a signal intensity in the range of 1 to 2 nm, thereby ensuring that the sensors were not saturated. Times and protein concentrations for the association and dissociation steps were as indicated in the figures and legends. Control values, measured using empty (no protein loaded) sensors, were subtracted from experimental values before data processing. Initial experiments indicated that empty sensors and sensors loaded with control GST protein yielded similar values in binding experiments with MBP-R1c (data not shown). Sensorgrams were fit globally to a 1:1 binding model by BLItz Pro version 1.1.0.28, from which the equilibrium dissociation constant (KD) and association (ka) and dissociation (kd) rate constants were calculated. RAG1 homodimers were treated as a single molecule in calculations of protein concentration.
Protein Thermal Stability Assay
45 μl of a 5 μm protein solution (25 mm Tris-HCl, pH 8.5, 150 mm NaCl) was mixed with 5 μl of SYPRO Orange (Invitrogen) protein dye (final dilution 1:2,000). The thermal stability curve was measured using a CFX96 real time PCR machine (Bio-Rad). After an initial incubation at 10 °C for 10 min, temperature was increased from 10 to 85 °C in 0.5 °C increments (30 s per increment), with fluorescence measured at each increment. Data were analyzed by Bio-Rad CFX Manager version 3.1, which generated the melting curves and their first derivatives (which are plotted).
Size-exclusion Chromatography
A Superdex 200 10/300 GL column was equilibrated in 25 mm Tris-HCl, pH 8.5, 200 mm NaCl, 1 mm DTT; and MBP-Mini-RAG1 (8 μg) or Mini-RAG1 (2 μg) were fractionated separately, with absorbance monitored at 280 nm. The profiles were compared with gel filtration standards from Bio-Rad. For MBP-R2c and GST-R2c, 0.5 ml of cell lysate (from one 10-cm dish of HEK293T cells) was loaded after being passed through a 0.2-μm filter. Fractions were collected and analyzed by Western blots with anit-RAG2 antibody.
Quantitative RAG Western Blot Analysis
Thymuses from 5-week-old male C57BL/6 mice were mashed through a cell strainer in 2–3 ml of cold PBS, pelleted (800 × g, 4 °C, 5 min), resuspended in 1 ml of red blood cell lysis buffer (10 mm KHCO3, 150 mm NH4Cl, 0.1 mm EDTA, 5% fetal bovine serum) for 5 min at room temperature, and re-pelleted as above. Cells were resuspended in 10 ml of cold PBS and counted manually with a hemocytometer. After pelleting, cells were lysed with at least 2 pellet volumes of 20 mm Tris, pH 7.4, 20 mm β-glycerol phosphate, 10 mm Na3VO4, 10% glycerol, 0.5 mm EDTA, 0.5 mm MgCl2, 400 mm NaCl, 0.5% Triton X-100, 1 mm DTT, and 100 mm PMSF or protease inhibitor mixture (leupeptin/pepstatin/aprotinin (Sigma)) on ice for 10 min. Samples were aliquoted; and an equal volume of loading buffer containing 4% SDS, DTT, and loading dyes was added and then frozen at −80 °C. RAG protein standards were either MBP-RAG1 core and GST-RAG2 core, purified individually as described above (concentrations determined by mass spectrometry; Keck Biotechnology Resource Laboratory, Yale University), or MBP-RAG1 core and MBP-RAG2 core that were co-expressed and co-purified from HEK293T cells as described previously (24) (quantitated by SDS-PAGE followed by SYPRO Orange (Invitrogen) staining and comparison to BSA standards).
A known number of cell equivalents of thymocyte whole cell extract was analyzed by Western blotting together with a dilution series of one of the RAG protein standards. Standards were mixed with an appropriate amount of whole cell extract from M12 (a RAG-negative mature B cell line) prior to SDS-PAGE so as to create samples similar in composition to the thymocyte extracts. Samples in loading buffer (2% SDS) were heated to 95 °C for 20 min, spun at 14,000 rpm for 5 min, fractionated by SDS-PAGE (8% acrylamide; 100 V, 1.5 h), and transferred to polyvinylidene difluoride membranes (Bio-Rad) by electroblotting (120 V, 0.5 h). Membranes were incubated with either anti-RAG2 mAb number 39 or anti-RAG1 mAb number 23 (26), diluted 1:500 in PBS overnight at 4 °C, washed, and incubated with secondary antibody (goat anti-rabbit IgG (H+L) alkaline phosphatase, Jackson ImmunoResearch) diluted 1:1,000 in PBS for 1 h. Signals were detected using ECF chemiluminescent detection substrate (GE Healthcare). Membranes were imaged by Pharos Fx Plus (Bio-Rad); bands were quantitated using Image Lab version 4.1 (Bio-Rad), and local background (determined from a region of membrane just above each band) was subtracted to yield the signal for each fluorescent band. The signals from the protein standards were fit with a linear equation, which was used to determine the amount of RAG protein in the thymocyte sample. Similar experiments were performed with thymocyte whole cell extract and a purified fragment of the Ikaros protein containing the DNA binding domain (quantitated by mass spectrometry at the Yale Keck facility) and anti-Ikaros antibody recognizing that domain, both kindly provided by Sarah Wadsworth and Steve Smale.
Modeling of the RAG1 RNase H Fold
A RAG1 consensus secondary structural prediction was built using the output of HNN (28), SOPMA (29), JPRED3 (30), SSPRO (31), and ITASSER (32). Accessibility, charge, and hydropathy profiles were generated with ACCpro (31) and tools from the analysis and modeling package SLIDE (33). Fold recognition methods such as PHYRE (34), RAPTORX (35), and ITASSER were unable to identify any global template for RAG1. Hence, by using remote homology techniques, it was possible to reconstruct by modeling only the region comprising the RAG1 RNase H domain (RNHd) and two adjacent extensions corresponding in sequence to aa 538–732 and 960–1010. The resulting model, comprising RNHd and extensions, was built starting from proteins, including Hermes transposase and HIV-1, HIV-2, and prototype foamy virus integrases, all known to containing RNHd, which consists of nine secondary structural elements in the following order: β1-β2-β3-α1-β4-α2-β5-α3-α4. All of these RNHd regions exhibited less than 5 Å root mean square deviation from each other. The RNHd in RAG1, corresponding to the regions aa 594–732 and 960–996, exhibited remote homology with all templates in the RNase H group. However, the architecture of the RAG1 insertion domain was predicted to be significantly different from that of Hermes.
Remote homology modeling of the RNHd of RAG1 involved refining the alignment with information from secondary structural predictions and locking of critical active site amino acids (Asp-600, Asp-708, and Glu-962 in mouse RAG1). The RAG1 RNHd has longer insertions between the secondary structure elements than its closest template the Hermes transposase (Protein Data Bank code 4D1Q) (17% identity and 26% similarity), and the RAG1 RNHd has longer insertions between the secondary structural elements. These loops were generated ab initio by taking into account the properties of surrounding amino acids. In addition, based on homology and secondary structural predictions, it was possible to extend the RNHd model with 56 aa toward the N terminus (aa 538–593) and 14 aa toward the C terminus. Within the N terminus, aa 552–579 showed high homology with a corresponding helix in Hermes transposase (α0), whereas the rest had to be modeled ab initio. Here, a predicted helix containing aa 538–547 was modeled to satisfy both the hydrophobic pattern and “knobs into holes” packing constraints with respect to helix α0 and helix α4 within RNHd. The C terminus was modeled starting from a homologous stretch from HIV-1 integrase (Protein Data Bank code 4OVL).
The model was generated using INSIGHT II from Accelrys and further refined with a molecular dynamics procedure involving a Generalized Born simulated annealing using NAMD (36) on a 14 × HP BL280c G6 high performance computing cluster. The simulation used the CHARMM36 force field and was performed in implicit solvent for 10 ns with harmonic position restraints on the backbone of the protein in regions of secondary structure, whereas the loops were left to move freely so as to eliminate steric conflicts and bring the model to a lower energy minimum. The model was validated using the QA RecombineIT method for quality assessment (37).
Identifying RAG1 Residues for Mutagenesis
To select candidates for mutagenesis within RAG1 R2BD-B and the 997–1008 helix, we identified possible interacting residues such as aromatic and charged aa and designed mild point mutations intended to alter the interaction potential of the surface with minimal perturbation of the local structure. Mutants were screened for their ability to preserve the local sequence propensities and structure using SLIDE and the prediction programs noted above.
Calculation of Free and Bound RAG in Thymocytes
In the first scenario, a dimer of RAG1 was assumed to bind in two steps to two monomers of RAG2 according to Reaction 1,
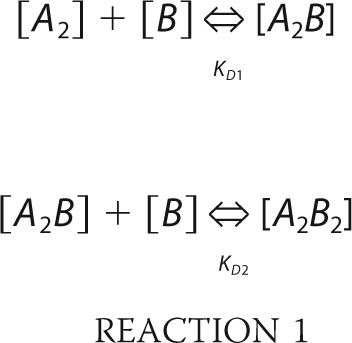 |
where A2 and B represent the RAG1 dimer and RAG2, respectively, and the equilibrium binding constants are KD, 1 and KD, 2. We assumed KD, 1 = KD, 2 = 0.4 μm as determined by BLItz using R1c and MBP-R2c. Setting [A2B2] and [A2B] as variables x and y, then [A2] = (A0-x-y) and [B] = (B0-2x-y), where A0 and B0 are the total concentrations of RAG1 dimer and RAG2 monomer, respectively, in mouse thymocytes, determined from quantitative Western blotting using a value of 6 μm as the approximate diameter of the thymocyte nucleus (38). Reaction 1 then yields two equilibrium equations in two unknowns that were solved to yield values for x and y using the computational engine Wolfram alpha.
In the second scenario, a dimer of RAG1 was assumed to bind a RAG2 dimer (Reaction 2).
 |
where B2 is the RAG2 dimer and the equilibrium constant KD′ = 0.04 μm as determined by BLItz using GST-R2c and R1c. Setting [A2B2] as variable x, then [A2] = (A0-x) and [B2] = (B0-x), and the equilibrium equation was then solved for x as above.
RESULTS
Zinc Finger B Is Not Required for the RAG1-RAG2 Interaction
We created a panel of MBP-RAG1 core (R1c) deletion mutants (Fig. 1B and Table 1) to test the conclusion of Aidinis et al. (20) that the RAG1 ZFB region is critical for binding RAG2. Strikingly, in vitro GST pulldown experiments revealed that complete deletion of ZFB (R1cΔ721–760, in which ZFB was replaced with a flexible linker of five glycine-serine (5×GS) repeats) had little effect on the amount of RAG1 protein pulled down with GST-RAG2 core (GST-R2c) (Fig. 1C, lanes 6 and 7). In addition, truncation mutants that removed large portions of the N- or N- and C-terminal portions of R1c but left ZFB intact were pulled down less efficiently (Fig. 1C, compare lanes 8 and 9). Pulldown of R1c528–777 was barely above that observed in the GST control (Fig. 1C, compare lanes 4 and 9). When we analyzed the same panel of mutants using an in vivo GST pulldown approach (as in the study of Aidinis et al. (20)), we found that again the deletion of ZFB had no discernible effect on the RAG1-RAG2 interaction (Fig. 1D, lanes 5 and 6), although the other deletion mutants were pulled down less efficiently (lanes 7 and 8). We conclude that ZFB can be deleted from RAG1 without disrupting the RAG1-RAG2 interaction.
Assessment of the RAG1-RAG2 Interaction by Biolayer Interferometry
Although active RAG1 core dimer can be purified in large quantities from bacteria (23), it has proven much more difficult to obtain substantial quantities of active, purified RAG2 core. Like many in the field (39), we routinely prepare RAG2 core (fused at its N terminus to GST or MBP) from transiently transfected 293T cells, which yields microgram quantities of active protein. To analyze the RAG1-RAG2 interaction, we took advantage of biolayer interferometry (40, 41) as implemented in the BLItzTM instrument, which allows kinetic analysis of macromolecular interactions using small amounts of material. In a typical experiment, an anti-GST biosensor (the tip of which is coated with anti-GST antibodies) is loaded with GST-R2c, washed in buffer, immersed in a solution of MBP-R1c, and the association kinetics monitored. The biosensor is then immersed in buffer, and the dissociation kinetics are monitored, resulting in a kinetic binding sensorgram from which association and dissociation rate constants (ka and kd) and the equilibrium binding constant (KD) can be determined (see under “Experimental Procedures”).
We first analyzed binding to GST-R2c by WT and mutant R1c proteins from which ZFB or portions of ZFB had been deleted. The binding sensorgrams of the WT and mutant proteins were similar, again suggesting that ZFB was not required for the interaction with RAG2 (Fig. 1E). We then performed a more detailed analysis using a R1c mutant (Cys-M) in which the two cysteine residues of ZFB predicted to coordinate zinc (Cys-727 and Cys-730) were mutated to alanine, which should prevent zinc binding and disrupt the function of the zinc finger (42). R1c and Cys-M (both fused to MBP at their N termini and His6 at their C termini) were coupled to anti-polyhistidine biosensors, and binding was measured using a range of MBP-R2c concentrations. The sensorgrams of the WT and Cys-M mutant proteins were similar in appearance and yielded comparable KD values of 0.38 and 0.35 μm, respectively (Fig. 1F). The Cys-M mutant was, however, inactive for V(D)J recombination in a transient transfection plasmid-based assay (Fig. 1G), consistent with previous analyses of mutations within ZFB (4, 21). We conclude that ZFB is important for the function of RAG1 but is not critical for the interaction of RAG1 with RAG2.
We noted that dissociation of R1c from sensor-bound GST-R2c (Fig. 1E) was considerably slower than dissociation of MBP-R2c from sensor-bound R1c (Fig. 1F). Because GST forms a tight dimer with a KD in the nanomolar range (43), the different dissociation kinetics might be due to different association states of the RAG2 proteins used. As expected, GST-R2c behaved as a dimer, whereas MBP-R2c behaved as a monomer in gel filtration (Fig. 2A). Effects of dimerization on the binding and rate constants are addressed below.
FIGURE 2.

RAG2 core and Mini-RAG1 are monomers. A, Western blot analysis using anti-RAG2 antibody of fractions from size-exclusion chromatography of whole cell extracts containing GST-R2c (upper) or MBP-R2c (lower), with lanes aligned with the fraction from which they are derived. At the top is shown the elution profile of molecular mass standards. B, size-exclusion chromatography profiles of purified Mini-RAG1 (blue), MBP-tagged Mini-RAG1 (red), and molecular mass standards (black). C, sensorgrams obtained using biosensors loaded with MBP-R1c, incubated with 3.8 μm MBP-R2C or GST-R2C. D, schematic diagram of RAG protein combinations analyzed by biolayer interferometry. mAU, milliabsorbance units at 280 nm.
Identification of a Minimal RAG1 Protein Able to Bind RAG2
We reasoned that comparison of RAG1 (which is dependent on RAG2) with Hermes transposase (which functions autonomously) might provide insights into the regions of RAG1 needed for interaction with RAG2. Comparison of the known secondary structural elements of Hermes transposase with the predicted elements of R1c revealed striking overall similarity, as noted previously (Fig. 3A) (16). Each is composed of three major regions as follows: an N-terminal DNA binding domain (Fig. 3A, red), an RNase H fold catalytic domain (purple and green), and a large α-helical insertion domain (yellow) that splits the catalytic domain between its main portion (purple) and C-terminal helices (green) containing the third active site residue. The C-terminal two-helix bundle of the RNHd in Hermes transposase lies across the face of the catalytic domain β-sheet so as to bring the three catalytic residues into close proximity (Fig. 3B).
FIGURE 3.

Identification of a minimal RAG1 protein able to bind RAG2. A, comparison of secondary structures predicted for RAG1 core and observed for Hermes transposase (rectangle, α-helix; arrow, β-strand). Colors indicate different domains or regions, as indicated. The portion of RAG1 core for which no equivalent was found in Hermes transposase is shaded orange. B, crystal structure of a Hermes transposase monomer (Protein Data Bank code 2BW3) with regions colored as in A. In the top view of the catalytic core, the DDE catalytic triad is shaded yellow. C, diagram of MBP-tagged Mini-RAG1 proteins analyzed by BLItz. D, sensorgrams obtained using GST-R2c-loaded biosensors, incubated with 20 μm of the indicated Mini-RAG1 proteins. E, protein thermal stability assay of MBP-tagged Mini-RAG1 proteins, as indicated. The fluorescence changes caused by protein unfolding were monitored by quantitative PCR, and the derivative melting curves (change in relative fluorescence per change in temperature) were plotted. Curve minima indicated the melting point, at which the fluorescence was changing most rapidly. Arrows indicate a shoulder in the curve for Mini-RAG1 that is absent in the mutants.
In contrast, the regions lying N- and C-terminal to the predicted RNHd of RAG1 differed in sequence propensities from those in Hermes transposase (see “Experimental Procedures”), leading us to focus our attention on a region between the NBD and the central catalytic core, and a final C-terminal predicted α-helix (within the orange-shaded rectangle in Fig. 3A). We hypothesized that these regions (aa 479–559 and 997–1008) of R1c were important for binding to RAG2. Analysis of various truncation mutants suggested that these short regions were not stable by themselves but required the presence of the catalytic central core region to produce a stable protein (Table 1 and data not shown).
Based on these considerations, we created a deletion mutant lacking the NBD, most of ZFB, and the insertion domain, and containing only two portions of R1c, aa 479–732 and 960–1008, linked together with a flexible 5×GS linker (Fig. 3C). This protein, hereafter referred to as Mini-RAG1, was soluble, readily purified in large amounts from bacteria, and behaved as a monomer by gel filtration (Fig. 2B). Importantly, Mini-RAG1 interacted robustly with biosensors coated with GST-R2c (Fig. 3D, dark blue trace).
Analysis of deletion mutants of Mini-RAG1 (Fig. 3C) revealed that it was not possible to delete substantial portions of its N or C termini without affecting the interaction with RAG2. Deletion of aa 479–507 yielded a protein with reduced RAG2 binding capacity (KD ∼6 μm, sensorgrams not shown; see below for comparison with KD for Mini-RAG1), and a larger N-terminal deletion to aa 527, or C-terminal deletions of aa 998–1008 or 960–1008 strongly compromised the interaction (Fig. 3D). These mutants appeared to be well folded based on a comparison of their melting curves to that of Mini-RAG1 (Fig. 3E; the curve minima define the melting temperature). We noted, however, that the melting curve for Mini-RAG1 contained a shoulder (Fig. 3E, arrow) not seen in the mutants, which we speculate arises from an interaction of the N- and C-terminal portions of Mini-RAG1 (see below). We conclude that Mini-RAG1 represents a small, likely minimal, portion of RAG1 capable of interacting strongly with RAG2.
Quantitation of the RAG1-RAG2 Interaction
To determine the affinity of the interaction between Mini-RAG1 and RAG2, and to investigate the influence of stoichiometry on the interaction, sensorgrams were collected for several RAG1 proteins (Fig. 4A) using biosensors loaded with GST-R2c (a dimer). Dimeric MBP-R1c (Fig. 4B) dissociated considerably more slowly than monomeric Mini-RAG1, with (Fig. 4C) or without (Fig. 4D), an MBP tag. The effects of stoichiometry were confirmed using biosensors loaded with MBP-R1c (a dimer); dimeric GST-R2c dissociated much more slowly than did monomeric MBP-R2c (Fig. 2C).
FIGURE 4.

Quantitation of the RAG1-RAG2 interaction. A, diagram of RAG1 proteins used in affinity measurements. B–D, sensorgrams obtained using GST-R2c-loaded biosensors, incubated with the indicated concentrations of MBP-R1c, MBP-Mini-RAG1, and Mini-RAG1, respectively. E, sensorgrams were fit globally to a 1:1 binding model, and the equilibrium dissociation constant (KD) and kinetic constants (ka and kd) were calculated. F, KD values obtained in experiments with MBP-Mini-RAG1 loaded biosensors and MBP-R2c in solution. The results of three independent measurements are shown with the average in parentheses.
Analysis of the sensorgrams of Fig. 4, B–D, yielded a KD of 0.04 μm for the interaction of MBP-R1c with GST-R2c, but values 10-fold higher (0.48–0.66 μm) were for the interaction of Mini-RAG1 with GST-R2c (Fig. 4E). As expected, the difference in KD was driven primarily by differences in the dissociation rate constants (Fig. 4E). Importantly, the KD value for the Mini-RAG1 interaction with GST-R2c was close to that obtained for the interaction of R1c with MBP-R2c (0.375 μm; Fig. 1F). Finally, we measured the KD value for the interaction of Mini-R1 with MBP-R2c (∼0.7 μm; Fig. 4F), demonstrating that a similar affinity is observed even when both proteins are monomers. The different arrangements of proteins analyzed by biolayer interferometry and the resulting KD values are summarized in Fig. 2D. We conclude that Mini-RAG1 recapitulates most of the RAG2 binding capacity of R1c. Furthermore, the data indicate that if both RAG1 and RAG2 are in dimeric form, they interact with one another with a 10-fold higher avidity than if one or both are monomeric.
Mapping of Residues Important for RAG2 Binding
Based on secondary structural predictions, we divided the N-terminal portion of Mini-RAG1 (hereafter referred to as the RAG2 binding domain, or R2BD) into regions A (aa 479–507) and B (aa 508–559) (Fig. 5A). Mutations were introduced into R2BD or the C-terminal helix of Mini-RAG1 (hereafter referred to as helix 997–1008), and the mutant proteins were purified and tested for their ability to interact with GST-R2c by biolayer interferometry. The melting curve of each protein was also determined (data not shown). The first set of mutations changed two or more adjacent residues and yielded a clear clustering of the mutations deleterious to the Mini-RAG1-RAG2 interaction (Fig. 5E, Mut-series 1; green text indicates poorly expressed and hence uninformative mutants). Most of the informative mutations in region B substantially reduced binding to RAG2 (Fig. 5E, red text), although none of the mutations in region A or the C-terminal helix did so (black text).
FIGURE 5.

Mapping of RAG1 residues important for RAG2 binding. A, diagram of domain-redefined architecture of RAG1 core and Mini-RAG1 showing the two portions of the RAG2 binding domain (R2BD). B–D, sensorgrams obtained using GST-R2c-loaded biosensors, incubated with 20 μm Mini-RAG1 or mutants thereof, as indicated. E, diagram of Mini-RAG1 mutants analyzed. Below the RAG1 sequence is indicated the predicted secondary structure (PSIPRED), and above it are indicated four series of mutants. Multiple aa changes contained in a single mutant are boxed. Green text indicates mutants that were poorly expressed and could not be analyzed, and black, blue, and red text indicate mutants with no effect, a moderate effect, or a strong effect, respectively, on binding to GST-R2c.
Based on this, single or double point mutations were introduced into R2BD-B and helix 997–1008, focusing on residues predicted to be surface-exposed and choosing mutations predicted to leave secondary structures intact (see “Experimental Procedures”). The sensorgrams for the C-terminal helix mutants are shown in Fig. 5B, and those for the single and double point mutations in R2BD-B are shown in Fig. 5, C and D, respectively. The results are summarized in Fig. 5E and Table 2. Charge-reversal mutations of Asp-531, Asp-551, and Lys-1001 had little effect on binding to GST-R2c, whereas K524D, RT529/530NA, and L541N, reduced but did not abrogate binding. Mutation of K997E substantially reduced binding, while K997Q had an even stronger effect. The most deleterious effects were seen with mutation of Asp-546 and Glu-547, where single charge neutralization (Fig. 5C), or double charge reversal or charge neutralization mutations (Fig. 5D), eliminated detectable binding. These results identify multiple residues in R2BD-B, as well as Lys-997 in the C-terminal helix, that contribute to the ability of Mini-RAG1 to bind to RAG2.
Finally, we determined the consequences of mutating Asp-546, Glu-547, or Lys-997 in the context of R1c. Biolayer interferometry revealed that single mutation of Asp-546, or double mutation of Asp-546 and Glu-547, eliminated detectable RAG2 binding, although some residual binding was seen with the E547Q single mutant (Fig. 6A). Notably, the K997Q mutation in the context of R1c had only a modest effect on RAG2 binding (Fig. 6A), in contrast to its strong effect in the context of Mini-RAG1 (Fig. 5B). Quantitation of RAG2 binding by R1c-K997Q revealed a KD of 0.054 μm (Fig. 6B), just slightly higher than the 0.04 μm value obtained for WT R1c. When analyzed with an in vitro GST pulldown assay, the D546N, E547Q, and D546N/E547Q mutants all eliminated detectable interaction with GST-R2c (Fig. 6C). However, the results of in vivo pulldown (Fig. 6D) and recombination assays (Fig. 6E) were more nuanced, with E547Q showing clear evidence of interaction with R2c and recombination activity; D546N supporting small but detectable levels of activity in both assays, and the D546N/E547Q double mutant having no detectable activity in either assay. The K997Q RAG1 core protein was as active as WT in all three assays, consistent with its strong binding by biolayer interferometry. We conclude that Asp-546 and Glu-547 constitute a small acidic region of RAG1 required for binding to RAG2 and for recombination activity, with Asp-546 being a particularly important residue. This is consistent with a previous study that found that D546A and E547A R1c mutants exhibited defects in in vitro pulldown and cleavage assays, with the Asp-546 mutant having a stronger phenotype (22).
FIGURE 6.

Functional analysis of RAG1 core mutants. A, sensorgrams obtained using GST-R2c-loaded biosensors, incubated with 20 μm WT or mutant MBP-R1c proteins, as indicated. B, sensorgrams obtained using GST-R2c-loaded biosensors, incubated with the indicated concentrations of MBP-R1c K997Q, with the calculated KD shown. C, in vitro GST pulldown experiments were performed as described in Fig. 1C with WT or mutant MBP-R1c proteins, as indicated. Data representative of two experiments. D, in vivo MBP-pulldown experiments were performed as described in Fig. 1D with WT or mutant MBP-R1c proteins, as indicated. Data are representative of two experiments. E, V(D)J recombination assay using WT and mutant RAG1 core proteins, as indicated, as described in Fig. 1G, with confirmation by nested PCR to increase the sensitivity (arrowhead indicates expected recombined product). Data are representative of three experiments.
Structural Modeling of Mini-RAG1
Given the importance of Asp-546/Glu-547 and helix 997–1008 for Mini-RAG1 to interact with RAG2, we wondered whether these two regions of the protein might be close to one another in the folded protein. To investigate this, we used homology modeling, with the Hermes transposase and retroviral integrases as starting templates, to create a structural model for a large portion of Mini-RAG1 (aa 538–732 linked to 960–1010), as described under “Experimental Procedures.” Secondary structural analysis demonstrated that the RAG1 RNHd shared a similar cadence of structural elements with the RNase H folds of Hermes transposase and HIV-1 integrase (Fig. 7), consistent with a previous analysis (44). Furthermore, secondary structural similarity could be detected N- and C-terminal to the RNHd by comparison with Hermes and HIV-1 integrase, respectively (N-terminal extension (Nex) and C-terminal extension (Cex) in Fig. 7).
FIGURE 7.

Secondary structural alignment of a portion of RAG1 core, Hermes transposase, and HIV-1 integrase. Secondary structure (ss) is indicated by H (α-helix), E (β-strand), and C (random coil) and represents the consensus prediction for RAG1. Identity and similarity between RAG1 and Hermes are indicated with green and yellow shading, respectively. Underlining and bold underline indicate similarity and identity, respectively, between RAG1 and HIV-1 integrase. The active site residues are shaded red. The N-terminal extension (Nex), RNHd (RNase H fold domain), C-terminal extension (Cex), and the location of the insertion domain are indicated.
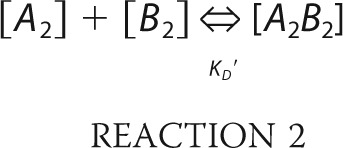
Mini-RAG1 consists of the RAG1 core with the NBD, part of ZFB, and insertion domain excised (Fig. 8A). The modeling revealed that the RAG1 RNHd could indeed be modeled as an RNase H fold, consisting of a five-stranded β-sheet on which lies a two-helix bundle (α3 and α4) from the C-terminal region, the first of which contributes Glu-962 (modeled in yellow) to the active site (Fig. 8B). The Mini-RAG1 model exhibits substantial overlap with Hermes transposase (Fig. 8C), as expected given that the Hermes structure provided a template for model construction. Notably, the three-dimensional disposition of the structural elements places the predicted Asp-546/Glu-547 helix (blue), helix 997–1008 (which makes up most of the C terminus; dark green), and the α3/α4 bundle (light green), on the same face of the structure (Fig. 8B). Neither the helix containing Asp-546/Glu-547 nor helix 997–1008 corresponds to the Hermes transposase template (Fig. 8C). This juxtaposition of structural elements in the model leads us to speculate that interaction of RAG2 with the Asp-546/Glu-547 helix could influence the structure of the C-terminal helices of the RAG1 core and thereby alter the geometry of the RAG1 active site.
FIGURE 8.
Model of RAG1 catalytic and RAG2-binding regions. A, schematic of RAG1 core secondary structural elements separating the RAG2-binding region (center) from the non-RAG2-binding portions (dashed red lines). Regions important for RAG2 interaction are shaded orange, and the boundaries between different subsections are marked by black arrows with aa number. Color scheme as in Fig. 3A. B, remote homology model of the RNase H fold of the RAG1 core created by molecular dynamics modeling. DDE motif residues, yellow; N-terminal extension (538–593, Nex), dark pink or blue for the very N-terminal helix containing Asp-546 and Glu-547 (red); major part of catalytic domain (552–732), pink; C-terminal region (960–1010), green or dark green for the C-terminal extension (Cex). C, superposition of RAG1 model (colored as in B) and Hermes transposase catalytic core (gray). The root mean square deviation between the α-carbons in the two structures is 3.9 Å, with the best superposition located in secondary structural elements, although loops, where RAG1 has more insertions compared with Hermes, are significantly different.
Quantitation of RAG1 and RAG2 Protein in Thymocytes
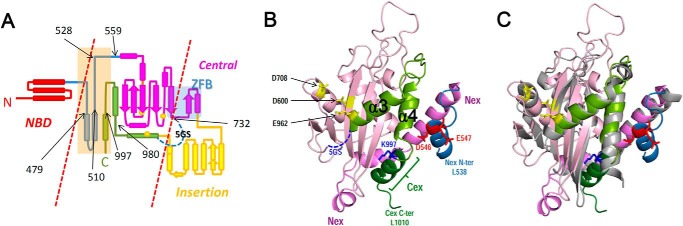
How does the KD value for the RAG1-RAG2 interaction (∼0.4 μm) compare with the concentration of RAG1 and RAG2 in the nucleus of developing lymphocytes? It was previously estimated that the average thymocyte contains 104–105 molecules of RAG1 and RAG2, with RAG2 clearly in excess over RAG1 (45). The methodology used (immunoprecipitation followed by SDS-PAGE/silver staining) was crude and required assumptions that were difficult to validate. In an attempt to improve on this, we performed quantitative Western blotting of whole cell extracts prepared from total mouse thymus and compared the RAG1 and RAG2 signal intensities to those obtained from purified RAG protein preparations whose concentrations were determined either by mass spectrometry or SDS-PAGE followed by staining (see “Experimental Procedures”). The results (Fig. 9, A–D, for sample blots; tabulated in Fig. 9E) revealed an average value for RAG1 of 1,800 molecules (monomer) per cell (range, 900–2,200), and for RAG2, 15,300 molecules per cell (range, 6,800–23,300). To test for methodological error, we measured the number of molecules of the transcription factor Ikaros in total thymocytes using identical methods and a recombinant Ikaros protein standard (see “Experimental Procedures”). Two determinations yielded values of ∼150,000 and ∼250,000 Ikaros molecules per thymocyte (Western blots not shown), similar to the previously determined value of ∼250,000 (46).
FIGURE 9.
Quantitation of RAG protein levels in mouse thymocytes. Representative Western blots probing for RAG1 (A and B) and RAG2 (C and D) with standards derived from individually expressed MBP-RAG1 (A) and GST-RAG2c (C) or co-expressed MBP-RAG1c/MBP-RAG2c (B and D) are shown. Whole cell extracts (WCE) from M12 cells (which do not express RAG) and thymocytes were loaded as indicated, with the number of cell equivalents loaded indicated below the lanes for thymus. The amount of protein standard loaded in each lane (in femtomoles) is indicated. E, table listing the results of six independent measurements of RAG1 and RAG2 protein levels (in monomers per cell), and the average of these determinations.
Assuming the nuclear diameter of a thymocyte is 6 μm, it yields nuclear concentrations of ∼0.013 and ∼0.22 μm for RAG1 dimers and RAG2, respectively. Although there are a number of assumptions and limitations associated with these values (see “Discussion”), they indicate that the concentration of RAG1 is below that of RAG2 and well below the KD value for the RAG1-RAG2 interaction.
DISCUSSION
This study provides several important insights. First, Mini-RAG1 was found to be a stable, well expressed protein that constitutes the key RAG2-binding components of the RAG1 core. Second, Mini-RAG1 could be modeled as an RNase H fold, allowing identification of a putative RAG2-interaction surface. Third, we determined the KD value of the RAG1-RAG2 interaction, which to our knowledge has not previously been reported. The KD value for Mini-RAG1 interaction with GST-R2c (0.5–0.6 μm) or with MBP-R2c (∼0.7 μm) was somewhat higher than that for the interaction between MBP-R2c and the full RAG1 core (0.4 μm), suggesting that Mini-RAG1 does not recapitulate all of the interactions that occur between the two RAG core proteins. Hence, it is possible that ZFB, the NBD, or the insertion domain contribute to the interaction with RAG2.
Our findings regarding ZFB conflict with those of Aidinis et al. (20). We suspect that the reason for the discrepancy lies in this previous study's reliance on a qualitative approach (GST pulldown) that might have allowed detection of weak interactions. We demonstrate that mutation of two zinc-coordinating residues of ZFB had no quantitative effect on binding of RAG1 core to RAG2 core (Fig. 1F), leading us to conclude that neither the presence nor the structural integrity of ZFB is required for binding of RAG1 to RAG2. However, as noted above, we cannot rule out the possibility that ZFB makes some contribution to the RAG1-RAG2 interaction.
Our data are in good agreement with other analyses of the RAG1-RAG2 interaction. McMahan et al. (18) observed that N- or C-terminal deletions from RAG1 aa 504–1008 substantially interfered with RAG2 binding, consistent with our findings regarding the importance of R2BD-B and helix 997–1008. Our findings also parallel those of Arbuckle et al. (19), who detected a weak interaction between RAG1 aa 528–760 and RAG2, similar to our results with RAG1 aa 528–777 (Fig. 1, C and D). Finally, our findings regarding the importance of Asp-546 and Glu-547 for the RAG1-RAG2 interaction and for V(D)J recombination agree with previous biochemical studies (22, 47).
Given the strong phenotype associated with mutation of Asp-546 and to a lesser extent Glu-547, it is plausible that these residues make direct contact with RAG2. However, we cannot rule out the possibility that they contribute indirectly to the interaction. Similarly, we cannot determine which portion or portions of R2BD or helix 997–1008 might make direct contacts with RAG2. Lys-997, which lies at the beginning of helix 997–1008 (Fig. 8B), remains enigmatic; mutation of Lys-997 to Gln had a much stronger effect on RAG2 binding in the context of Mini-RAG1 than in the context of RAG1 core. Previous analysis of K997A RAG1 core did not reveal a strong defect in V(D)J recombination (21). It is possible that Lys-997 is more important for stabilizing local protein structure in the context of Mini-RAG1 than when the rest of the RAG1 core is present.
Notably, a number of mutations found in RAG1 in human severe combined immunodeficient and Omenn syndrome patients map within or close to the borders of R2BD-B as follows: G513A, W519C, D536V, R556S, and R558H/R558C (aa numbers from mouse RAG1; human aa numbers are three larger). Such mutations could destabilize the interaction with RAG2. In our analysis, mutation of clusters of aa encompassing Trp-519, Asp-536, or Arg-556/Arg-558 greatly decreased the yield of Mini-RAG1 (Fig. 5E), suggesting that they are important for protein stability.
Our estimates of the average number of RAG1 (∼1,800) and RAG2 (∼15,000) molecules per thymocyte have some limitations and likely underestimate the actual values in at least some cell populations, particularly for RAG1. Thymocytes are heterogeneous, with ∼20% being mature CD4 or CD8 single-positive cells that do not express RAG and ∼5% being CD4/CD8 double-negative cells that express lower levels of RAG mRNA than do CD4/CD8 double-positive thymocytes.5 During extract preparation, the RAG proteins might not be quantitatively extracted from the cells; a portion of RAG1 is known to be difficult to extract from the nuclei (45). RAG1 Western blot signals are weaker and more difficult to quantitate accurately than those of RAG2 (Fig. 9). The values obtained depend heavily on how accurately the concentrations of the standards were determined. The fact that two different sets of RAG protein standards, quantitated by different methods, gave comparable results (within a factor of 1.5), provides some confidence in this regard. It is likely that double-positive thymocytes, which constitute about 75% of thymocytes, have higher levels of RAG1 and RAG2 than our estimates indicate. Our finding that RAG2 is in considerable excess over RAG1 is fully consistent with our previous study (45).
Determination of the KD value for RAG1-RAG2 binding (∼0.4 μm) provides a fundamental parameter useful for understanding the properties of RAG and potential mechanisms for regulating RAG function. Even if our value for the number of RAG1 molecules per thymocyte is a 4-fold underestimate, then the concentration of RAG1 in the thymocyte nucleus is still well below the KD value. Applying the KD and RAG concentration values determined here to a simple model of a dimer of RAG1 binding sequentially to two RAG2 monomers (see “Experimental Procedures”) yields the result that, at equilibrium, only 16% of RAG1 dimers are predicted to be bound to two molecules of RAG2, with 29 and 55% having one or no bound RAG2, respectively. Under the (implausible) assumption that all RAG2 molecules are dimers (and the corresponding 10-fold drop in the KD), a much higher percentage of RAG1 dimers (72%) is now predicted to be bound to RAG2. In all scenarios, a high percentage of RAG2 is predicted to remain free of RAG1, consistent with a recent finding that much of RAG2 is readily extracted from thymocyte nuclei under mild detergent conditions (48).
Our study does not address the possibility that the non-core portions of the RAG proteins influence the affinity with which the RAG1 and RAG2 core regions interact, and our calculations of RAG protein concentrations are based on simplistic assumptions that do not take into account molecular crowding or other physical parameters that might alter their effective nuclear concentrations. There are numerous ways in which the RAG1-RAG2 interaction, and hence catalytic activity, might be regulated, including RAG post-translational modifications, binding of RAG to DNA or chromatin, and the influence of other binding partners. The KD and RAG concentrations derived here raise the possibility that the majority of RAG1 in the nucleus is in a configuration incompatible with coupled cleavage. This provides an appealing means of limiting genome damage caused by off-target RAG-mediated cleavage, which might be of particular importance given that RAG1 binding can be detected at many off-target sites in the developing lymphocyte genome.4
Our findings indicate that areas of high local RAG2 concentration (particularly if RAG2 molecules are held in close proximity as in the GST-RAG2 core dimer) should favor interactions with RAG1. Interestingly, RAG2 displays a punctate staining pattern in thymocytes (48) and in pro-B and pre-B cells,6 indicating that the protein is not uniformly distributed in the nucleus. The basis for this is unknown and does not seem to be a direct consequence of the ability of RAG2 to interact with methylated histone 3 (48). It will now be important to determine whether there are regulatory mechanisms that modulate the RAG1-RAG2 interaction in vivo.
While this work was under revision, Gellert and co-workers (49) reported the crystal structure of the RAG1 core-RAG2 core complex. This demonstrated that indeed the RAG1 catalytic center adopts an RNase H fold and identified an extensive RAG1-RAG2 interface, much of which is contained in Mini-RAG1. Residues in R2BD-B constitute a major part of the interaction surface, and interestingly, Asp-546 lies on an extended loop that projects into RAG2 where it forms a salt bridge with Arg-229 of RAG2. Also of note is that the ZFB region does not itself constitute a zinc finger but instead Cys-727 and Cys-730 coordinate a zinc ion together with His-937 and His-942 (49). Residues in the ZFB region are located at the interface with RAG2, but our deletion and mutation data argue that they are not a major contributor to the RAG1-RAG2 interaction.
Acknowledgments
We thank Sarah Wadsworth and Steve Smale for purified Ikaros protein and anti-Ikaros antibody; Xueqi Liu for DNA constructs, advice, and a program used to generate BLItz figures; and Mihai Ciubotaru for valuable input and for comments on the manuscript.
This work was supported, in whole or in part, by National Institutes of Health Grant R37 AI32524 (to D. G. S.). This work was also supported by Executive Agency for Funding Higher Education, Research, Development, and Innovation Grants ID 3-0342-181/2011 and PT-PCCA-4-0930-120/2014, and Romanian Academy Projects 1 and 3 of Institute of Biochemistry of the Romanian Academy (to A. J. P. and M. D. S.).
This article was selected as a Paper of the Week.
G. Teng and D. G. Schatz, unpublished data.
M. Krangel, personal communication.
A. Corcoran, personal communication.
- RSS
- recombination signal sequence
- ZFB
- zinc finger B
- aa
- amino acid
- NBD
- nonamer binding domain
- FPLC
- fast protein liquid chromatography
- MBP
- maltose-binding protein
- R1c
- RAG1 core
- R2c
- RAG2 core
- HIV
- human immunodeficiency virus
- RNHd
- RNase H domain.
REFERENCES
- 1. Gellert M. (2002) V(D)J recombination: RAG proteins, repair factors, and regulation. Annu. Rev. Biochem. 71, 101–132 [DOI] [PubMed] [Google Scholar]
- 2. Swanson P. C. (2004) The bounty of RAGs: recombination signal complexes and reaction outcomes. Immunol. Rev. 200, 90–114 [DOI] [PubMed] [Google Scholar]
- 3. Schatz D. G., Swanson P. C. (2011) V(D)J recombination: mechanisms of initiation. Annu. Rev. Genet. 45, 167–202 [DOI] [PubMed] [Google Scholar]
- 4. Sadofsky M. J., Hesse J. E., McBlane J. F., Gellert M. (1993) Expression and V(D)J recombination activity of mutated RAG-1 proteins. Nucleic Acids Res. 21, 5644–5650 [DOI] [PMC free article] [PubMed] [Google Scholar]
- 5. De P., Rodgers K. K. (2004) Putting the pieces together: identification and characterization of structural domains in the V(D)J recombination protein RAG1. Immunol. Rev. 200, 70–82 [DOI] [PubMed] [Google Scholar]
- 6. Shinkai Y., Rathbun G., Lam K. P., Oltz E. M., Stewart V., Mendelsohn M., Charron J., Datta M., Young F., Stall A. M. (1992) RAG-2-deficient mice lack mature lymphocytes owing to inability to initiate V(D)J rearrangement. Cell 68, 855–867 [DOI] [PubMed] [Google Scholar]
- 7. Swanson P. C., Desiderio S. (1999) RAG-2 promotes heptamer occupancy by RAG-1 in the assembly of a V(D)J initiation complex. Mol. Cell. Biol. 19, 3674–3683 [DOI] [PMC free article] [PubMed] [Google Scholar]
- 8. Zhao S., Gwyn L. M., De P., Rodgers K. K. (2009) A non-sequence-specific DNA binding mode of RAG1 is inhibited by RAG2. J. Mol. Biol. 387, 744–758 [DOI] [PMC free article] [PubMed] [Google Scholar]
- 9. Jones J. M., Simkus C. (2009) The roles of the RAG1 and RAG2 “non-core” regions in V(D)J recombination and lymphocyte development. Arch. Immunol. Ther. Exp. 57, 105–116 [DOI] [PubMed] [Google Scholar]
- 10. Yin F. F., Bailey S., Innis C. A., Ciubotaru M., Kamtekar S., Steitz T. A., Schatz D. G. (2009) Structure of the RAG1 nonamer binding domain with DNA reveals a dimer that mediates DNA synapsis. Nat. Struct. Mol. Biol. 16, 499–508 [DOI] [PMC free article] [PubMed] [Google Scholar]
- 11. Callebaut I., Mornon J. P. (1998) The V(D)J recombination activating protein RAG2 consists of a six-bladed propeller and a PHD fingerlike domain, as revealed by sequence analysis. Cell. Mol. Life Sci. 54, 880–891 [DOI] [PMC free article] [PubMed] [Google Scholar]
- 12. Gomez C. A., Ptaszek L. M., Villa A., Bozzi F., Sobacchi C., Brooks E. G., Notarangelo L. D., Spanopoulou E., Pan Z. Q., Vezzoni P., Cortes P., Santagata S. (2000) Mutations in conserved regions of the predicted RAG2 kelch repeats block initiation of V(D)J recombination and result in primary immunodeficiencies. Mol. Cell. Biol. 20, 5653–5664 [DOI] [PMC free article] [PubMed] [Google Scholar]
- 13. Fugmann S. D. (2010) The origins of the Rag genes–from transposition to V(D)J recombination. Semin. Immunol. 22, 10–16 [DOI] [PMC free article] [PubMed] [Google Scholar]
- 14. Zhou L., Mitra R., Atkinson P. W., Hickman A. B., Dyda F., Craig N. L. (2004) Transposition of hAT elements links transposable elements and V(D)J recombination. Nature 432, 995–1001 [DOI] [PubMed] [Google Scholar]
- 15. Hencken C. G., Li X., Craig N. L. (2012) Functional characterization of an active Rag-like transposase. Nat. Struct. Mol. Biol. 19, 834–836 [DOI] [PMC free article] [PubMed] [Google Scholar]
- 16. Hickman A. B., Perez Z. N., Zhou L., Musingarimi P., Ghirlando R., Hinshaw J. E., Craig N. L., Dyda F. (2005) Molecular architecture of a eukaryotic DNA transposase. Nat. Struct. Mol. Biol. 12, 715–721 [DOI] [PubMed] [Google Scholar]
- 17. Hickman A. B., Ewis H. E., Li X., Knapp J. A., Laver T., Doss A. L., Tolun G., Steven A. C., Grishaev A., Bax A., Atkinson P. W., Craig N. L., Dyda F. (2014) Structural basis of hAT transposon end recognition by Hermes, an octameric DNA transposase from Musca domestica. Cell 158, 353–367 [DOI] [PMC free article] [PubMed] [Google Scholar]
- 18. McMahan C. J., Sadofsky M. J., Schatz D. G. (1997) Definition of a large region of RAG1 that is important for coimmunoprecipitation of RAG2. J. Immunol. 158, 2202–2210 [PubMed] [Google Scholar]
- 19. Arbuckle J. L., Fauss L. A., Simpson R., Ptaszek L. M., Rodgers K. K. (2001) Identification of two topologically independent domains in RAG1 and their role in macromolecular interactions relevant to V(D)J recombination. J. Biol. Chem. 276, 37093–37101 [DOI] [PubMed] [Google Scholar]
- 20. Aidinis V., Dias D. C., Gomez C. A., Bhattacharyya D., Spanopoulou E., Santagata S. (2000) Definition of minimal domains of interaction within the recombination-activating genes 1 and 2 recombinase complex. J. Immunol. 164, 5826–5832 [DOI] [PubMed] [Google Scholar]
- 21. Huye L. E., Purugganan M. M., Jiang M. M., Roth D. B. (2002) Mutational analysis of all conserved basic amino acids in RAG-1 reveals catalytic, step arrest, and joining-deficient mutants in the V(D)J recombinase. Mol. Cell. Biol. 22, 3460–3473 [DOI] [PMC free article] [PubMed] [Google Scholar]
- 22. Ko J. E., Kim C. W., Kim D. R. (2004) Amino acid residues in RAG1 responsible for the interaction with RAG2 during the V(D)J recombination process. J. Biol. Chem. 279, 7715–7720 [DOI] [PubMed] [Google Scholar]
- 23. Rodgers K. K., Villey I. J., Ptaszek L., Corbett E., Schatz D. G., Coleman J. E. (1999) A dimer of the lymphoid protein RAG1 recognizes the recombination signal sequence and the complex stably incorporates the high mobility group protein HMG2. Nucleic Acids Res. 27, 2938–2946 [DOI] [PMC free article] [PubMed] [Google Scholar]
- 24. Banerjee J. K., Schatz D. G. (2014) Synapsis alters RAG-mediated nicking at Tcrb recombination signal sequences: implications for the “beyond 12/23” rule. Mol. Cell. Biol. 34, 2566–2580 [DOI] [PMC free article] [PubMed] [Google Scholar]
- 25. Eastman Q. M., Villey I. J., Schatz D. G. (1999) Detection of RAG protein-V(D)J recombination signal interactions near the site of DNA cleavage by UV cross-linking. Mol. Cell. Biol. 19, 3788–3797 [DOI] [PMC free article] [PubMed] [Google Scholar]
- 26. Coster G., Gold A., Chen D., Schatz D. G., Goldberg M. (2012) A dual interaction between the DNA damage response protein MDC1 and the RAG1 subunit of the V(D)J recombinase. J. Biol. Chem. 287, 36488–36498 [DOI] [PMC free article] [PubMed] [Google Scholar]
- 27. Roman C. A., Cherry S. R., Baltimore D. (1997) Complementation of V(D)J recombination deficiency in RAG-1(−/−) B cells reveals a requirement for novel elements in the N terminus of RAG-1. Immunity 7, 13–24 [DOI] [PubMed] [Google Scholar]
- 28. Guermeur Y. (1997) Combinaison De Classifieurs Statistiques, Application a La Prediction De Structure Secondaire Des Proteins. Ph.D. Thesis, Université Pierre et Marie Curie, Paris, France [Google Scholar]
- 29. Geourjon C., Deléage G. (1995) SOPMA: significant improvements in protein secondary structure prediction by consensus prediction from multiple alignments. Comput. Appl. Biosci. 11, 681–684 [DOI] [PubMed] [Google Scholar]
- 30. Cole C., Barber J. D., Barton G. J. (2008) The Jpred 3 secondary structure prediction server. Nucleic Acids Res. 36, W197–W201 [DOI] [PMC free article] [PubMed] [Google Scholar]
- 31. Cheng J., Randall A. Z., Sweredoski M. J., Baldi P. (2005) SCRATCH: a protein structure and structural feature prediction server. Nucleic Acids Res. 33, W72–W76 [DOI] [PMC free article] [PubMed] [Google Scholar]
- 32. Roy A., Kucukural A., Zhang Y. (2010) I-TASSER: a unified platform for automated protein structure and function prediction. Nat. Protoc. 5, 725–738 [DOI] [PMC free article] [PubMed] [Google Scholar]
- 33. Hanganu A., Micluta M. A., Popa B. A., Spiridon L. N., Tacutu R. (2009) An interactive threading refinement tool for homology modeling. Rom. J. Biochem. 46, 123–127 [Google Scholar]
- 34. Kelley L. A., Sternberg M. J. (2009) Protein structure prediction on the Web: a case study using the Phyre server. Nat. Protoc. 4, 363–371 [DOI] [PubMed] [Google Scholar]
- 35. Wang Z., Zhao F., Peng J., Xu J. (2011) Protein 8-class secondary structure prediction using conditional neural fields. Proteomics 11, 3786–3792 [DOI] [PMC free article] [PubMed] [Google Scholar]
- 36. Phillips J. C., Braun R., Wang W., Gumbart J., Tajkhorshid E., Villa E., Chipot C., Skeel R. D., Kalé L., Schulten K. (2005) Scalable molecular dynamics with NAMD. J. Comput. Chem. 26, 1781–1802 [DOI] [PMC free article] [PubMed] [Google Scholar]
- 37. Pawlowski M., Bogdanowicz A., Bujnicki J. M. (2013) QA-RecombineIt: a server for quality assessment and recombination of protein models. Nucleic Acids Res. 41, W389–W397 [DOI] [PMC free article] [PubMed] [Google Scholar]
- 38. Chaumeil J., Micsinai M., Ntziachristos P., Roth D. B., Aifantis I., Kluger Y., Deriano L., Skok J. A. (2013) The RAG2 C-terminus and ATM protect genome integrity by controlling antigen receptor gene cleavage. Nat. Commun. 4, 2231. [DOI] [PMC free article] [PubMed] [Google Scholar]
- 39. Bergeron S., Anderson D. K., Swanson P. C. (2006) RAG and HMGB1 proteins: purification and biochemical analysis of recombination signal complexes. Methods Enzymol. 408, 511–528 [DOI] [PubMed] [Google Scholar]
- 40. Abdiche Y., Malashock D., Pinkerton A., Pons J. (2008) Determining kinetics and affinities of protein interactions using a parallel real-time label-free biosensor, the Octet. Anal. Biochem. 377, 209–217 [DOI] [PubMed] [Google Scholar]
- 41. Do T., Ho F., Heidecker B., Witte K., Chang L., Lerner L. (2008) A rapid method for determining dynamic binding capacity of resins for the purification of proteins. Protein Expr. Purif. 60, 147–150 [DOI] [PubMed] [Google Scholar]
- 42. Wolfe S. A., Nekludova L., Pabo C. O. (2000) DNA recognition by Cys2His2 zinc finger proteins. Annu. Rev. Biophys. Biomol. Struct. 29, 183–212 [DOI] [PubMed] [Google Scholar]
- 43. Fabrini R., De Luca A., Stella L., Mei G., Orioni B., Ciccone S., Federici G., Lo Bello M., Ricci G. (2009) Monomer-dimer equilibrium in glutathione transferases: a critical re-examination. Biochemistry 48, 10473–10482 [DOI] [PubMed] [Google Scholar]
- 44. Fugmann S. D., Villey I. J., Ptaszek L. M., Schatz D. G. (2000) Identification of two catalytic residues in RAG1 that define a single active site within the RAG1/RAG2 protein complex. Mol. Cell 5, 97–107 [DOI] [PubMed] [Google Scholar]
- 45. Leu T. M., Schatz D. G. (1995) rag-1 and rag-2 are components of a high-molecular-weight complex, and association of rag-2 with this complex is rag-1 dependent. Mol. Cell. Biol. 15, 5657–5670 [DOI] [PMC free article] [PubMed] [Google Scholar]
- 46. Bradley M. N., Zhou L., Smale S. T. (2003) C/EBPbeta regulation in lipopolysaccharide-stimulated macrophages. Mol. Cell. Biol. 23, 4841–4858 [DOI] [PMC free article] [PubMed] [Google Scholar]
- 47. Kim D. R., Dai Y., Mundy C. L., Yang W., Oettinger M. A. (1999) Mutations of acidic residues in RAG1 define the active site of the V(D)J recombinase. Genes Dev. 13, 3070–3080 [DOI] [PMC free article] [PubMed] [Google Scholar]
- 48. Chan E. A., Teng G., Corbett E., Choudhury K. R., Bassing C. H., Schatz D. G., Krangel M. S. (2013) Peripheral subnuclear positioning suppresses Tcrb recombination and segregates Tcrb alleles from RAG2. Proc. Natl. Acad. Sci. U.S.A. 110, E4628–E4637 [DOI] [PMC free article] [PubMed] [Google Scholar]
- 49. Kim M. S., Lapkouski M., Yang W., Gellert M. (2015) Crystal structure of the V(D)J recombinase RAG1-RAG2. Nature 518, 507–511 [DOI] [PMC free article] [PubMed] [Google Scholar]