

Background: The dopaminergic neurotoxin, 1-methyl-4-phenylpyridinium (MPP+), kills cells by inhibiting mitochondrial oxidative phosphorylation.
Results: MicroRNA-7-mediated repression of RelA expression and subsequent increase in glucose transporter Glut3 level augments glycolysis in neuronal cells.
Conclusion: MicroRNA-7 protects cells against MPP+-induced cytotoxicity by enhancing glycolysis.
Significance: MicroRNA-7 could potentially mitigate the effects of mitochondrial oxidative phosphorylation defects in Parkinson disease.
Keywords: glycolysis, microRNA (miRNA), neurodegenerative disease, NF-kappa B (NF-KB), Parkinson disease, 1-methyl-4-phenylpyridinium, RelA, microRNA-7, glycolysis
Abstract
Parkinson disease is associated with decreased activity of the mitochondrial electron transport chain. This defect can be recapitulated in vitro by challenging dopaminergic cells with 1-methyl-4-phenylpyridinium (MPP+), a neurotoxin that inhibits complex I of electron transport chain. Consequently, oxidative phosphorylation is blocked, and cells become dependent on glycolysis for ATP production. Therefore, increasing the rate of glycolysis might help cells to produce more ATP to meet their energy demands. In the present study, we show that microRNA-7, a non-coding RNA that protects dopaminergic neuronal cells against MPP+-induced cell death, promotes glycolysis in dopaminergic SH-SY5Y and differentiated human neural progenitor ReNcell VM cells, as evidenced by increased ATP production, glucose consumption, and lactic acid production. Through a series of experiments, we demonstrate that targeted repression of RelA by microRNA-7, as well as subsequent increase in the neuronal glucose transporter 3 (Glut3), underlies this glycolysis-promoting effect. Consistently, silencing Glut3 expression diminishes the protective effect of microRNA-7 against MPP+. Further, microRNA-7 fails to prevent MPP+-induced cell death when SH-SY5Y cells are cultured in a low glucose medium, as well as when differentiated ReNcell VM cells or primary mouse neurons are treated with the hexokinase inhibitor, 2-deoxy-d-glucose, indicating that a functional glycolytic pathway is required for this protective effect. In conclusion, microRNA-7, by down-regulating RelA, augments Glut3 expression, promotes glycolysis, and subsequently prevents MPP+-induced cell death. This protective effect of microRNA-7 could be exploited to correct the defects in oxidative phosphorylation in Parkinson disease.
Introduction
Parkinson disease (PD)2 is a chronic, progressive neurodegenerative disorder characterized by accumulation of misfolded protein aggregates containing α-synuclein and loss of dopaminergic neurons in the substantia nigra pars compacta. It manifests clinically as tremor, rigidity, bradykinesia, and shuffling gait. Multiple mechanisms have been suggested to contribute to the degeneration of dopaminergic neurons in PD. Among them, several lines of evidence indicate dysfunctional mitochondria to be an important contributing factor at the sub-cellular level (1–3). NADH-ubiquinone reductase (complex I of mitochondrial electron transport chain) activity has been found to be significantly reduced in the substantia nigra of PD patients (4). This likely results from oxidative damage and misassembly of the catalytic subunits of complex I (5). In addition, the neurotoxin 1-methyl-4-phenyl-1,2,3,6-tetrahydropyridine (MPTP) inhibits complex I of the electron transport chain after being converted into its active metabolite 1-methyl-4-phenylpyridinium (MPP+) and results in a Parkinsonian phenotype in humans, non-human primates, and mice (6). As MPP+-induced mitochondrial dysfunction leads to decreased production of ATP (7), cells attempt to meet their energy demand by enhancing the rate of glycolysis (8). Therefore, strategies to further increase the glycolytic rate could be exploited to sustain ATP production and slow the progression of neuronal degeneration in PD.
MicroRNAs are small, non-coding RNAs that regulate several cellular pathways by altering the expression of their target genes. Dysregulation of microRNA expression and/or function has been associated with neurodegenerative disorders including PD (9–11). MicroRNA-7 (miR-7) was first identified to play a protective role in cellular models of PD by directly targeting and down-regulating α-synuclein expression (12, 13). miR-7 also protects against MPP+-induced neurotoxicity (14, 15). In the latter model, the cytoprotective role of miR-7 is mediated through down-regulation of its target RelA, a member of the nuclear factor κB (NF-κB) family of transcription factors.
In the present study, we show that miR-7 promotes glycolysis as measured by increases in intracellular ATP/ADP ratio, glucose consumption, and lactic acid production. This effect of miR-7 is mediated through down-regulating the expression of its target gene, RelA. In addition, the glycolysis-promoting effect of miR-7 is mediated by increased expression of the cell surface glucose transporter, Glut3, whose expression is regulated by RelA. Decreasing cellular glucose uptake by silencing the Glut3 expression or inhibiting hexokinase, which is the enzyme that catalyzes the first step in glycolysis, diminished the cytoprotective effect of miR-7. These results suggest that miR-7 could help improve cellular bioenergetics and promote survival of dopaminergic neurons in PD.
EXPERIMENTAL PROCEDURES
Materials
MPP+ and 2-deoxy-d-glucose (2-DG), were purchased from Sigma. Non-targeting siRNA (siRNA-NT), siRNA-RelA, and siRNA-Glut3 were purchased from Thermo Scientific. Scrambled microRNA control (miR-SC), miR-7, anti-miR negative control, and anti-miR-7 were purchased from Ambion. Lentiviral vector pLemiR-pri-miR-7-2 (lenti-miR-7) and miR-SC (lenti-miR-SC) containing turboRFP reporter, as well as pGIPz-shRNA-RelA (lenti-shRNA-RelA) and control shRNA (lenti-shRNA-NT) constructs, were purchased from Open Biosystems.
Animals
All animals were housed and handled in accordance with the Institutional Animal Care guidelines of Rutgers Robert Wood Johnson Medical School. C57BL/6J mice purchased from The Jackson Laboratory were used in this study.
Cell Culture
SH-SY5Y cells and HEK293T cells were cultured in DMEM (Life Technologies) containing 25 mm glucose supplemented with 10% FBS (Life Technologies). For experiments in low glucose medium, SH-SY5Y cells were maintained in DMEM containing 5 mm glucose.
The human neural progenitor cell line, ReNcell VM cell line, was purchased from Millipore. To maintain their proliferating state, these cells were grown in DMEM/F12 (1:1) (Thermo Scientific) supplemented with B-27 supplement (Life Technologies), GlutaMAX (Life Technologies), 10 units/ml heparin (Sigma), 50 μg/ml gentamicin (Life Technologies), 20 ng/ml basic FGF (PeproTech), and 20 ng/ml EGF (PeproTech). These cells were differentiated into dopaminergic neurons by the pre-aggregation differentiation protocol (16). In brief, cells were cultured in non-coated flasks for 7 days to allow for the formation of neurospheres. Aggregates were then collected and dissociated by trituration and seeded on laminin-coated plates with medium without basic FGF and EGF, supplemented with 1 mm dibutyryl-cAMP (Santa Cruz Biotechnologies) and 2 ng/ml glial cell-derived neurotropic factor (GDNF) (PeproTech). Experiments were conducted after 2 weeks of differentiation. Primary mouse cortical neurons were isolated and cultured as described previously (12). Experiments were performed after 10 days of differentiation.
Transfections
Pre-miR, anti-miR and siRNA transfections were performed using Lipofectamine RNAiMAX (Life Technologies) according to the manufacturer's protocol. Lipofectamine 2000 (Life Technologies) was used for plasmid transfections according to the manufacturer's instructions.
Lentivirus Production and Transduction
HEK293T cells were used for production of lentivirus as described previously (15). Lentiviral vector pLemiR encodes human pri-miR-7-2 and Turbo Red fluorescent protein (tRFP) within a bicistronic transcript, which allows easy tracking of miR-expressing cells. Concentrated virus (1 × 10⁹ transduction units/ml) was used to infect ReNcell VM cells at a multiplicity of infection of 10.
ATP/ADP Ratio Assay
Ratio of intracellular ATP to ADP was quantified using the ApoSENSOR ADP/ATP bioluminescent assay kit (BioVision) according to the manufacturer's protocol. In brief, background luminescence of each sample was measured using a Wallac Victor2 1420 multilabel counter. The total intracellular ATP was quantified by the addition of the reaction mixture, which contains the enzyme luciferase and its substrate, luciferin. ATP present in the samples is utilized for the luciferase-catalyzed conversion of luciferin to oxyluciferin with production of light, which was quantified by measuring the luminescence (value A). This was immediately followed by the addition of an ADP-converting enzyme that converts intracellular ADP to ATP and measurement of luminescence (value B). The second luminescence value (value B) represents light generated by total ADP and ATP present in the reaction mixture. After correcting for background luminescence, value A was subtracted from value B to calculate light generated by ADP alone, and ATP/ADP ratio was calculated.
Glucose and Lactic Acid Assays
Glucose remaining in the medium was quantified using glucose oxidase-peroxidase (Sigma) reaction coupled to oxidation of Amplex Red reagent (Life Technologies). Glucose present in the medium was converted to d-gluconic acid and H2O2 by glucose oxidase. The H2O2 produced in this reaction was then utilized in the conversion of Amplex Red to resorufin by peroxidase. Resorufin is a colored product whose absorbance, measured at 560 nm, is proportional to the amount of glucose present in the medium. Glucose consumption by cells was calculated by subtracting the amount of glucose present in cell culture medium from that present in the medium without any cells. Lactic acid produced in the medium was quantified using a lactic acid assay kit (Sigma) according to the manufacturer's protocol.
Pyruvate Kinase Activity Assay
Pyruvate kinase activity was measured using a pyruvate kinase activity assay kit (Sigma) according to the manufacturer's protocol. Enzyme activity was normalized to total protein content in each sample.
Cell Viability Assay
Cell viability was measured using CellTiter 96 aqueous 3-(4,5-dimethylazol-2-yl)-5-(3-carboxymethoxyphenyl)-2-(4-sulfophenyl)-2H-tetrazolium (MTS) reagent (Promega) according to the manufacturer's instructions.
RNA Extraction and Quantitative Real-time PCR (qPCR)
RNA was extracted using the miRNeasy mini kit (Qiagen) followed by reverse transcription to synthesize cDNA using SuperScript III (Life Technologies) according to the manufacturer's protocol. The SYBR® select master mix (Life Technologies) was used for qPCR performed in an Applied Biosystems 7500 real-time PCR system. 18S rRNA was used as an internal control. The following primers were used: Glut1-forward, 5′-CCGGGGTCCTATAAACGCTAC-3′, Glut1-reverse, 5′-CGTCGTTTGGTCTCCTGCTC-3′; Glut3-forward, 5′-TGCCTTTGGCACTCTCAACCAG-3′, Glut3-reverse, 5′-GCCATAGCTCTTCAGACCCAAG-3′; Glut4-forward, 5′-TAGGCTCCGAAGATGGGGAA-3′, Glut4-reverse, 5′-CACCTTCTGAGGGGCATTGA-3′; regulator of oxidative phosphorylation cytochrome c oxidase assembly protein (SCO2)-forward, 5′-CTTCACTCACTGCCCTGACA-3′; SCO2-reverse, 5′-CGGTCAGACCCAACAGTCTT-3′; enolase 1 (Eno1)-forward, 5′-CTGTATCGCCACATTGCTCAGC-3′, Eno1-reverse, 5′-AGCTTGTTGCCAGCATGAGAGC-3′; pyruvate dehydrogenase kinase 4 (PDK4)-forward, 5′-AAGTGGCCATGTGAAGAGGG-3′, PDK4-reverse, 5′-GGAGTTTTCGTTGCTGTCGT-3′; and phosphoglycerate kinase 1 (PGK1)-forward, 5′-CCGCTTTCATGTGGAGGAAGAAG-3′, PGK1-reverse, 5′-CTCTGTGAGCAGTGCCAAAAGC-3′.
Western Blot Analysis
Western blot analysis was performed as described previously (15). Briefly, cells were lysed in PBS buffer containing 1% sodium dodecyl sulfate with protease and phosphatase inhibitors and sonicated for 10 s. Protein concentration was determined using the BCA protein assay reagent (Thermo Scientific). Proteins were resolved on a 4–20% SDS-PAGE gel and transferred onto PVDF membrane. The following primary antibodies were used: anti-RelA (Santa Cruz Biotechnology, catalog number sc-372) and anti-β actin (Sigma-Aldrich, catalog number A5316). The following secondary antibodies were used: horseradish peroxidase-conjugated anti-rabbit (R&D Systems, catalog number HAF008) or anti-mouse antibody (R&D Systems, catalog number HAF007). Western blots were quantified by densitometry using ImageJ (National Institutes of Health). Band intensity of RelA was measured using ImageJ and normalized to β-actin.
Measurement of Neurite Length
Mouse primary neurons transduced with lenti-miR-SC or lenti-miR-7 were imaged using a Zeiss Axiovert 2000 fluorescent microscope. Images were converted to 8-bit grayscale using the National Institutes of Health ImageJ software. Length of neurite from the perimeter of the cell body to the tip was measured using the NeuronJ plugin (17). Twenty neurons were measured for each sample, yielding an average of 45 neurites per sample.
TUNEL Assay
TUNEL assay was performed using the In Situ cell death detection kit, fluorescein (Roche Applied Science) according to the manufacturer's protocol. In brief, after fixation and permeabilization, cells were incubated with TUNEL reaction mixture at 37 °C for 1 h in a humidified chamber. Coverslips were then washed in PBS, stained with DAPI, and mounted. Coverslips were imaged using a Zeiss Axiovert 2000 fluorescent microscope. The number of cells that were both TUNEL-positive (green) and tRFP-positive (representing successful transduction of lenti-miR-SC or lenti-miR-7) were counted in four different microscopic fields including 10–20 infected neurons for each sample.
Statistical Analysis
Data were representative of three sets of independent experiments performed in triplicates for each group. Data are presented as means ± S.E. and were analyzed by two-way analysis of variance followed by Bonferroni's post hoc test unless otherwise stated. Level of significance was set at p < 0.05.
RESULTS
miR-7 Increases Intracellular ATP Production
In a recent study, we demonstrated that miR-7 protects neuronal cells against MPP+-induced cytotoxicity by targeting the 3′-UTR of RelA mRNA and repressing its expression (15). MPP+ inhibits complex I of the mitochondrial electron transport chain, leading to decreased ATP production. The inability to meet the energy requirements of cellular processes ultimately results in cell death. As overexpression of miR-7 is cytoprotective, we investigated whether miR-7 overexpression can also increase ATP production, thereby helping cells to satisfy their energy demands and improve cell survival.
SH-SY5Y cells were transfected with miR-7 or miR-SC. Forty-eight hours after transfection, cells were treated with two different concentrations of MPP+ for 6 h, and intracellular ATP/ADP ratio was measured. As expected, MPP+ decreased ATP/ADP ratio in a dose-dependent manner (Fig. 1A). Interestingly, overexpression of miR-7 in un-challenged SH-SY5Y cells resulted in a striking increase of ATP/ADP ratio, indicating that miR-7 promotes ATP production, as compared with cells transfected with miR-SC (Fig. 1A). The increase in ATP/ADP ratio in cells overexpressing miR-7 was maintained even after MPP+ treatment. As miR-7 targets RelA expression (15), we next investigated whether RelA knockdown also increases ATP production. Indeed, transfection of siRNA targeting RelA also resulted in a similar increase in ATP/ADP ratio that was also maintained after cells were exposed to MPP+ (Fig. 1B). To confirm that miR-7 or knockdown of RelA expression can increase ATP production in post-mitotic neuronal cells, differentiated ReNcell VM cells were used. ReNcell VM cells are an immortalized human ventral mesencephalic neural progenitor cell line that can be differentiated into dopaminergic neurons (16). Similar to SH-SY5Y cells, overexpression of miR-7 or knockdown of RelA using lentiviral constructs in differentiated ReNcell VM cells led to an increase in ATP/ADP ratio that was sustained even after MPP+ challenge (Fig. 1, C and D). Further, the MTS assay showed that cell death during the 6-h MPP+ treatment was negligible (data not shown), ensuring that quantification of ATP/ADP ratio was not confounded by differences in cell viability. These results suggest that miR-7 increases ATP production, possibly by down-regulating RelA expression.
FIGURE 1.
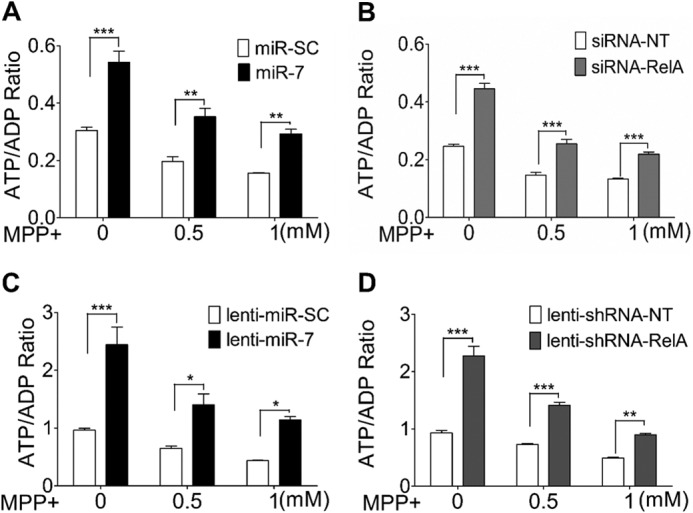
Overexpression of miR-7 or knockdown of RelA increases ratio of intracellular ATP/ADP. A and B, effect of miR-7 or siRNA-RelA on intracellular ATP/ADP ratio in SH-SY5Y cells. SH-SY5Y cells were transfected with miR-SC or miR-7 (A) and siRNA-NT or siRNA-RelA (B). Forty-eight hours after transfection, cells were treated with the indicated concentrations of MPP+ for 6 h, followed by an ATP/ADP ratio assay. C and D, effect of miR-7 or knockdown of RelA expression on intracellular ATP/ADP ratio in ReNcell VM cells. Differentiated ReNcell VM cells were transduced with lenti-miR-SC or lenti-miR-7 (C) and lenti-shRNA-NT or lenti-shRNA-RelA (D). Three days after transduction, cells were treated with the indicated concentrations of MPP+ for 6 h, followed by an ATP/ADP ratio assay. Data are presented as means ± S.E. *, p < 0.05, **, p < 0.01, ***, p < 0.001. These results are representative of three separate experiments.
miR-7 Promotes Glycolysis through Down-regulating RelA Expression
As MPP+ blocks oxidative phosphorylation, miR-7-induced increase in ATP production could result from enhancing other metabolic pathways such as glycolysis. To assess glycolysis, we measured glucose consumption and lactic acid production in SH-SY5Y cells. Indeed, overexpression of miR-7 significantly increased both glucose consumption and lactic acid production (Fig. 2, A and C). Treatment with MPP+ also resulted in a concentration-dependent increase in glucose consumption and lactic acid production, which is consistent with previous studies (8), likely representing a defensive mechanism by cells in the face of inefficient mitochondrial ATP production upon MPP+ challenge. Cells overexpressing miR-7, however, further increased their glucose consumption and lactic acid production even after MPP+ treatment (Fig. 2, A and C). Similarly, knockdown of RelA also increased glucose consumption and lactic acid production, which were maintained after MPP+ challenge as well (Fig. 2, B and D).
FIGURE 2.

Overexpression of miR-7 or knockdown of RelA increases glycolysis. A–D, effect of miR-7 or siRNA-RelA on glucose consumption and lactic acid production in SH-SY5Y cells. Cells were transfected with miR-SC or miR-7 (A and C) and siRNA-NT or siRNA-RelA (B or D). Forty-eight hours after transfection, cells were treated with the indicated concentrations of MPP+ for 6 h followed by determination of glucose (A and B) and lactic acid (C and D) concentration in the medium. E–H, effect of miR-7 or shRNA-RelA on glucose consumption and lactic acid production in ReNcell VM cells. Differentiated ReNcell VM cells were transduced with lenti-miR-SC or lenti-miR-7 (E and G) and lenti-shRNA-NT or lenti-shRNA-RelA (F and H). Three days after transduction, cells were treated with the indicated concentrations of MPP+ for 6 h followed by determination of glucose (E and F) and lactic acid (G and H) concentration in the medium. Data are presented as means ± S.E. **, p < 0.01, ***, p < 0.001. These results are representative of three separate experiments.
To confirm our findings in post-mitotic neuronal cell, ReNcell VM cells were transduced with lentivirus expressing miR-7 or a control lentivirus. Three days after transduction, cells were treated with increasing concentrations of MPP+ for 6 h, followed by measurements of glucose consumption and lactic acid in the culture medium. As observed in SH-SY5Y cells, miR-7 overexpression increased glucose consumption and lactic acid production (Fig. 2, E and G), suggesting that miR-7 promotes glycolysis in differentiated neuronal cells as well. Knockdown of RelA by infecting lentivirus expressing shRNA-RelA also promoted glycolysis in ReNcell VM cells (Fig. 2, F and H). Similar to SH-SY5Y cells, miR-7- or shRNA-RelA-induced increase in glucose consumption and lactic acid production was sustained even after exposure of ReNcell VM cells to MPP+ (Fig. 2, E–H).
To determine whether miR-7-mediated increase in glycolysis was a result of increase in glycolytic enzyme activity, we measured the pyruvate kinase activity in SH-SY5Y cells. Pyruvate kinase catalyzes the final step of glycolysis and represents an important control site. Pyruvate kinase catalyzes the irreversible conversion of phosphoenolpyruvate (P-enolpyruvate) to pyruvate. Overexpression of miR-7 or knockdown of RelA resulted in statistically significant increase in pyruvate kinase activity (Fig. 3, A and B), although not as dramatic as in other glycolytic parameters (ATP/ADP ratio, glucose consumption, and lactic acid production) (Figs. 1 and 2). Pyruvate kinase activity is allosterically regulated by fructose 1,6-bisphosphate, P-enolpyruvate, and ATP (18, 19). Although fructose 1,6-bisphosphate and P-enolpyruvate increase pyruvate kinase activity (19, 20), high ATP level decreases it (19). The glycolysis-promoting effect of miR-7 leads to increase in fructose 1,6-bisphosphate, P-enolpyruvate, and ATP inside the cell. As these mediators have opposing effects on pyruvate kinase activity, the net result of the end-point assay may, therefore, reflect only a modest change in enzyme activity.
FIGURE 3.
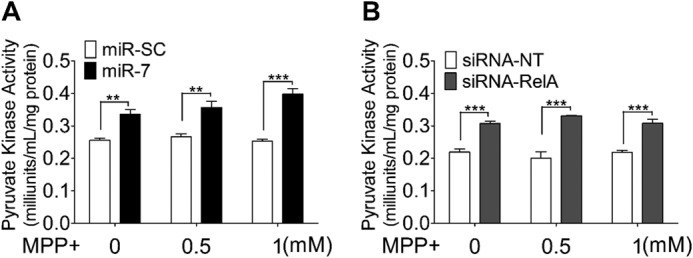
Overexpression of miR-7 or knockdown of RelA leads to modest increase in pyruvate kinase activity. A and B, SH-SY5Y cells were transfected with miR-SC or miR-7 (A) and siRNA-NT or siRNA-RelA (B). After 48 h, cells were treated with the indicated concentrations of MPP+ for 6 h, and pyruvate kinase activity was measured. Data are presented as means ± S.E. **, p < 0.01, ***, p < 0.001. These results are representative of three separate experiments.
To assess the role of endogenously expressed miR-7 in enhancing glycolysis, anti-miR-7, a single-stranded oligonucleotide designed to specifically bind to and inhibit endogenous miR-7, was used to determine ATP/ADP ratio, glucose consumption, and lactic acid production. Cells transfected with anti-miR-7 showed significantly greater reduction in ATP/ADP ratio upon exposure to MPP+, as compared with cells transfected with anti-scrambled control (Fig. 4A). In addition, glucose consumption and lactic acid production were significantly reduced in anti-miR-7 transfected cells after MPP+ treatment (Fig. 4, B and C), suggesting that endogenously expressed miR-7 promotes glycolysis under physiological conditions. Further, it is worth noting that transfection of anti-miR-7 did not block the dose-dependent increase in glucose consumption and lactic acid production upon MPP+ treatment (Fig. 4, B and C), suggesting that miR-7 and MPP+ promote glycolysis via distinct mechanisms.
FIGURE 4.
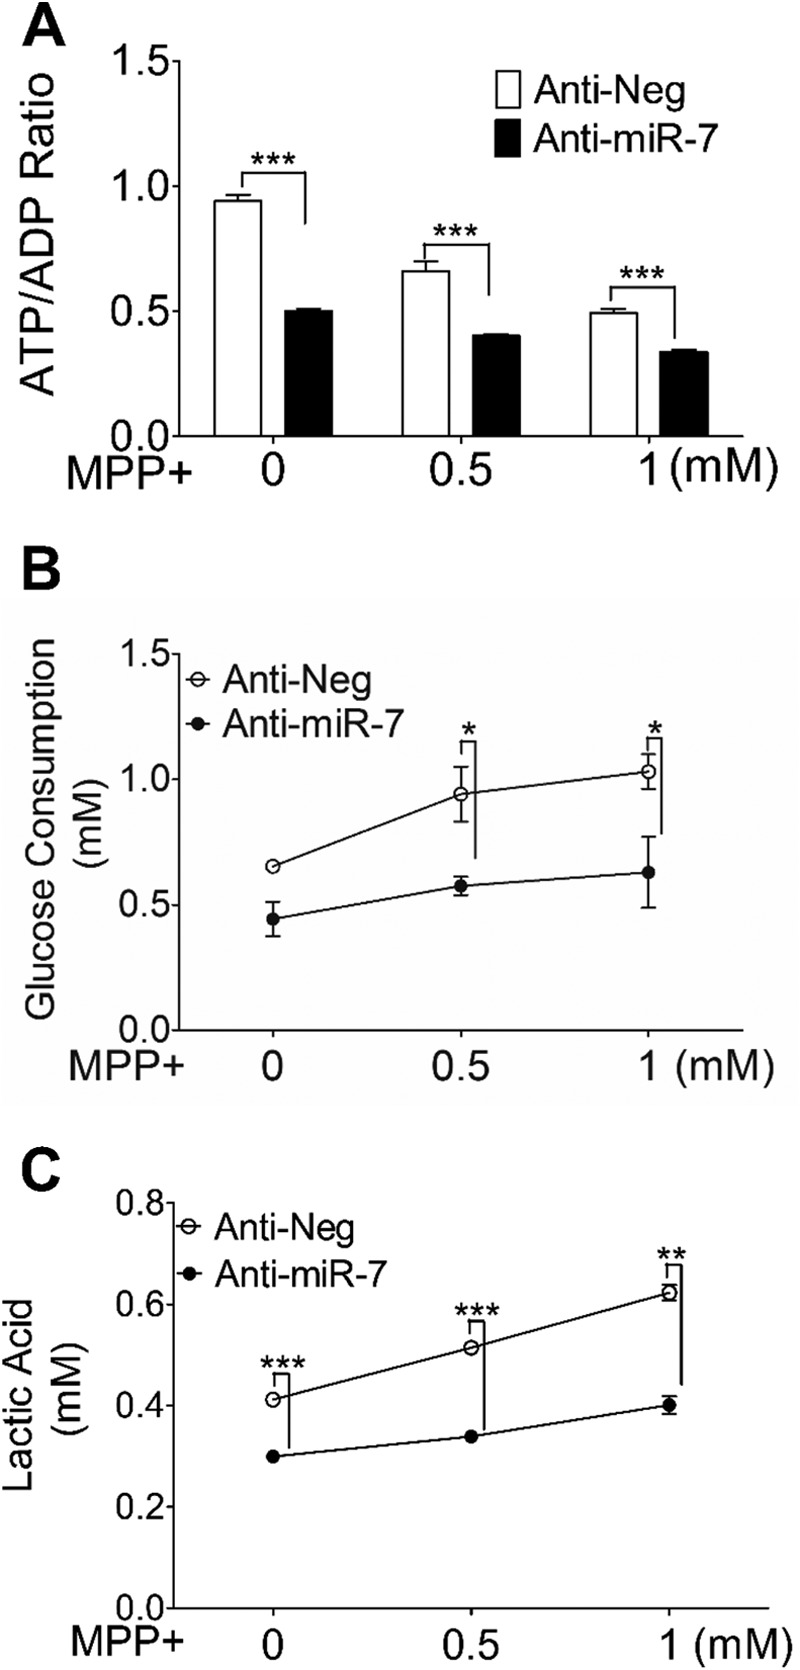
Inhibition of endogenous miR-7 results in suppression of glycolysis. SH-SY5Y cells were transfected with anti-miR-7 or anti-miR negative control (Anti-Neg). After 48 h, cells were treated with the indicated concentrations of MPP+ for 6 h. A–C, intracellular ATP/ADP ratio (A), glucose consumption (B), and lactic acid concentration (C) in the medium were determined. Data are presented as means ± S.E. *, p < 0.05, **, p < 0.01, ***, p < 0.001. These results are representative of three separate experiments.
To investigate whether miR-7-mediated down-regulation of RelA underlies the glycolysis-promoting effect of miR-7, we overexpressed a RelA construct lacking the 3′-UTR (and therefore unable to be down-regulated by miR-7) along with miR-7 or miR-SC. Transfection of miR-7 along with a control vector resulted in increased glucose consumption (Fig. 5A) and lactic acid production (Fig. 5B), similar to that observed with miR-7 alone. Concomitant overexpression of RelA, however, abrogated the glycolysis-promoting activity of miR-7. These results demonstrate that the glycolysis-promoting effect of miR-7 requires down-regulation of RelA.
FIGURE 5.
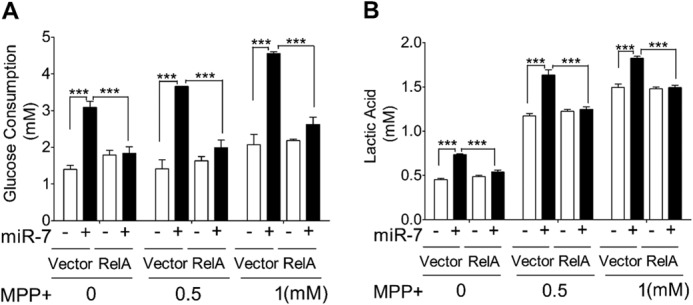
Overexpression of RelA lacking its 3′-UTR abrogates the glycolysis-promoting activity of miR-7. SH-SY5Y cells were transfected with miR-SC or miR-7 along with 2×FLAG-pCDNA3.1-RelA (RelA) or 2×FLAG-pcDNA3.1 control vector (vector) as indicated. A and B, glucose consumption (A) and lactic acid concentrations (B) in the medium were determined. Data are presented as means ± S.E. ***, p < 0.001. These results are representative of three separate experiments.
miR-7 Increases Expression of the Glucose Transporter Glut3
To elucidate the molecular mechanism by which miR-7 enhances glycolysis, we examined the expression levels of genes that affect glycolytic rate. The following genes that regulate glycolysis were selected for qPCR analysis based on previous studies suggesting their regulation by RelA/NF-κB (21): the glucose transporters Glut1, -3, -4, and -5; the glycolytic enzymes Eno1 and PGK1; the glycolysis regulator PDK4; and SCO2. Among the genes tested, expression of Glut1, Glut4, Eno1, PGK1, and SCO2 did not show any significant change with miR-7 overexpression (Fig. 6A) or RelA knockdown (Fig. 6B). Glut5 expression was negligible in SH-SY5Y cells and was, therefore, not considered for further analysis. Only expression of Glut3 was found to increase significantly following overexpression of miR-7 (Fig. 6A) or knockdown of RelA (Fig. 6B). In addition, successful down-regulation of RelA after transfection of miR-7 or siRNA-RelA was confirmed by qPCR (data not shown). Elevation of Glut3 level might help the efficient uptake of glucose from the medium and increases the rate of glycolysis. Indeed, knocking down the expression of Glut3, in part, abrogated the cytoprotective effect of miR-7 (Fig. 6C), suggesting that the protective effect of miR-7 exerts partly through up-regulation of Glut3 via repressing RelA expression. Knocking down the expression of Glut3 by siRNA-Glut3 was confirmed by qPCR (Fig. 6D).
FIGURE 6.

Overexpression of miR-7 or knockdown of RelA increases expression of the glucose transporter Glut3. A and B, SH-SY5Y cells were transfected with miR-SC or miR-7 (A) and siRNA-NT or siRNA-RelA (B). After 48 h, cells were harvested, followed by RNA extraction and qPCR to quantify expression of glycolytic genes Glut1, Glut3, Glut4, Eno1, PGK1, PDK4, and SCO2. C, SH-SY5Y cells were co-transfected as indicated. After 48 h, cells were treated with 2 mm MPP+ for 24 h. Cell viability was quantified using the MTS assay. D, qPCR data showing efficiency of Glut3 knockdown after transfection of siRNA-Glut3. For A, B, and C, data were analyzed using two-way analysis of variance followed by Bonferroni's post hoc test. For D, data were analyzed using Student's t test. Data are presented as means ± S.E. ***, p < 0.001. These results are representative of three separate experiments.
Inhibition of Glycolysis Results in Loss of miR-7-mediated Protection
Considering that miR-7 protects cells against MPP+ through promoting glycolysis, we expect that lowering glucose concentration in the medium will abolish the protective effects of miR-7. To test this hypothesis, we cultured SH-SY5Y cells in medium containing 5 mm glucose (low glucose medium). Reducing glucose concentration alone for several passages was not toxic to cells (data not shown). However, the protective effect of miR-7 against MPP+ was abrogated when cells were cultured in low glucose medium (Fig. 7A). In addition, the cytoprotection against MPP+ offered by silencing RelA expression was also abrogated by culturing cells in low glucose medium (Fig, 7B). Decreased RelA protein level after transfection of miR-7 and siRNA-RelA in high glucose or low glucose medium was confirmed by Western blot (Fig. 7, C–F). To confirm this finding in post-mitotic neuronal cells, we treated differentiated ReNcell VM cells with 2-DG, a glucose analog that inhibits hexokinase and blocks glycolysis. Consistently, the cytoprotection against MPP+ seen with miR-7 overexpression (Fig. 8A) or RelA silencing (Fig. 8B) was lost when cells were cultured with 2-DG. To confirm this effect of miR-7 in primary neurons, mouse primary cortical neurons were transduced with lenti-miR-SC or lenti-miR-7, and then cells were exposed to MPP+ in the absence or presence of 2-DG. Neurotoxicity was assessed by measuring neurite length and TUNEL assay. Indeed, miR-7-expressing neurons were protected from this neurotoxic effect of MPP+ as evidenced by significantly longer neurites, as compared with miR-SC-expressing neurons (Fig. 8, C and D), which is consistent with our previous study (15) as well as with the lower number of TUNEL-positive cells (Fig. 8, E and F). However, when glycolysis was inhibited by 2-DG, a significant decrease in neurite length and a significant increase in the number of TUNEL-positive cells were observed even in the miR-7-expressing neurons (Fig. 8, C–F), indicating that a functional glycolysis pathway is required for miR-7-induced neuroprotection. Exposure to 2-DG alone for 24 h did not alter neuron morphology, neurite length, or cell viability. Taken together, these data indicate that miR-7 promotes glycolysis by targeting RelA, and subsequently leads to protection against MPP+.
FIGURE 7.

Protective effect of miR-7 overexpression or RelA knockdown is lost when glucose availability is limited. A and B, SH-SY5Y cells were cultured in the medium containing 25 mm (high) (H) or 5 mm (low) (L) glucose. Cells were transfected with miR-SC or miR-7 (A) and siRNA-NT or siRNA-RelA (B). After 48 h, cells were treated with the indicated concentrations of MPP+ for 24 h. Cell viability was quantified using the MTS assay. C and D, representative Western blots showing that transfection of miR-7 or siRNA-RelA decreases RelA protein level. β-Actin was used as loading control. E and F, quantification of RelA protein level from three independent experiments represented in C and D. Band density was measured to quantify RelA protein level relative to β-actin expression level using ImageJ. Data are presented as means ± S.E. *, p < 0.05, **, p < 0.01, ***, p < 0.001. These results are representative of three separate experiments.
FIGURE 8.

Inhibition of glycolysis abrogates the protective effect of miR-7 overexpression or RelA knockdown. A and B, differentiated ReNcell VM cells were transduced with lenti-miR-SC or lenti-miR-7 (A) and lenti-shRNA-NT or lenti-shRNA-RelA (B). After 3 days, cells were treated with 5 mm 2-DG along with the indicated concentrations of MPP+ for 24 h. Cell viability was quantified using the MTS assay. C and D, representative images (C) and quantification (D) of neurite length of mouse primary cortical neurons transduced with lenti-miR-SC or lenti-miR-7 and treated with 1 mm MPP+ and 5 mm 2-DG for 24 h, as indicated. Neurons infected with lenti-miR-SC or lenti-miR-7 are shown as tRFP-positive. E and F, representative images (E) and quantification (F) of TUNEL assay. The number of cells that were both tRFP-positive and TUNEL-positive were counted (white arrows) and represented as a percentage of the total number of tRFP-positive cells in four microscopic fields for each sample. Data are presented as means ± S.E. ***, p < 0.001. These results are representative of three separate experiments.
DISCUSSION
In the present study, we have elucidated a novel neuroprotective mechanism of miR-7. We show that miR-7 enhances glycolysis and enables neuronal cells to meet their energy requirement when oxidative phosphorylation is inhibited by MPP+. This increase in glycolysis is achieved by the activity of miR-7 to repress RelA expression and subsequently increase in Glut3 expression. Furthermore, we demonstrate that the availability of glucose as substrate and a functional glycolytic pathway are both essential for the cytoprotective effect of miR-7.
miR-7 is highly expressed in the brain, including in tyrosine hydroxylase-positive dopaminergic neurons in the substantia nigra (15), and appears to regulate key neuronal functions such as neuronal differentiation and neurite outgrowth (22). Silencing of miR-7 function in the mouse embryonic cortex results in impaired cortical development (23). Additionally, miR-7 has been shown to protect neuronal cells in several models of PD. The first identified neuroprotective mechanism of miR-7 was through down-regulation of α-synuclein by targeting the 3′-UTR of its mRNA (12). Subsequently, miR-7 was found to protect against MPP+-induced cell death by activating the mammalian target of rapamycin (mTOR) pathway (14) and by relieving MPP+-induced NF-kB suppression via down-regulating the NF-κB subunit, RelA (15).
The glycolysis-promoting activity of miR-7 appears to be particularly important in the brain, where glucose is primarily utilized for the generation of ATP as energy source (24, 25). In healthy and resting neurons, the level of activity of glycolytic enzymes is maintained far below their maximum potential. Hexokinase activity, for example, is kept at 97% inhibited state (25). As a result, tricarboxylic acid (TCA) cycle and oxidative phosphorylation can completely catabolize glucose to generate ATP. However, the reported defects in mitochondrial oxidative phosphorylation in PD (4, 5) could suggest that, in this pathological condition, neurons become increasingly dependent on glycolysis for ATP production. Consistently, neuronal cells try to increase their ATP production by enhancing the rate of glycolysis as a self-protective response upon MPP+ exposure (8). Further, MPTP administration to mice also increases glycolysis as evidenced by elevated lactate levels in the striatum (26). However, neuronal cells eventually die despite this self-protective response, possibly due to the limited supply of ATP from inefficient glycolysis in the pathological condition. A larger and more persistent increase in glycolysis would prolong cell survival and, thus, help halt or slow neuronal degeneration. Enhancing glycolysis by miR-7 may, therefore, provide a new therapeutic approach in PD. Our data demonstrate that miR-7 not only increases the basal rate of glycolysis but also maintains this enhanced glycolytic rate and ATP production in neuronal cells after treatment with MPP+. Additionally, MPP+-induced increase in glycolysis was still observed even after significant increase of glycolytic rate by miR-7 overexpression, suggesting that miR-7 and MPP+ promote glycolysis via independent mechanisms. Inhibition of endogenous miR-7 led to a decrease in ATP production, glucose consumption, and lactic acid production, indicating that endogenous miR-7 also promotes glycolysis. However, inhibition of miR-7 did not block MPP+-induced increase in glycolysis, further supporting our inference that miR-7 and MPP+ enhance glycolysis through separate pathways.
miR-7 promotes glycolysis by repressing its target RelA. In accordance with our findings, previous studies have demonstrated that knockdown of RelA facilitates switchover from oxidative phosphorylation to glycolysis (21). To elucidate the mechanism by which miR-7 and/or down-regulation of RelA increases glycolysis, we determined the level of several RelA-regulated genes that may affect glycolysis. These include the glycolysis regulator PDK4 (27) that phosphorylates and inactivates pyruvate dehydrogenase and, therefore, reduces the rate of glycolysis; the glycolytic enzymes PGK1 and Eno1 (28) that catalyze the conversion of 1,3-diphosphoglycerate to 3-phosphoglycerate and of 2-phosphoglycerate to P-enolpyruvate, respectively; the regulator of oxidative phosphorylation SCO2 that helps in the biogenesis and assembly of cytochrome c oxidase II; and the glucose transporters Glut1 (29), Glut3 (21), Glut4 (30), and Glut5 (31). Among these genes, only expression of Glut3, the major neuronal cell surface glucose transporter (32), was found to be increased following overexpression of miR-7 or knockdown of RelA. Up-regulation of Glut3, therefore, helps to increase glucose uptake in neuronal cells, thus providing more substrate to drive the glycolytic flux forward.
The molecular mechanism by which miR-7 increases Glut3 expression remains to be further elucidated. Previous studies have demonstrated that RelA can directly bind to the Glut3 promoter (33) and repress Glut3 transcription in the presence of p53 (34). As p53 is expressed in SH-SY5Y cells (35), RelA appears to act as a transcriptional repressor of Glut3 in these cells. This transcriptional repression of Glut3 could be relieved by miR-7 through down-regulation of RelA.
Finally, we show that when glucose availability is limited, or when glycolysis is inhibited, miR-7 overexpression or RelA knockdown is not able to protect cells from MPP+-induced cell death. This demonstrates that glycolysis is central to the cytoprotective effect of miR-7. Consistent with our findings, inhibition of glycolysis with administration of the hexokinase inhibitor 2-DG to mice exacerbated MPTP-induced ATP depletion in the striatum (36). Interestingly, glycolysis also plays a neuroprotective role in α-synuclein-mediated toxicity. For example, blocking glycolysis with 2-DG aggravated α-synuclein-induced dopaminergic neuron loss in Caenorhabditis elegans (37), and knocking down the glycolytic enzyme, glucose phosphate isomerase (GPI), exacerbated α-synuclein neurotoxicity, whereas overexpression of glucose phosphate isomerase rescued dopaminergic neurons in C. elegans, Drosophila, and mice (37). These studies indicate that an intact glycolytic pathway is necessary for neuronal survival and that a dysfunctional glycolytic pathway may worsen the cellular bioenergetic deficit in PD. Taken together, our studies suggest that the glycolysis-promoting effect of miR-7 could be beneficial in PD.
This work was supported by National Institutes of Health Grant NS070898 (to E. J.).
- PD
- Parkinson disease
- 2-DG
- 2-deoxy-d-glucose
- Eno1
- enolase1
- miR-7
- microRNA-7
- miR-SC
- scrambled microRNA control
- MPP+
- 1-methyl-4-phenylpyridinium
- MPTP
- 1-methyl-4-phenyl-1,2,3,6-tetrahydropyridine
- MTS
- 3-(4,5-dimethylazol-2-yl)-5-(3-carboxymethoxyphenyl)-2-(4-sulfophenyl)-2H-tetrazoleum
- NF-κB
- nuclear factor κB
- PDK4
- pyruvate dehydrogenase kinase 4
- P-enolpyruvate
- phosphoenolpyruvate
- PGK1
- phosphoglycerate kinase 1
- qPCR
- quantitative real-time PCR
- SCO2
- regulator of oxidative phosphorylation cytochrome c oxidase assembly protein
- tRFP
- turbo red fluorescent protein
- siRNA-NT
- non-targeting siRNA
- lenti
- lentiviral.
REFERENCES
- 1. Exner N., Lutz A. K., Haass C., Winklhofer K. F. (2012) Mitochondrial dysfunction in Parkinson's disease: molecular mechanisms and pathophysiological consequences. EMBO J. 31, 3038–3062 [DOI] [PMC free article] [PubMed] [Google Scholar]
- 2. Dias V., Junn E., Mouradian M. M. (2013) The role of oxidative stress in Parkinson's disease. J. Parkinsons Dis. 3, 461–491 [DOI] [PMC free article] [PubMed] [Google Scholar]
- 3. Subramaniam S. R., Chesselet M. F. (2013) Mitochondrial dysfunction and oxidative stress in Parkinson's disease. Prog. Neurobiol. 106–107, 17–32, 10.1016/j.pneurobio.2013.04.004 [DOI] [PMC free article] [PubMed] [Google Scholar]
- 4. Schapira A. H., Cooper J. M., Dexter D., Clark J. B., Jenner P., Marsden C. D. (1990) Mitochondrial complex I deficiency in Parkinson's disease. J. Neurochem. 54, 823–827 [DOI] [PubMed] [Google Scholar]
- 5. Keeney P. M., Xie J., Capaldi R. A., Bennett J. P., Jr. (2006) Parkinson's disease brain mitochondrial complex I has oxidatively damaged subunits and is functionally impaired and misassembled. J. Neurosci. 26, 5256–5264 [DOI] [PMC free article] [PubMed] [Google Scholar]
- 6. Langston J. W., Ballard P., Tetrud J. W., Irwin I. (1983) Chronic Parkinsonism in humans due to a product of meperidine-analog synthesis. Science 219, 979–980 [DOI] [PubMed] [Google Scholar]
- 7. Bates T. E., Heales S. J., Davies S. E., Boakye P., Clark J. B. (1994) Effects of 1-methyl-4-phenylpyridinium on isolated rat brain mitochondria: evidence for a primary involvement of energy depletion. J. Neurochem. 63, 640–648 [DOI] [PubMed] [Google Scholar]
- 8. Mazzio E., Soliman K. F. (2003) The role of glycolysis and gluconeogenesis in the cytoprotection of neuroblastoma cells against 1-methyl 4-phenylpyridinium ion toxicity. Neurotoxicology 24, 137–147 [DOI] [PubMed] [Google Scholar]
- 9. Junn E., Mouradian M. M. (2012) MicroRNAs in neurodegenerative diseases and their therapeutic potential. Pharmacol. Ther. 133, 142–150 [DOI] [PMC free article] [PubMed] [Google Scholar]
- 10. Harraz M. M., Dawson T. M., Dawson V. L. (2011) MicroRNAs in Parkinson's disease. J. Chem. Neuroanat. 42, 127–130 [DOI] [PMC free article] [PubMed] [Google Scholar]
- 11. Yelamanchili S. V., Fox H. S. (2010) Defining larger roles for “tiny” RNA molecules: role of miRNAs in neurodegeneration research. J. Neuroimmune Pharmacol. 5, 63–69 [DOI] [PMC free article] [PubMed] [Google Scholar]
- 12. Junn E., Lee K. W., Jeong B. S., Chan T. W., Im J. Y., Mouradian M. M. (2009) Repression of α-synuclein expression and toxicity by microRNA-7. Proc. Natl. Acad. Sci. U.S.A. 106, 13052–13057 [DOI] [PMC free article] [PubMed] [Google Scholar]
- 13. Doxakis E. (2010) Post-transcriptional regulation of α-synuclein expression by mir-7 and mir-153. J. Biol. Chem. 285, 12726–12734 [DOI] [PMC free article] [PubMed] [Google Scholar]
- 14. Fragkouli A., Doxakis E. (2014) miR-7 and miR-153 protect neurons against MPP+-induced cell death via upregulation of mTOR pathway. Front. Cell. Neurosci. 8, 182. [DOI] [PMC free article] [PubMed] [Google Scholar]
- 15. Choi D. C., Chae Y. J., Kabaria S., Chaudhuri A. D., Jain M. R., Li H., Mouradian M. M., Junn E. (2014) MicroRNA-7 protects against 1-methyl-4-phenylpyridinium-induced cell death by targeting RelA. J. Neurosci. 34, 12725–12737 [DOI] [PMC free article] [PubMed] [Google Scholar]
- 16. Donato R., Miljan E. A., Hines S. J., Aouabdi S., Pollock K., Patel S., Edwards F. A., Sinden J. D. (2007) Differential development of neuronal physiological responsiveness in two human neural stem cell lines. BMC Neurosci. 8, 36. [DOI] [PMC free article] [PubMed] [Google Scholar]
- 17. Meijering E., Jacob M., Sarria J. C., Steiner P., Hirling H., Unser M. (2004) Design and validation of a tool for neurite tracing and analysis in fluorescence microscopy images. Cytometry A. 58, 167–176 [DOI] [PubMed] [Google Scholar]
- 18. Valentini G., Chiarelli L., Fortin R., Speranza M. L., Galizzi A., Mattevi A. (2000) The allosteric regulation of pyruvate kinase: a site-directed mutagenesis study. J. Biol. Chem. 275, 18145–18152 [DOI] [PubMed] [Google Scholar]
- 19. Jurica M. S., Mesecar A., Heath P. J., Shi W., Nowak T., Stoddard B. L. (1998) The allosteric regulation of pyruvate kinase by fructose-1,6-bisphosphate. Structure 6, 195–210 [DOI] [PubMed] [Google Scholar]
- 20. Mattevi A., Bolognesi M., Valentini G. (1996) The allosteric regulation of pyruvate kinase. FEBS Lett. 389, 15–19 [DOI] [PubMed] [Google Scholar]
- 21. Mauro C., Leow S. C., Anso E., Rocha S., Thotakura A. K., Tornatore L., Moretti M., De Smaele E., Beg A. A., Tergaonkar V., Chandel N. S., Franzoso G. (2011) NF-κB controls energy homeostasis and metabolic adaptation by upregulating mitochondrial respiration. Nat. Cell Biol. 13, 1272–1279 [DOI] [PMC free article] [PubMed] [Google Scholar]
- 22. Chen H., Shalom-Feuerstein R., Riley J., Zhang S. D., Tucci P., Agostini M., Aberdam D., Knight R. A., Genchi G., Nicotera P., Melino G., Vasa-Nicotera M. (2010) miR-7 and miR-214 are specifically expressed during neuroblastoma differentiation, cortical development and embryonic stem cells differentiation, and control neurite outgrowth in vitro. Biochem. Biophys. Res. Commun. 394, 921–927 [DOI] [PubMed] [Google Scholar]
- 23. Pollock A., Bian S., Zhang C., Chen Z., Sun T. (2014) Growth of the developing cerebral cortex is controlled by microRNA-7 through the p53 pathway. Cell Rep. 7, 1184–1196 [DOI] [PMC free article] [PubMed] [Google Scholar]
- 24. Chih C. P., Roberts E. L., Jr. (2003) Energy substrates for neurons during neural activity: a critical review of the astrocyte-neuron lactate shuttle hypothesis. J. Cereb. Blood Flow Metab. 23, 1263–1281 [DOI] [PubMed] [Google Scholar]
- 25. Clarke D. D., Sokoloff S. L. (1999) Circulation and energy metabolism of the brain. in Basic Neurochemistry: Molecular, Cellular and Medical Aspects (Siegel G. J, Agranoff B. W., Albers R. W., et al., eds), 6th Ed., pp. 637–669, Lippincott-Raven, Philadelphia [Google Scholar]
- 26. Koga K., Mori A., Ohashi S., Kurihara N., Kitagawa H., Ishikawa M., Mitsumoto Y., Nakai M. (2006) 1H MRS identifies lactate rise in the striatum of MPTP-treated C57BL/6 mice. Eur. J. Neurosci. 23, 1077–1081 [DOI] [PubMed] [Google Scholar]
- 27. Planavila A., Laguna J. C., Vázquez-Carrera M. (2005) Nuclear factor-κB activation leads to down-regulation of fatty acid oxidation during cardiac hypertrophy. J. Biol. Chem. 280, 17464–17471 [DOI] [PubMed] [Google Scholar]
- 28. Carter K. L., Cahir-McFarland E., Kieff E. (2002) Epstein-Barr virus-induced changes in B-lymphocyte gene expression. J. Virol. 76, 10427–10436 [DOI] [PMC free article] [PubMed] [Google Scholar]
- 29. Sommermann T. G., O'Neill K., Plas D. R., Cahir-McFarland E. (2011) IKKβ and NF-κB transcription govern lymphoma cell survival through AKT-induced plasma membrane trafficking of GLUT1. Cancer Res. 71, 7291–7300 [DOI] [PMC free article] [PubMed] [Google Scholar]
- 30. Silva J. L., Giannocco G., Furuya D. T., Lima G. A., Moraes P. A., Nachef S., Bordin S., Britto L. R., Nunes M. T., Machado U. F. (2005) NF-κB, MEF2A, MEF2D and HIF1-a involvement on insulin- and contraction-induced regulation of GLUT4 gene expression in soleus muscle. Mol. Cell. Endocrinol. 240, 82–93 [DOI] [PubMed] [Google Scholar]
- 31. Hinz M., Lemke P., Anagnostopoulos I., Hacker C., Krappmann D., Mathas S., Dörken B., Zenke M., Stein H., Scheidereit C. (2002) Nuclear factor κB-dependent gene expression profiling of Hodgkin's disease tumor cells, pathogenetic significance, and link to constitutive signal transducer and activator of transcription 5a activity. J. Exp. Med. 196, 605–617 [DOI] [PMC free article] [PubMed] [Google Scholar]
- 32. Vannucci S. J., Maher F., Simpson I. A. (1997) Glucose transporter proteins in brain: delivery of glucose to neurons and glia. Glia 21, 2–21 [DOI] [PubMed] [Google Scholar]
- 33. Kawauchi K., Araki K., Tobiume K., Tanaka N. (2008) p53 regulates glucose metabolism through an IKK-NF-κB pathway and inhibits cell transformation. Nat. Cell Biol. 10, 611–618 [DOI] [PubMed] [Google Scholar]
- 34. Kawauchi K., Araki K., Tobiume K., Tanaka N. (2008) Activated p53 induces NF-κB DNA binding but suppresses its transcriptional activation. Biochem. Biophys. Res. Commun. 372, 137–141 [DOI] [PubMed] [Google Scholar]
- 35. Cui H., Schroering A., Ding H. F. (2002) p53 mediates DNA damaging drug-induced apoptosis through a caspase-9-dependent pathway in SH-SY5Y neuroblastoma cells. Mol. Cancer Ther. 1, 679–686 [PubMed] [Google Scholar]
- 36. Chan P., Langston J. W., Irwin I., DeLanney L. E., Di Monte D. A. (1993) 2-Deoxyglucose enhances 1-methyl-4-phenyl-1,2,3,6-tetrahydropyridine-induced ATP loss in the mouse brain. J. Neurochem. 61, 610–616 [DOI] [PubMed] [Google Scholar]
- 37. Knight A. L., Yan X., Hamamichi S., Ajjuri R. R., Mazzulli J. R., Zhang M. W., Daigle J. G., Zhang S., Borom A. R., Roberts L. R., Lee S. K., DeLeon S. M., Viollet-Djelassi C., Krainc D., O'Donnell J. M., Caldwell K. A., Caldwell G. A. (2014) The glycolytic enzyme, GPI, is a functionally conserved modifier of dopaminergic neurodegeneration in Parkinson's models. Cell Metab. 20, 145–157 [DOI] [PMC free article] [PubMed] [Google Scholar]