

Abstract
The generation of antigen-specific reagents is a significant bottleneck in the study of complex pathogens that express many hundreds to thousands of different proteins or to emerging or new strains of viruses that display potential pandemic qualities and therefore require rapid investigation. In these instances the development of antibodies for example can be prohibitively expensive to cover the full pathogen proteome, or the lead time may be unacceptably long in urgent cases where new highly pathogenic viral strains may emerge. Because genomic information on such pathogens can be rapidly acquired this opens up avenues using mass spectrometric approaches to study pathogen antigen expression, host responses and for screening the utility of therapeutics. In particular, data-independent acquisition (DIA) modalities on high-resolution mass spectrometers generate spectral information on all components of a complex sample providing depth of coverage hitherto only seen in genomic deep sequencing. The spectral information generated by DIA can be iteratively interrogated for potentially any protein of interest providing both evidence of protein expression and quantitation. Here we apply a solely DIA mass spectrometry based methodology to profile the viral antigen expression in cells infected with vaccinia virus up to 9 h post infection without the need for antigen specific antibodies or other reagents. We demonstrate deep coverage of the vaccinia virus proteome using a SWATH-MS acquisition approach, extracting quantitative kinetics of 100 virus proteins within a single experiment. The results highlight the complexity of vaccinia protein expression, complementing what is known at the transcriptomic level, and provide a valuable resource and technique for future studies of viral infection and replication kinetics. Furthermore, they highlight the utility of DIA and mass spectrometry in the dissection of host-pathogen interactions.
Systems biology strives to provide a holistic understanding of biological processes such as signaling pathways, gene expression, protein-protein interactions and changes induced by environmental stimuli or microorganisms (1). Investigations of the latter are particularly important when considering pathogenic infections, as increasing our understanding of host-pathogen responses may help guide and tailor therapeutics (2, 3). Traditionally, this information has been determined using a panel of biological reagents, for example, monoclonal antibodies, which often require considerable lead-time to develop and frequently lack the desired specificity. Genomics and proteomics form the foundation of systems biology: genomics techniques can for example provide high-throughput next-generation sequencing of genomes and information on transcriptional expression and regulation (4). Conversely, proteomics applications have tended to be less high throughput and lack the depth of coverage obtained using the amplification steps of the genomics technologies. Thus, proteomics techniques do not always profile all gene expression and proteome coverage by mass spectrometry is limited to the degree of fractionation and number of liquid chromatography/tandem MS (LC-MS/MS)1 experiments performed.
Mass spectrometry is a key component of proteomics, being used to identify and quantify proteins and peptides. When coupled with LC, mass spectrometry has the capability to delve deep into a cellular proteome. However, in contrast to genomics, the challenge of obtaining the “complete proteome” of a cell or organism is significantly more daunting (5): proteins may be expressed in differing isoforms and undergo post-translational modifications, vastly increasing the complexity of information beyond simply translating a DNA sequence. Furthermore, proteins are expressed across large dynamic ranges, calling for highly sensitive techniques for their detection and quantification. Thus advances in sample preparation, instrumentation and analysis techniques are required to attain deeper coverage of biological samples.
Data-dependent acquisition mass spectrometry (DDA; also known as information-dependent acquisition, IDA) has long been the standard approach to achieve high sequence coverage through shotgun proteomics experiments. Peptide ions are selected and fragmented based on their precursor ion intensity, generating MS/MS spectra that are paired to the precursor ion and can be analyzed by computational algorithms against databases to assign the originating peptide amino acid sequence. These methods are highly successful, especially with the advances in resolution and speed found in leading instrumentation, and when coupled with sample fractionation for deeper coverage. Although DDA techniques can achieve quantitative analysis of a subset of proteins, for example, through label-free analysis or stable isotope tagging (6), the current gold-standard method of quantification is by multiple reaction monitoring (MRM; or selected reaction monitoring, SRM) (7, 8). In this technique, known precursor and product ion pairs (transitions) are screened by the mass spectrometer for detection. This dual level of selectivity provides high sensitivity and specificity and, when coupled to spiked internal isotopic standards, provides absolute quantitation of peptide abundance (9).
Despite these advantages, DDA and targeted MRM methods have their drawbacks. The sampling process of DDA is stochastic and a typical shotgun proteomics experiment generates far more spectral information than can be sampled and analyzed by standard DDA techniques because of restrictions in the number of parent ions selected for MS/MS at any given time (10, 11). Conversely, although MRM experiments can now be multiplexed to cover thousands of transitions per experiment, a prerequisite knowledge of the peptides you wish to detect and significant time can go into developing and optimizing the experimental parameters for the MRM transitions (8). Recently, there have emerged several advances to high-resolution mass spectrometry instruments that aim to overcome the above-mentioned drawbacks through marrying together aspects of DDA and targeted MRM. Data-independent acquisition (DIA) collects both the MS1 and MS/MS information, but the fragmented MS/MS spectra are collected independent of any selection criteria. Instead, MS1 windows are opened sequentially and all precursor ions within each window are fragmented and detected (12, 13). This generates complete fragment ion maps of a sample and, when coupled to on-line liquid chromatography separation, can be theoretically used to detect all MS-amenable peptides within a sample.
SWATH-MS is a form of DIA enabled on an SCIEX TripleTOF® 5600+ system, where the mass spectrometer cycles through consecutive precursor m/z windows (termed SWATHs; typically ∼25 Da each) across a defined mass range, fragmenting all ions from each window. When coupled to an MS1 scan within each cycle, this data generates time-resolved spectra enabling the post-acquisition extraction of MS1 and corresponding MS/MS ions to create MRM-like transition chromatograms. These can then be used both for identification and quantification of peptides of interest, with sensitivity reaching that of MRM and often of detecting peptides that are otherwise missed in traditional DDA experiments (13).
In the present study, we apply a SWATH-MS methodology in order to quantitatively map the proteome kinetics of a complex pathogen, vaccinia virus (VACV). VACV is most notable for its use as the smallpox vaccine, but recombinants have since been widely utilized for many biological applications including gene delivery and as vaccine vectors. VACV is the ideal candidate for this study, being a large and complex double-stranded DNA virus encoding more than 200 open reading frames. Previous comprehensive studies of VACV kinetics have focused on transcriptional analyses including microarrays and RNAseq (14–17). At the proteomics level, studies of VACV protein expression have been somewhat limited: Chou et al. present deep coverage (136 proteins) of the VACV proteome following extensive fractionation of infected HEK293T cells, although this was restricted to a single time point post infection (18); Chou et al. and others have also focused on the identification of host proteins modulated upon infection (18, 19); structural components of the virion have also been analyzed (20–22) and finally, several groups have strived to define virus-virus or virus-host protein-protein interactions (23–25). The present study provides a considerable advance in the field of VACV proteomics through mapping the detailed kinetics of around half of the predicted VACV proteome during the first 9 h of in vitro infection using a single LC-SWATH-MS experiment per time point.
EXPERIMENTAL PROCEDURES
Cell Lines, Virus, and Infection
DC2.4 cells (a murine bone marrow-derived dendritic-like cell line) were a kind gift from Professor Kenneth Rock (University of Massachusetts Medical School) and were maintained in DMEM (Life Technologies, Victoria, Australia) supplemented with 10% fetal bovine serum (FBS), 2 mm glutamine, 50 IU/ml penicillin, and 50 μg/ml streptomycin (D10). BHK-21 and BS-C-1 cells were maintained in D10. VACV strains Western Reserve (VACV WR, ATCC #VR1354) were grown and titrated in BHK-21 and BS-C-1 cells respectively under DMEM with 2% FBS and 2 mm glutamine (D2) using standard methods. VACV WR was a kind gift of Bernard Moss (NIH, Bethesda, MD). DC2.4 cells were infected with VACV as previously described (26); briefly, 108 cells per time point were washed twice with DMEM and infected at a MOI of 10 in 2 ml of DMEM in round-bottom tubes for 30 min at 37 °C with shaking. After this time the cells were transferred to 50 ml tubes and 40 ml of warm DMEM supplemented with 2% FBS was added. Tubes were then incubated for the required time at 37 °C with slow rotation. Cells were counted at the end of each incubation to account for any loss because of infection, treated with psoralen and UV (27) to inactivate infectivity for transit, and then snap frozen.
Lysis, Protein Purification and Tryptic Digestion
Following cell lysis as previously described (26), lysate was reduced by addition of the reducing agent tris(2-carboxyethyl)phosphine (TCEP) at a final concentration of 5 mm and incubated at 60 °C for 30 min. 30 μl of sample was then loaded onto a Filter-Aided Sample Prep (FASP) column (28) (Expedeon, San Diego, CA) and alkylation and tryptic digestion of proteins carried out as per the manufacturer's instructions. ∼1 μg of each sample was analyzed using an SCIEX TripleTOF® 5600+ mass spectrometer operating in SWATH-MS acquisition mode as described below. Samples were analyzed as duplicate technical replicates.
SWATH-MS Acquisition
FASP tryptic digests were directly loaded onto a Nano cHiPLC trap column (200 μm x 0.5 mm ChromXP C18-CL 3 μm, 120 Å, Eksigent, Dublin, CA) column maintain an isocratic flow of loading buffer (0.1% formic acid, 2% acetonitrile) at 5 μl/min for 15 min and then separated using a NanoUltra analytical column (75 μm × 15 cm ChromXP C18-CL 3 μm, 120 Å, Eksigent) at a flow rate of 300 nL/min using the following buffer A (0.1% formic acid, 2% acetonitrile) and buffer B (0.1% formic acid, 80% acetonitrile) conditions: 2–15% B over 3 min, 15–50% B over 62 min, 50–80% B over 5 min, 8 min at 80% B, followed by a decrease back to baseline 2% B over 2 min and re-equilibration at these conditions for 10 min. Samples were analyzed by an SCIEX TripleTOF® 5600+ mass spectrometer by electrospray ionisation using an uncoated PicoTip™ emitter (New Objective Woburn, MA, stock #: FS360–20-10-N-20–7CT) with the system operating in SWATH-MS acquisition mode. Each cycle consisted of an initial MS1 scan of 300–1800 Da (200 msec accumulation time, positive ion mode), followed by sequential SWATH-MS windows of 25 Da (overlap of 1 Da) spanning the range of 300–1000 m/z and within each of these windows acquiring MS/MS data of 100–1800 m/z (100 msec accumulation time, positive ion mode). Raw data files have been deposited at PeptideAtlas (www.PeptideAtlas.org) with the following dataset identifiers: PASS00629 (timecourse 1; username is PASS00629, password CN6355gz) and PASS00628 (timecourse 2; username is PASS00628, password ZL5748eu). Samples were acquired in technical duplicates and data are representative of one technical replicate per timecourse.
LC-MS/MS Acquisition
Information-dependent analysis (IDA) of tryptic digests was carried out on an SCIEX TripleTOF® 5600+ mass spectrometer. Samples were injected and analyzed using identical liquid chromatography conditions as detailed above. MS parameters were set to a MS1 scan of 200–1800 Da (200 msec accumulation time, positive ion mode) coupled to IDA criteria of a charge state of 2–5 exceeding 40 cps set to trigger a MS/MS product ion scan of 100–1800 Da (150 msec accumulation time, positive ion mode).
LC-MRM
LC-MRM analysis was carried out to validate the identity and kinetic profile of a selection of 25 VACV proteins from the SWATH-MS dataset. FASP tryptic digests were directly loaded onto a Nano cHiPLC trap column (200 μm × 0.5 mm ChromXP C18-CL 3 μm, 120 Å, Eksigent) column maintain an isocratic flow of loading buffer (0.1% formic acid, 2% acetonitrile) at 5 μl/min for 15 min and then separated using a NanoUltra analytical column (75 μm × 15 cm ChromXP C18-CL 3 μm, 120 Å, Eksigent) at a flow rate of 300 nL/min using the following buffer A (0.1% formic acid, 2% acetonitrile) and buffer B (0.1% formic acid, 98% acetonitrile) conditions: 2–10% B over 2 min, 10–50% B over 42 min, 50–80% B over 3 min, 5 min at 80% B, followed by a decrease back to baseline 2% B over 1 min and re-equilibration at these conditions for 6 min. Samples were analyzed by an SCIEX QTRAP® 5500 mass spectrometer by electrospray ionisation using an uncoated PicoTip™ emitter (New Objective, stock #: FS360-20-10-N-20-7CT) with the system operating in MRM mode coupled to an IDA selection criteria of MRMs exceeding 1000 cps set to trigger an EPI scan (rolling collision energy calculated automatically according to the formula CE = (slope) * (m/z) + intercept, using the following variables: singly charged precursor (slope = 0.058; intercept = 9); doubly charged precursor (slope = 0.044; intercept = 5); triply charged precursor (slope = 0.05; intercept = 4)). MRM transitions were selected directly from the analyzed SWATH-MS data and exported from Skyline v2.5 (29). All data were analyzed in Skyline.
Peptide Sequence Identification
Spectral data from shotgun LC-MS/MS analyses of mock and infected samples were analyzed by ProteinPilot™ software v4.5 using the Paragon algorithm (SCIEX, Ontario, Canada), searching against a custom database of the complete VACV WR proteome appended to the proteome of Mus musculus (both proteome builds were taken from 2014_05 and manually appended to create a database of 51814 entries, including known contaminants such as keratin). Thorough ID mode was used, with the following settings: the enzyme specificity was set to trypsin (allowing for five missed cleavages), iodoacetamide treatment was selected (fixed carbamidomethyl cysteine modification) and variable biological modifications were allowed (for a full list refer to (30)). Precursor and product ion mass tolerances were automatically determined by ProteinPilot™ based upon the TripleTOF® 5600+ acquisition settings used to acquire the data. The searches included the automatic generation of a reversed sequence decoy database to calculate false discovery rates (FDR). One and 5% FDR cutoffs were used when analyzing the results (see text in the Results section) in order to calculate the threshold of confidence scores to select valid peptides (typically >95%).
Analysis of SWATH-MS Data
Data were analyzed using the open source software Skyline v2.5 (29). Full scan settings were applied to reflect the SWATH-MS acquisition parameters described above. For data analysis in the absence of a spectral library, in silico tryptic digests of the reference VACV WR proteome (viralzone.expasy.org) were selected based on 8–25 amino acids with zero missed cleavages or modifications in order to reduce the complexity of data analysis. Transition settings were y and b ions with doubly charged precursor states and six product ions with m/z > precursor −2. All cysteines were modified to carbamidomethyl cysteine because of treatment of the samples with iodoacetamide. The same settings were used in the presence of a spectral library, with the exception of allowing up to two missed cleavages and that precursor and product ions were preferentially selected based upon an ion match from the spectral library. The latter was generated through importing the ProteinPilot™ data from combined searches of all uninfected and infected samples. Data were analyzed using a combination of Skyline, Microsoft Excel and, for clustering analysis, the multiple experiment viewer (MeV; http://www.tm4.org/mev.html) (31). Normalization of protein loading across each time point was carried out by analyzing a panel of 61 murine peptides from seven abundant and stable mouse proteins (ACTG_MOUSE, TBB5_MOUSE, RL4_MOUSE, PDIA3_MOUSE, HS90B_MOUSE, HSP7C_MOUSE, and NUCL_MOUSE) (see main text below). The reciprocal of the mean intensity of all peptides relative to in the mock sample was used as a normalization factor for each time point.
Statistics
Pearson correlation coefficients were calculated using GraphPad Prism 6. For K-means clustering in the TM4: MeV suite, the following settings were used: a Pearson correlation for the distance metric, no selection for absolute distance, a calculation of k-means (not medians), and a maximum iteration of 50. Three through to 10 clusters were tested.
RESULTS
SWATH-MS Profiles Viral Antigen Expression During Infection in a Single LC-MS Analysis
We have previously studied the kinetics of VACV CD8+ T-cell epitope presentation in the murine C57BL/6-derived dendritic-like cell line DC2.4 and in the same study tracked the expression of eight VACV antigens by multiple reaction monitoring (MRM) (26). In the present study, we sought to significantly expand upon the kinetic profiling of this complex DNA virus' proteome through the use of the SWATH-MS modality of data-independent acquisition available on an SCIEX TripleTOF® 5600+ mass spectrometer. Drawing on our previous data, we reasoned that the majority of viral protein synthesis is complete within the first 10 h post infection (hpi) in vitro and so we focused our analysis within that time frame. Two sets of VACV-infected DC2.4 data were acquired and analyzed by SWATH-MS (all data are representative of one of two technical replicates per timecourse): the first was taken from the same sample lysates that served for the epitope study above (26) (timepoints of 0.5, 3.5, 6.5 and 9.5 hpi, alongside a mock-infected control); the second was a new timecourse of cells infected at two-hourly intervals (0.5, 2.5, 4.5, 6.5 and 8.5 hpi) aimed to provide a combined higher resolution of temporal expression. All cell lysates were subjected to reduction, alkylation and tryptic digestion using the FASP method as described previously (26, 28). Digested proteins from each time point were run on an SCIEX TripleTOF® 5600+ system operating in SWATH-MS acquisition mode, spanning 25 m/z windows from 300–1000 m/z with an initial MS1 scan of 300–1800 m/z. Parallel analyses were also carried out using IDA parameters to afford downstream spectral library generation (see Fig. 1 for experimental workflow) from pooled sample spectra.
Fig. 1.
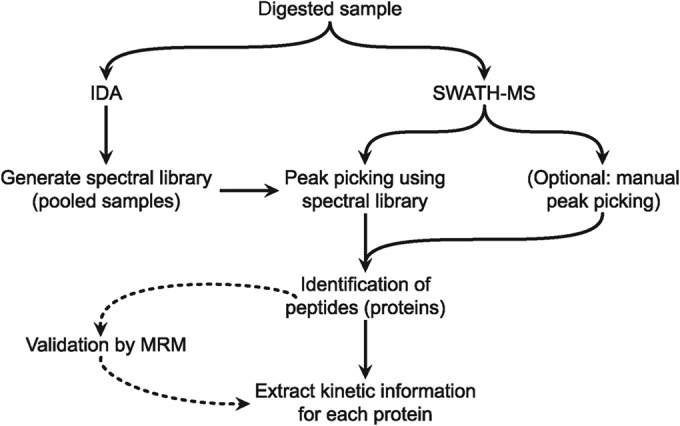
SWATH-MS workflow. Sample workflow for processing of virus-infected cells for SWATH-MS analysis. Dotted line indicates that MRM validation is deemed optional.
Fig. 2A highlights the complexity of a single SWATH-MS run, showing the total ion chromatogram (TIC) across each SWATH-MS window from a sample taken at 6.5 hpi. Initial validation of the data set was performed by searching for the precursor and product ions of a selection of known abundant tryptic peptides derived from murine proteins. These proteins were selected based on their previous characterization in cells infected with VACV (26). Figs. 2B–2E illustrates this process for the tryptic peptide YLTVAAVFR derived from the murine tubulin beta-5 chain protein. Manual analysis of the mock-infected sample shows detection of three distinct extracted ion chromatogram (XIC) peaks corresponding to the doubly charged precursor mass (m/z 520.3004) of YLTVAAVFR. An analysis of the MS1 data from each of these peaks showed that only the latter 24.1 min peak contained a charge series closely matching the expected mass for this peptide (Δmass of 0.0014), alongside many co-eluting species (Fig. 2C). Given the precursor m/z of YLTVAAVFR, the SWATH window of 500–525 m/z would be expected to contain MS/MS fragment spectra from this peptide, but would also contain spectra from all of the other precursor peptides whose m/z falls within this isolation region. Inspection of this window (Fig. 2D) confirmed the presence of fragment ions corresponding to this peptide. To aid and expedite this analysis, the specific extraction of chromatographic information for all predicted product ions of a specific peptide is possible through the open source software Skyline (29). Following peptide sequence input (e.g. through direct insertion or in silico digestion of a protein), SWATH-MS data can be searched rapidly for co-eluting precursor and product ions yielding XIC traces much like those generated by MRM experiments. This is illustrated in Fig. 2E, which shows a chromatographic trace for the detection of y ions derived from the same peptide, YLTVAAVFR. The co-eluting peaks at the retention time of 24 min is highly indicative of the detection of this peptide, whereas single (or just several overlapping) y-ion peaks is because of other peptide species sharing one or more precursor>product pairs. Therefore, the more overlapping, co-eluting traces detected, the higher the confidence can be placed in this being a positive signal. In the example given in Fig. 2E, the information revealed in Skyline can be traced back and validated through the corresponding MS1 and MS/MS spectra (Figs. 2B–2D) to confirm the peptide. Furthermore, given that this type of analysis generates chromatographic, MRM-like traces, they can therefore be used to extract quantitative information across different samples.
Fig. 2.

SWATH-MS acquisition to analyze virus-infected cellular proteomes. A, MS/MS total ion chromatograms (TIC) from each SWATH-MS window from a single sample (mock). (Inset: MS1 TIC from the same sample). B, Extracted MS1 ion chromatogram (XIC) of doubly charged precursor target mass 520.3004 ± 0.01 for the murine peptide YLTVAAVFR from SWATH-MS analysis of mock infection. C, MS1 scan from mock infected sample at 24.1 min, highlighting the SWATH-MS window that encompasses the target mass of 520.3004. (Inset: Zoomed in region showing high-resolution of target mass isotope series highlighted in red). D, MS/MS region of SWATH-MS window 500–525 m/z at 24.1 min in mock-infected sample. Product ions from peptide YLTVAAVFR are highlighted in red. E, Skyline-mediated extraction of overlapping precursor-product ions corresponds to peptide YLTVAAVFR in mock-infected sample. F, XIC traces for the doubly charged precursor mass of VACV peptides DESSIYVILK and VLLLTPEVASLR across mock and infected (6.5 h) samples. G, Zoomed MS/MS regions around target masses 583.8 and 655.9 corresponding to VACV peptides DESSIYVILK and VLLLTPEVASLR, respectively, comparing mock and infected (6.5 h) samples. Isotope series of both VACV peptides are highlighted in red in the infected sample. H, MS/MS regions of SWATH-MS windows 575–600 and 650–675 encompassing the doubly charged precursor masses for VACV peptides DESSIYVILK and VLLLTPEVASLR, respectively. Data are from infected (6.5 h) samples and taken from the time windows corresponding to the peak of the XIC trace for each peptide. Select product ions are highlighted in red. I, Skyline-mediated extraction of overlapping precursor-product ions corresponds to VACV peptides DESSIYVILK and VLLLTPEVASLR. Data are shown for mock and infected (6.5 h) for comparison.
The parallel generation of a spectral library offers the advantages of identifying and defining peptide fragmentation information that greatly aids in the peak picking during post-acquisition analysis of SWATH-MS data. However, we reasoned that given the experimental setup of virus infection, it would be possible to detect unique virus peptides in the absence of prior spectral information. To test this, we interrogated mock versus 6.5 hpi samples, as these should clearly show the absence and presence of signal data originating from viral peptides. Prior experiments using shotgun proteomics found an abundance of peptides derived from various late-stage and structural components of the virus (data not shown). Two such VACV peptides were investigated by the same in silico method applied to the TBB5_MOUSE peptide YLTVAAVFR described above: the A-type inclusion protein A25 (ATI_VACCW) and the telomere-binding protein I1 (I1_VACCW) tryptic peptides DESSIYVILK and VLLLTPEVASLR, respectively (Fig. 2F–2I). Prominent XIC peaks were detected for both peptides in infected but not mock samples (Fig. 2F), with corresponding precursor masses only found in infected samples (Fig. 2G). MS/MS data confirmed the presence of ions corresponding to these peptides within the appropriate SWATH-MS window and retention time during infection (Fig. 2H), whereas no such MS/MS data was observed in mock samples (not shown). Finally, a Skyline-based analysis could be used to rapidly detect co-eluting product ions that were clearly present during infection but totally absent from the uninfected cells (Fig. 2I). This analysis was confirmed for additional peptides derived from the same VACV proteins (data not shown).
SWATH-MS Postacquisition Analysis is Aided by the Use of a Spectral Library
The data in Fig. 2 panels 2E and 2I show that it is possible to detect peptides from SWATH-MS data without the requirement to input a spectral library. However, although this process is feasible there are drawbacks in the inherent risk of false positives (e.g. a host protein up-regulated upon infection with a peptide that shares the same spectral fingerprint as a virus peptide) and, on a practical level, the time-consuming nature of manually picking and assigning the correct peaks to each peptide within a protein. For these reasons, we chose to use the parallel IDA LC-MS/MS analyses to generate a global spectral library containing both murine and VACV peptide and protein identifications assigned by the ProteinPilot™ algorithm. (Such an IDA-coupled SWATH-MS approach has been demonstrated previously for studying metabolism in yeast (13)). Using a 1% false discovery rate (FDR) cut-off, 75 VACV proteins (35% of the virus proteome) were identified from the first timecourse (0.5–9.5 hpi with 3 h intervals) and 95 VACV proteins (44% of the virus proteome) from the second timecourse (0.5–8.5 hpi with 2 h intervals) (see supplemental Tables S1 and S2). Given that a mock infection (negative control) was used to compare SWATH-MS datasets, we chose to relax the FDR threshold to a 5% cut-off, yielding a total of 76 and 101 total VACV proteins identified for the two timecourses, respectively (note that 87% of the VACV proteins found in the first timecourse were found in the second timecourse). These data were combined to generate a global spectral library and imported into Skyline. The total VACV WR proteome was then digested in silico with trypsin, with cysteine residues modified to carbamidomethyl cysteine, and valid peptides automatically selected based upon their presence within the spectral library. Following importation of each SWATH-MS data file, peak picking was automated through the fragmentation information obtained from the spectral library and, given that the SWATH-MS and IDA runs were carried out using the same mobile phase gradient and highly reproducible CHiP-LC-MS based chromatography, contained an important additional level of confidence through matched retention times. Fig. 3 shows representative spectral library and SWATH-MS data for tryptic peptides derived from six VACV proteins, comparing mock versus infected cells.
Fig. 3.

Skyline-based detection of SWATH-MS-acquired tryptic peptides is aided by the generation of a spectral library. A Skyline spectral library was generated from the ProteinPilot™ analysis of pooled mock and vaccinia-infected samples that had been subjected to IDA mass spectrometry. The post-acquisition analysis of SWATH-MS data was carried out for tryptic peptides from six vaccinia proteins: K1_VACCW, DPOL_VACCW, PROF_VACCW, A11_VACCW, B2-VACCW, and ATI_VACCW. Peak picking was automated based upon the presence of information within the spectral library (left panels), with an allowed retention time window of 5 min. Spectral information is shown for the mock (middle panels) versus infected (6.5 h post infection, right panels) samples. * Indicates the presence of the target peptide.
Extraction of Kinetic Information from SWATH-MS Data
Because of the MRM-like nature of the SWATH-MS chromatographic traces generated by Skyline, it is possible to extract the area under the curve of each trace and then use this to compare the relative amount of peptide at each kinetic time point. Fig. 4 illustrates this for three different vaccinia proteins: the early gene product E3L (E3_VACCW, Fig. 4A), known to sequester dsRNA produced during infection, the late gene product A6L (A6_VACCW, Fig. 4B) that aids maturing virions, and the late gene product structural protein A25L (ATI_VACCW, Fig. 4C). Fig. 4A shows SWATH-MS traces for mock, 0.5, 2.5, 4.5, 6.5 and 8.5 hpi samples for the tryptic peptide SFDDVIPAK from protein E3_VACCW, with the appearance of the peptide at 2.5 hpi. Although no absolute abundance information can be obtained from this type of analysis, it is possible to compare the relative kinetics of each peptide by deriving and overlaying the percentage of maximal expression. The four detectable tryptic peptides from this protein all show a similar pattern when plotted together in this manner (Fig. 4A, lower), and Figs. 4B and 4C demonstrate the same principle for proteins A6_VACCW and ATI_VACCW, with each protein following a distinct kinetic pattern. As an additional validation, a selection of 25 vaccinia proteins were analyzed by LC-MRM (n = 74 peptides) and compared with the data obtained by SWATH-MS on the same sample (supplemental Fig. S1). These data show that the relative kinetics of each protein gave highly reproducible results when measured by MRM and SWATH-MS. The LC-MRM method also included a triggered MS/MS scan that was used to further confirm the identification of each peptide (data not shown).
Fig. 4.

Kinetic analysis of VACV protein expression from SWATH-MS data. A, Example SWATH-MS data extracted for the tryptic peptide SFDDVIPAK from vaccinia protein E3_VACCW across a timecourse of infection. Upper panels show raw intensity traces for the product ions y7, y6, y5, y4, y3, and b2. The lower panel shows summed peak areas expressed as a percentage of max expression for each of the detected tryptic peptides from E3_VACCW. B, Kinetic profile (as percentage of max expression) for each of the detected tryptic peptides from vaccinia protein A6_VACCW. C, Kinetic profile (as percentage of max expression) for each of the detected tryptic peptides from vaccinia protein ATI_VACCW. All data shown is raw and has not been normalized to murine protein levels.
However, for a kinetic analysis of this type, it is also important to take into account any differences in sample preparation and total protein amount that was loaded onto the mass spectrometer. For this, we have opted to use a similar approach to that which we used previously when comparing antigen and epitope kinetics (26). The relative levels of 61 tryptic peptides derived from seven abundant and stable mouse proteins (ACTG_MOUSE, TBB5_MOUSE, RL4_MOUSE, PDIA3_MOUSE, HS90B_MOUSE, HSP7C_MOUSE and NUCL_MOUSE) were quantified post-acquisition from the same SWATH-MS datasets and used to generate an average protein amount per sample, relative to the mock infected control (supplemental Fig. S2). Only minor differences were observed across the timecourses, with the most notable decrease in protein amount detected at the later timepoints, most likely because of the decreased cell viability at these stages as a consequence of the advanced stage of virus replication. This information could therefore then be used to normalize the signal obtained from each VACV protein.
Kinetic Analysis of Vaccinia Virus Proteome Expression by SWATH-MS
Using the in silico digested VACV WR proteome in combination with the spectral library obtained from the parallel IDA analyses and the normalization described above, we have generated the relative kinetic profiles for each of the 101 VACV proteins (Fig. 5 and supplemental Table S3). For proteins where multiple tryptic peptides were quantified, the average was taken so that a single line could be plotted per protein. To aid the analysis of these data, we grouped proteins with similar kinetics of expression by applying a K-means cluster analysis (32) using the Multiple Experiment Viewer (MeV) software (http://www.tm4.org/mev.html; (31)). Four clusters were found necessary and sufficient to adequately separate all groups with similar kinetics. The average expression of all proteins within a cluster creates four distinct phases: cluster 1 shows a rapid onset of expression, peaking around 3.5–4.5 hpi, followed by a steady decline; cluster 2 has a similar onset but more sustained expression throughout the timecourse; proteins within cluster 3 are slower to be detected and peak at around 6.5 hpi; finally, proteins within cluster 4 all show slower expression still, and are still peaking at the end of the timecourse. Individual proteins were color-coded according to the kinetic classification of each protein's transcript (15, 16) as follows: intermediate and late classified proteins were labeled as I and L, respectively, whereas proteins classified as early (E) were subclassified according to the proposed split of E1.1 and E1.2 genes (15). Fig. 5A shows the clustering for the first timecourse, and Fig. 5B shows the clustering for the second timecourse. Both showed similar patterns of early classified proteins within the first two clusters, and a preponderance of intermediate and late classified proteins in the latter two clusters. The previous suggestion of a E1.1 and E1.2 segregation based on transcript data was also apparent in the SWATH-proteome analysis, with more E1.1 proteins present in the first cluster. Although there is much similarity between the transcriptomic and our proteomic analysis, the differences reinforce the importance of knowing protein levels, because these will be driving the infection.
Fig. 5.

Cluster analysis of the detectable VACV proteome. The normalized kinetic profiles of the detected vaccinia proteins from the first (A) and second (B) timecourses were subjected to K-means clustering analysis by the software MeV. Four clusters were found to be the best fit for both datasets. Proteins were color coded based on the temporal assignment of their corresponding RNA transcripts (see 15, 16), along with an average expression line for each cluster. Bar graphs show the relative percentage of proteins falling into each temporal classification within each cluster.
DISCUSSION
The aim of systems biology is to gain a holistic insight into the complexity of biological processes and interactions, aiming to enhance our understanding of fundamental aspects of biology such as signaling pathways, networks, and regulatory mechanisms that govern genes, their transcription and translation into proteins (1, 33, 34). At the forefront of this expanding field are genomics, metabolomics and proteomics. Deep coverage is desirable in any of these fields and is particularly important for proteomics given the inherit complexity within a proteome created by, for example, differences of orders of magnitude across protein abundance values, post translational modifications, and alternatively spliced transcripts. It is therefore desirable to drill as deep as possible into a proteome, while also acquiring data with sufficient integrity such as to allow quantitative profiling. Traditional shotgun LC-MS/MS experiments are limited in both of these areas because of relying upon information-dependent selection of precursor ions, in most cases limiting the analysis to only the most abundant peptide species. Although there have been great advances in recent years to provide faster MS/MS acquisition, the reality is that current IDA experiments are still only sampling a fraction of the MS-amenable proteome (11). Data-independent acquisition, however, does not suffer these drawbacks as the mass spectrometer indiscriminately allows ions through for fragmentation, theoretically giving you access to all of the analyte ions. These data can then be mined for both discovery and quantitative purposes.
Here we have demonstrated this process by applying SWATH-MS data-independent acquisition to study the kinetics of vaccinia virus proteome expression during the in vitro infection of the mouse dendritic-like cell line DC2.4. Although Chou et al. provided deeper coverage of the VACV proteome (in human HEK293T cells), their analysis was restricted to a single time point post infection in the presence or absence of the DNA replication inhibitor AraC to differentiate early and late gene expression (18); here we present the most detailed study of virus protein kinetics to date, with temporal kinetics tracked at a high resolution of two-hourly intervals. Given the presence of a mock-infected control, we have also shown that it is possible to carry out manual VACV peptide identification and peak picking, using stringent criteria, without the need for a spectral library. However, this process was greatly enhanced through the use of the latter, generated by the parallel IDA analysis of the same samples, a concept recently demonstrated by Gillet et al. (13). Although the IDA data we collected was from the same samples, this is not necessary, as the primary information required is simply the knowledge of the proteotypic tryptic peptides, their fragmentation spectra and retention times - i.e. this information can be gathered from previous samples, be they the same or different, or iterated upon over time by continually adding to the information within a spectral library. Thus, if sample is limiting, it can be used directly for a single DIA experiment, with the post-acquisition analysis drawing upon any number of previous samples that have been banked as spectral libraries (including the use of retention time alignment by internal reference peptides (35)), or generated from synthetic peptides
The data collected from the SWATH-MS analysis tracked 101 proteins of a total of 216 putative ORFs for the VACV proteome (∼47% coverage). Because of the use of the FASP protocol for the processing of these samples, it is likely that many proteins (>30, based upon predicted size) may have been lost because of their molecular weight falling below the cut-off of the filter used in the FASP spin column (28). An increase in VACV protein IDs can also be gained through the use of in-solution tryptic digests, coupled to extensive fractionation to provide deeper coverage; a single time point preliminary analysis has yielded coverage of ∼75% of the VACV WR proteome (data not shown), analogous to that obtained by Chou et al. (18). The FASP protocol used herein, however, demonstrates a rapid, single-shot and straightforward means to process samples for this type of analysis (28), although recent advances propose even higher throughput methods that circumvent the need for molecular weight cut-off spin filters (36).
This detection and relative quantitation of around half of the VACV proteome was achieved from a single SWATH-MS run per sample (with an additional IDA analysis for the generation of a spectral library, but as stated above this need not be from the same sample material). Given that data analysis occurs post-acquisition, the laborious nature of MRM design and optimization is hereby circumvented: to put this into context, to design theoretical MRMs to cover the whole VACV proteome with the constraints of peptides 6–25 amino acids in length, no missed cleavages, only doubly charged y ion precursors and four product y ions would mean an assay consisting of a staggering 12,782 transitions! Given a conventional (non-scheduled) MRM assay might allow for up to 500 transitions per run, this would mean >25 mass spectrometry runs per sample. This is neither feasible when often sample is limiting or practical, taking into account considerations such as instrument and analysis time. Further, in this study we are restricting the analysis to the virus proteome and taking the next step to include studies of the host response would explode the number of transitions beyond the point of possibility. Even if one were to pare down the analysis to only those peptides identified by a prior IDA experiment, for example the >400 unique VACV peptides observed in the present study, and assume the same MRM criteria as above, this would still require >1600 transitions and therefore need two to three runs per sample. The advantage of the data-independent approach used here is therefore that samples, be they limiting or not, can be acquired and stored and then interrogated at will any number of times for specific information. Importantly, we have further validated our data for a selection of peptides derived from 25 different VACV proteins, by demonstrating equivalent kinetic data using a traditional MRM method. This data highlights that the SWATH-MS protocol can substitute for and far exceed MRM analyses in this context.
The peptides tracked throughout infection were from proteins that spanned all of the three main temporal phases (E, I and L), as suggested by recent studies of VACV gene expression (14–16). Following cluster analysis, we observed good correlation of protein expression kinetics with the temporal phase of its transcript that is, those protein clusters with early onset of detection contain a majority of early-classified transcripts, whereas proteins clustering with delayed kinetics are predominantly the products of intermediate- and late-classified transcripts. We also note that the four clusters roughly correlate with the four states generated by the combination of expression levels of early and late (as identified by blocking replication) genes in the previous study of VACV proteomics, but offers more accurate temporal resolution (18). Our analysis also reveals several outliers within clusters: for example, the proteins HEMA_VACCW (cell-cell fusion prevention protein A56), IL1BP_VACCW (interleukin-1 binding protein) and F5_VACCW (36 kDa major membrane protein) consistently cluster in the last group (cluster 4) across both timecourses, yet these are proteins whose transcripts are classified early. However these three proteins are most abundant at the cell membrane or, in the case of IL1BP is secreted. In addition the disruption of cellular processes such as protein secretion by virus infection should be borne in mind and may provide an explanation for the slow buildup of a secreted protein like IL1BP. The VACV and other viral secretomes remain poorly characterized, but comparisons with the infected cell proteome are likely to be informative.
In examining the four clusters defined by proteomics, it was of interest to note that VACV products of genes previously defined as E1.1 and E1.2 tended to be predominately found in our clusters one and two, respectively. A separation of early genes into two classes by a cluster analysis of the VACV transcriptome was done first by Assarsson et al. by tiling microarray and then Yang et al. using deep sequencing of poly(A) RNA (14, 15). However, these descriptive data remain unsupported by the current understanding of VACV transcriptional control and more recent studies focus on the three known classes of promoter (early, intermediate and late) and the consequences of these elements being combined (16, 37). Having noted this, recently a native VACV promoter that comprises two early elements in tandem and which drives especially strong early expression was identified and this might be a candidate for an E1.1 promoter (38). This discovery and our data suggest that the original separation of VACV early genes are not an artifact of transcriptional analysis, but rather has a biological basis in unanticipated variations of promoter sequences and is an important aspect of poxvirus gene expression.
The unbiased clustering also allows for a correlation between protein clusters and their known function (supplemental Fig. S3), as has been done previously for transcriptional clustering (14, 15). These studies showed that, in general, genes with products that are involved in DNA replication and host interaction are expressed at earlier times, followed by those involved in transcription, with virion components only expressed at later times. This arrangement is supported by the biology of VACV infection and the other VACV proteomic study (18). Of note there remains several VACV genes of unknown function and knowing the kinetics of expression is of value in efforts to characterize these products of these genes. Moreover, the present approach provides a high-throughput protocol in which to assay and bank viral proteomics information. Such experiments will be important in pathogen discovery (39–41) and for emerging diseases or novel virus strains, where genomic information may be acquired rapidly (e.g. the surveillance of the 2014 Ebola virus outbreak (42)) but the generation of reagents such as antibodies has longer lead times and often lack sufficient specificity. The SWATH-MS strategy exemplified here would allow rapid profiling of pathogen infection. Recent developments in automated DIA sample analysis will only serve to expedite this process further (43).
In summary we present here a new adaptation of SWATH-MS and applied it to study the kinetics of expression of a large and challenging viral proteome. In doing so we also provide the first high-resolution kinetic profile for a poxvirus. This is a foundation that can be built on to ask many important questions about the biology of viruses and other intracellular pathogens, from the host response to infection, to the consequences of drug or immunomodulator treatment.
Supplementary Material
Footnotes
Author contributions: N.P.C., D.C.T., and A.W.P. designed research; N.P.C., S.A.S., Y.W., R.B.S., and A.W.P. performed research; N.P.C., D.A.d., and A.W.P. analyzed data; N.P.C., D.C.T., and A.W.P. wrote the paper.
* This work was supported by project grants 1023141 and 1084283 from the National Health and Medical Research Council of Australia (NH&MRC) to DCT, NPC and AWP. A.W.P. is a NH&MRC Senior Research Fellow. R.B.S. is a Swiss National Science Foundation Fellow. DV is an Australian Endeavor Research Fellow. DCT is an Australian Research Council Future Fellow.
 This article contains supplemental Figs. S1 to S4 and Tables S1 to S3.
1 The abbreviations used are:
- LC-MS/MS
- liquid chromatography/tandem MS
- VACV
- vaccinia virus
- IDA
- information-dependent mass spectrometry
- DDA
- data-dependent mass spectrometry
- DIA
- data-independent mass spectrometry
- MRM
- multiple reaction monitoring
- FASP
- filter-aided sample preparation
- hpi
- hours post infection.
REFERENCES
- 1. Chuang H. Y., Hofree M., Ideker T. (2010) A decade of systems biology. Annu. Rev. Cell Dev. Biol. 26, 721–744 [DOI] [PMC free article] [PubMed] [Google Scholar]
- 2. McGarvey P. B., Huang H., Mazumder R., Zhang J., Chen Y., Zhang C., Cammer S., Will R., Odle M., Sobral B., Moore M., Wu C. H. (2009) Systems integration of biodefense omics data for analysis of pathogen-host interactions and identification of potential targets. PLoS One 4, e7162. [DOI] [PMC free article] [PubMed] [Google Scholar]
- 3. Weekes M. P., Tomasec P., Huttlin E. L., Fielding C. A., Nusinow D., Stanton R. J., Wang E. C., Aicheler R., Murrell I., Wilkinson G. W., Lehner P. J., Gygi S. P. (2014) Quantitative temporal viromics: an approach to investigate host-pathogen interaction. Cell 157, 1460–1472 [DOI] [PMC free article] [PubMed] [Google Scholar]
- 4. Mardis E. R. (2011) A decade's perspective on DNA sequencing technology. Nature 470, 198–203 [DOI] [PubMed] [Google Scholar]
- 5. Marko-Varga G., Omenn G. S., Paik Y. K., Hancock W. S. (2013) A first step toward completion of a genome-wide characterization of the human proteome. J. Proteome Res. 12, 1–5 [DOI] [PubMed] [Google Scholar]
- 6. Bantscheff M., Schirle M., Sweetman G., Rick J., Kuster B. (2007) Quantitative mass spectrometry in proteomics: a critical review. Anal. Bioanal. Chem. 389, 1017–1031 [DOI] [PubMed] [Google Scholar]
- 7. Doerr A. (2013) Mass spectrometry-based targeted proteomics. Nat. Methods 10, 23. [DOI] [PubMed] [Google Scholar]
- 8. Lange V., Picotti P., Domon B., Aebersold R. (2008) Selected reaction monitoring for quantitative proteomics: a tutorial. Mol. Syst. Biol. 4, 222. [DOI] [PMC free article] [PubMed] [Google Scholar]
- 9. Gerber S. A., Rush J., Stemman O., Kirschner M. W., Gygi S. P. (2003) Absolute quantification of proteins and phosphoproteins from cell lysates by tandem MS. Proc. Natl. Acad. Sci. U.S.A. 100, 6940–6945 [DOI] [PMC free article] [PubMed] [Google Scholar]
- 10. Tabb D. L., Vega-Montoto L., Rudnick P. A., Variyath A. M., Ham A. J., Bunk D. M., Kilpatrick L. E., Billheimer D. D., Blackman R. K., Cardasis H. L., Carr S. A., Clauser K. R., Jaffe J. D., Kowalski K. A., Neubert T. A., Regnier F. E., Schilling B., Tegeler T. J., Wang M., Wang P., Whiteaker J. R., Zimmerman L. J., Fisher S. J., Gibson B. W., Kinsinger C. R., Mesri M., Rodriguez H., Stein S. E., Tempst P., Paulovich A. G., Liebler D. C., Spiegelman C. (2010) Repeatability and reproducibility in proteomic identifications by liquid chromatography-tandem mass spectrometry. J. Proteome Res. 9, 761–776 [DOI] [PMC free article] [PubMed] [Google Scholar]
- 11. Michalski A., Cox J., Mann M. (2011) More than 100,000 detectable peptide species elute in single shotgun proteomics runs but the majority is inaccessible to data-dependent LC-MS/MS. J. Proteome Res. 10, 1785–1793 [DOI] [PubMed] [Google Scholar]
- 12. Tate S., Larsen B., Bonner R., Gingras A. C. (2013) Label-free quantitative proteomics trends for protein-protein interactions. J. Proteomics 81, 91–101 [DOI] [PubMed] [Google Scholar]
- 13. Gillet L. C., Navarro P., Tate S., Rost H., Selevsek N., Reiter L., Bonner R., Aebersold R. (2012) Targeted data extraction of the MS/MS spectra generated by data-independent acquisition: a new concept for consistent and accurate proteome analysis. Mol. Cell. Proteomics 11, 1–17 [DOI] [PMC free article] [PubMed] [Google Scholar]
- 14. Assarsson E., Greenbaum J. A., Sundstrom M., Schaffer L., Hammond J. A., Pasquetto V., Oseroff C., Hendrickson R. C., Lefkowitz E. J., Tscharke D. C., Sidney J., Grey H. M., Head S. R., Peters B., Sette A. (2008) Kinetic analysis of a complete poxvirus transcriptome reveals an immediate-early class of genes. Proc. Natl. Acad. Sci. U.S.A. 105, 2140–2145 [DOI] [PMC free article] [PubMed] [Google Scholar]
- 15. Yang Z., Bruno D. P., Martens C. A., Porcella S. F., Moss B. (2010) Simultaneous high-resolution analysis of vaccinia virus and host cell transcriptomes by deep RNA sequencing. Proc. Natl. Acad. Sci. U.S.A. 107, 11513–11518 [DOI] [PMC free article] [PubMed] [Google Scholar]
- 16. Yang Z., Reynolds S. E., Martens C. A., Bruno D. P., Porcella S. F., Moss B. (2011) Expression profiling of the intermediate and late stages of poxvirus replication. J. Virol. 85, 9899–9908 [DOI] [PMC free article] [PubMed] [Google Scholar]
- 17. Rubins K. H., Hensley L. E., Bell G. W., Wang C., Lefkowitz E. J., Brown P. O., Relman D. A. (2008) Comparative analysis of viral gene expression programs during poxvirus infection: a transcriptional map of the vaccinia and monkeypox genomes. PLoS One 3, e2628. [DOI] [PMC free article] [PubMed] [Google Scholar]
- 18. Chou W., Ngo T., Gershon P. D. (2012) An overview of the vaccinia virus infectome: a survey of the proteins of the poxvirus-infected cell. J. Virol. 86, 1487–1499 [DOI] [PMC free article] [PubMed] [Google Scholar]
- 19. Bartel S., Doellinger J., Darsow K., Bourquain D., Buchholz R., Nitsche A., Lange H. A. (2011) Proteome analysis of vaccinia virus IHD-W-infected HEK 293 cells with 2-dimensional gel electrophoresis and MALDI-PSD-TOF MS of on solid phase support N-terminally sulfonated peptides. Virol. J. 8, 380. [DOI] [PMC free article] [PubMed] [Google Scholar]
- 20. Resch W., Hixson K. K., Moore R. J., Lipton M. S., Moss B. (2007) Protein composition of the vaccinia virus mature virion. Virology 358, 233–247 [DOI] [PubMed] [Google Scholar]
- 21. Yoder J. D., Chen T. S., Gagnier C. R., Vemulapalli S., Maier C. S., Hruby D. E. (2006) Pox proteomics: mass spectrometry analysis and identification of Vaccinia virion proteins. Virol. J. 3, 10. [DOI] [PMC free article] [PubMed] [Google Scholar]
- 22. Chung C. S., Chen C. H., Ho M. Y., Huang C. Y., Liao C. L., Chang W. (2006) Vaccinia virus proteome: identification of proteins in vaccinia virus intracellular mature virion particles. J. Virol. 80, 2127–2140 [DOI] [PMC free article] [PubMed] [Google Scholar]
- 23. Zhang L., Villa N. Y., Rahman M. M., Smallwood S., Shattuck D., Neff C., Dufford M., Lanchbury J. S., Labaer J., McFadden G. (2009) Analysis of vaccinia virus-host protein-protein interactions: validations of yeast two-hybrid screenings. J. Proteome Res. 8, 4311–4318 [DOI] [PMC free article] [PubMed] [Google Scholar]
- 24. Van Vliet K., Mohamed M. R., Zhang L., Villa N. Y., Werden S. J., Liu J., McFadden G. (2009) Poxvirus proteomics and virus-host protein interactions. Microbiol. Mol. Biol. Rev. 73, 730–749 [DOI] [PMC free article] [PubMed] [Google Scholar]
- 25. McCraith S., Holtzman T., Moss B., Fields S. (2000) Genome-wide analysis of vaccinia virus protein-protein interactions. Proc. Natl. Acad. Sci. U.S.A. 97, 4879–4884 [DOI] [PMC free article] [PubMed] [Google Scholar]
- 26. Croft N. P., Smith S. A., Wong Y. C., Tan C. T., Dudek N. L., Flesch I. E., Lin L. C., Tscharke D. C., Purcell A. W. (2013) Kinetics of antigen expression and epitope presentation during virus infection. PLoS Pathog. 9, [DOI] [PMC free article] [PubMed] [Google Scholar]
- 27. Wong Y. C., Smith S. A., Tscharke D. C. (2013) Systemic toll-like receptor ligation and selective killing of dendritic cell subsets fail to dissect priming pathways for anti-vaccinia virus CD8(+) T cells. J. Virol. 87, 11978–11986 [DOI] [PMC free article] [PubMed] [Google Scholar]
- 28. Wisniewski J. R., Zougman A., Nagaraj N., Mann M. (2009) Universal sample preparation method for proteome analysis. Nat. Methods 6, 359–362 [DOI] [PubMed] [Google Scholar]
- 29. MacLean B., Tomazela D. M., Shulman N., Chambers M., Finney G. L., Frewen B., Kern R., Tabb D. L., Liebler D. C., MacCoss M. J. (2010) Skyline: an open source document editor for creating and analyzing targeted proteomics experiments. Bioinformatics 26, 966–968 [DOI] [PMC free article] [PubMed] [Google Scholar]
- 30. Shilov I. V., Seymour S. L., Patel A. A., Loboda A., Tang W. H., Keating S. P., Hunter C. L., Nuwaysir L. M., Schaeffer D. A. (2007) The Paragon Algorithm, a next generation search engine that uses sequence temperature values and feature probabilities to identify peptides from tandem mass spectra. Mol. Cell. Proteomics 6, 1638–1655 [DOI] [PubMed] [Google Scholar]
- 31. Saeed A. I., Sharov V., White J., Li J., Liang W., Bhagabati N., Braisted J., Klapa M., Currier T., Thiagarajan M., Sturn A., Snuffin M., Rezantsev A., Popov D., Ryltsov A., Kostukovich E., Borisovsky I., Liu Z., Vinsavich A., Trush V., Quackenbush J. (2003) TM4: a free, open-source system for microarray data management and analysis. BioTechniques 34, 374–378 [DOI] [PubMed] [Google Scholar]
- 32. Soukas A., Cohen P., Socci N. D., Friedman J. M. (2000) Leptin-specific patterns of gene expression in white adipose tissue. Genes Dev. 14, 963–980 [PMC free article] [PubMed] [Google Scholar]
- 33. Schneider M. V. (2013) Defining systems biology: a brief overview of the term and field. Methods Mol. Biol. 1021, 1–11 [DOI] [PubMed] [Google Scholar]
- 34. Kitano H. (2002) Systems biology: A brief overview. Science 295, 1662–1664 [DOI] [PubMed] [Google Scholar]
- 35. Rosenberger G., Koh C. C., Guo T., Rost H. L., Kouvonen P., Collins B. C., Heusel M., Liu Y., Caron E., Vichalkovski A., Faini M., Schubert O. T., Faridi P., Ebhardt H. A., Matondo M., Lam H., Bader S. L., Campbell D. S., Deutsch E. W., Moritz R. L., Tate S., Aebersold R. (2014) A reposity of assays to quantify 10,000 human proteins by SWATH-MS. Sci. Data 1, 140031. [DOI] [PMC free article] [PubMed] [Google Scholar]
- 36. Kulak N. A., Pichler G., Paron I., Nagaraj N., Mann M. (2014) Minimal, encapsulated proteomic-sample processing applied to copy-number estimation in eukaryotic cells. Nat. Methods 11, 319–324 [DOI] [PubMed] [Google Scholar]
- 37. Yang Z., Maruri-Avidal L., Sisler J., Stuart C. A., Moss B. (2013) Cascade regulation of vaccinia virus gene expression is modulated by multistage promoters. Virology 447, 213–220 [DOI] [PMC free article] [PubMed] [Google Scholar]
- 38. Wennier S. T., Brinkmann K., Steinhausser C., Maylander N., Mnich C., Wielert U., Dirmeier U., Hausmann J., Chaplin P., Steigerwald R. (2013) A novel naturally occurring tandem promoter in modified vaccinia virus ankara drives very early gene expression and potent immune responses. PLoS One 8, e73511. [DOI] [PMC free article] [PubMed] [Google Scholar]
- 39. Ye Y., Mar E. C., Tong S., Sammons S., Fang S., Anderson L. J., Wang D. (2010) Application of proteomics methods for pathogen discovery. J. Virol. Methods 163, 87–95 [DOI] [PMC free article] [PubMed] [Google Scholar]
- 40. Denman B., Goodman S. R. (2011) Emerging and neglected tropical diseases: translational application of proteomics. Exp. Biol. Med. 236, 972–976 [DOI] [PubMed] [Google Scholar]
- 41. Zheng J., Sugrue R. J., Tang K. (2011) Mass spectrometry based proteomic studies on viruses and hosts–a review. Anal. Chim. Acta 702, 149–159 [DOI] [PMC free article] [PubMed] [Google Scholar]
- 42. Gire S. K., Goba A., Andersen K. G., Sealfon R. S., Park D. J., Kanneh L., Jalloh S., Momoh M., Fullah M., Dudas G., Wohl S., Moses L. M., Yozwiak N. L., Winnicki S., Matranga C. B., Malboeuf C. M., Qu J., Gladden A. D., Schaffner S. F., Yang X., Jiang P. P., Nekoui M., Colubri A., Coomber M. R., Fonnie M., Moigboi A., Gbakie M., Kamara F. K., Tucker V., Konuwa E., Saffa S., Sellu J., Jalloh A. A., Kovoma A., Koninga J., Mustapha I., Kargbo K., Foday M., Yillah M., Kanneh F., Robert W., Massally J. L., Chapman S. B., Bochicchio J., Murphy C., Nusbaum C., Young S., Birren B. W., Grant D. S., Scheiffelin J. S., Lander E. S., Happi C., Gevao S. M., Gnirke A., Rambaut A., Garry R. F., Khan S. H., Sabeti P. C. (2014) Genomic surveillance elucidates Ebola virus origin and transmission during the 2014 outbreak. Science 345, 1369–1372 [DOI] [PMC free article] [PubMed] [Google Scholar]
- 43. Rost H. L., Rosenberger G., Navarro P., Gillet L., Miladinovic S. M., Schubert O. T., Wolski W., Collins B. C., Malmstrom J., Malmstrom L., Aebersold R. (2014) OpenSWATH enables automated, targeted analysis of data-independent acquisition MS data. Nat. Biotechnol. 32, 219–223 [DOI] [PubMed] [Google Scholar]
Associated Data
This section collects any data citations, data availability statements, or supplementary materials included in this article.