

Abstract
Proteomics by mass spectrometry technology is widely used for identifying and quantifying peptides and proteins. The breadth and sensitivity of peptide detection have been advanced by the advent of data-independent acquisition mass spectrometry. Analysis of such data, however, is challenging due to the complexity of fragment ion spectra that have contributions from multiple co-eluting precursor ions. We present SWATHProphet software that identifies and quantifies peptide fragment ion traces in data-independent acquisition data, provides accurate probabilities to ensure results are correct, and automatically detects and removes contributions to quantitation originating from interfering precursor ions. Integration in the widely used open source Trans-Proteomic Pipeline facilitates subsequent analyses such as combining results of multiple data sets together for improved discrimination using iProphet and inferring sample proteins using ProteinProphet. This novel development should greatly help make data-independent acquisition mass spectrometry accessible to large numbers of users.
Mass spectrometry is widely used to identify and quantify protein samples. Proteins are typically cleaved into peptides (either enzymatically or chemically), separated by at least one-dimensional fractionation (e.g. liquid chromatography), and collisionally fragmented, and fragment ions are detected by their unique m/z values in a mass spectrometer (1). Data-dependent acquisition (shotgun) selects individual precursor ions for fragmentation and is limited in its ability to consistently detect large numbers of peptides, particularly those of lower intensity, in samples (2). In contrast, selective reaction monitoring (SRM)1 is a targeted approach in which known precursor and a set of fragment ions are monitored over time upon selection by mass filters in a triple quadrupole instrument. The selected fragment ions in conjunction with the parent ion constitute a highly sensitive molecular assay specific for a precursor ion of interest. Although this strategy has been successfully applied for a large number of biological studies, it is limited by low throughput.
An alternative approach, data-independent acquisition (DIA), aims to overcome the low throughput limitation of SRM while maintaining full quantitative analyses. It selects all ions within a sliding m/z precursor window for fragmentation (3–7) and effectively creates a digital record of the complete peptide contents of the sample. Its increased sensitivity, however, is limited by the challenge of interpreting fragment ion spectra generated from multiple precursors. This can be done by spectral deconvolution followed by database search (1, 8) or by query of the data with preselected fragment ions in a spectral library in a manner similar to targeted approaches such as SRM (3).
Software packages currently available for targeted analysis of DIA MS data with precursor ion assays contained within a spectral library include PeakViewTM from (Sciex, Framingham, MA), for data generated on a TripleTOF mass spectrometer. The proprietary Spectronaut (Biognosys AG, Zurich, Switzerland) and open source OpenSWATH software (9) are adaptations of the mProphet software suite (10) originally designed for SRM data, and the widely used SRM software Skyline (11) now also incorporates mProphet software to handle DIA MS data. None of these available programs, however, provide validation of results with computed probabilities or detection and removal of fragment ion interferences that give rise to inaccurate quantitation and decreased sensitivity.
Here we present SWATHProphet software that performs these functions in conjunction with a high quality spectral library. SWATHProphet validates results with accurate probabilities of being correct. These probabilities serve as input to downstream analyses in the highly developed Trans-Proteomic Pipeline (TPP) (12), such as combining together results of multiple runs for improved discrimination with iProphet (13) and inferring sample proteins with ProteinProphet (14). In addition, SWATHProphet uses these probabilities to help cope with complex spectra by automatically detecting fragment ion interferences and removing them in silico to yield accurate quantitation and adjusted probabilities.
EXPERIMENT PROCEDURES
Sample Preparation
Urine from a healthy human donor was desalted using a HiPrep 26/10 column (GE Healthcare) and concentrated by Savant centrifugal lyophilization. The sample was resolubilized in water, and the protein amount was then determined by the BCA assay (Thermo Fisher Scientific). The sample was diluted to 1 mg/ml, reduced with 10 mm DTT (Sigma) for 25 min at 56 °C, alkylated with 14 mm iodoacetamide (Sigma) for 30 min in the dark at room temperature, and digested overnight with a 1:100 ratio of trypsin (Promega) at 37 °C. Digestion was stopped by lowering the pH below 2, and the peptides were purified using solid phase extraction (Waters). 1055 individually synthesized, heavy C-terminally labeled crude peptides representing Mycobacterium tuberculosis proteins were pooled and sequentially diluted 1:1 with 0.1% (v/v) formic acid or 1 mg/ml digested urine to a final dilution of 1:256.
Chromatography
The peptide samples were analyzed using the Eksigent ekspertTM nano-LC 425 system combined with the cHiPLC® system in Trap-Elute mode. The sample was first loaded on the cHiPLC trap (200 × 500 μm, ChromXP C18-CL, 3 μm, 120 Å) and washed for 10 min at 2 μl/min. Then a linear elution gradient of 3–35% (v/v) acetonitrile (0.1% (v/v) formic acid) in 120 min was used on a nano-cHiPLC column (75 μm × 15 cm, ChromXP C18-CL, 3 μm, 120 Å).
Mass Spectrometry
Peptides eluting from the cHiPLC column were analyzed using the Nanospray-III® source on a TripleTOF® 5600+ system (Sciex, Framingham, MA). To generate spectral libraries for SWATH analysis, the data were acquired in data-dependent mode. The mass spectrometric parameters were collected in the range of 100–2000 Th for 250 ms for MS1 spectra. Then the 20 most intense precursors in the mass range of 400–1250 Th with a charge state between 2+ and 4+ were selected for fragmentation with a rolling collision energy and a collision energy spread of ±15V, and the resultant MS/MS fragment spectra were collected in the range of 100–2000 Th for 200 ms.
For DIA acquisition, an MS/MSALL with SWATHTM acquisition method was used where Q1 was scanned from 350 to 1200 Th, and MS/MS was acquired from 300 to 1500 Th. The Q1 transmission window was 27.56 Th wide (with a 1-Th overlap with the previous window), and 32 steps were used with a 100-ms MS/MS accumulation time on each for a total cycle time of 3.2 s. At the beginning of each cycle, a survey scan from 200 to 1500 Th was acquired with an accumulation time of 50 ms.
Spectral Library and DIA MS Assay Construction
Profile mode .wiff files from data-dependent acquisition were centroided and converted to .mzML format using msconvert of ProteoWizard version 3.0.4806 (15) selecting the manufacturer's peak picking algorithm for all spectra as the only filter (see supplemental information and Fig. S1). The raw data were searched with X!Tandem (16) against either the sequences of synthetic peptides or the UniProt human varsplit database of March 2012 supplemented with common contaminant proteins and decoy sequences. Carbamidomethylation of cysteines was set as a fixed modification, and oxidation on methionines, a heavy lysine (+8.014199 Da), and arginine (+10.008269 Da) were set as variable modifications. Up to two missed cleavages were allowed. The precursor and fragment ion accuracy was set to 300 and 30 ppm, respectively. Search results were statistically analyzed with TPP v4.6 OCCUPY Revision 3, Build 201307251325 (Linux) using PeptideProphet (17) and iProphet.
A raw spectral library was built based on the identifications and filtered for a false discovery rate (FDR) of 1% using SpectraST (18). A consensus spectrum was constructed from all the redundant spectra acquired for each precursor. Targeted DIA MS assays were constructed based on all the b and y ions annotated in the consensus spectrum with a charge state of 1 or 2. The retention times of all precursors were normalized using the median of the spectra with the highest number of assigned fragment ions.
RESULTS
SWATHProphet software was designed to analyze DIA MS data with precursor ion assays of a spectral library. A high quality spectral library contains a signature set of fragment ions for each precursor with expected relative peak intensities, including relative isotopic peak intensities, and retention time. Traces for library assay fragment ions are extracted within the specified mass tolerance from MS2 scans of the appropriate precursor window, including several individual isotope peaks that are combined into a correlation score trace of observed versus predicted relative intensities. Also extracted are traces for the parent ion and maximum intensity m/z values. Peak groups or groups of co-eluting peaks in the extracted ion traces are identified and assigned several scores as described (10). These include the intensity correlation with library (comparison between observed and predicted fragment ion peak intensities), co-elution (uniformity of fragment ion elution times), shape (uniformity of fragment ion peak shapes), and retention time difference (between observed and expected normalized times). Scores added to SWATHProphet to take advantage of DIA MS data include the uniformity of peak shape and elution time between parent and fragment ions, correlation of observed and expected isotope peak intensities, and difference between observed and expected fragment m/z values (see supplemental information).
Data analysis proceeds in two phases. In the first, spectral library-normalized retention time values are converted to retention times in the current run by linear regression between the library values and the observed retention times of a set of designated “normalization peptides” that are present in the sample and analyzed on their own (19). In the second phase, the traces of all precursor assays in the library are extracted within a specified time tolerance centered on their expected retention time in the current run. Results are sets of peak groups with accompanying retention times and score values corresponding to each library assay. Analysis is performed independently in each precursor window.
Automated Validation of Identified Peak Groups
Peak groups that are correctly assigned to their library assay are identified based on their score values. Discriminant function analysis is used to combine together 13 scores in a linear combination into a single discriminant score optimized for each run as described previously (10). This is done with the help of known incorrect results generated for decoy library assays corresponding to precursors known not to be present in the sample. These are created by randomizing or reversing target assay peptide sequences followed by a single amino acid substitution that preserves the precursor window of the target. This assures that decoys have a different precursor m/z from the target because that value is the basis for several peak group scores. Decoys were shown to behave similarly to non-decoy incorrect results with respect to their peak group score values (see supplemental information).
Probabilities that peak groups are correct identifications are computed based on their discriminant score value. The discriminant score distribution of the data set is partitioned into contributions from correct and incorrect results by expectation-maximization (20) using the decoys to define the distribution among incorrect results. The learned distributions are then used to compute probabilities that a result with a particular discriminant score is correctly assigned to its library precursor. These probabilities can be used to sort and filter the data to achieve a desired estimated FDR. Only the top ranking peak group of each library assay (that with the highest discriminant score) is subjected to validation.
The accuracy of SWATHProphet-computed probabilities was assessed using DIA MS data generated from a control data set of 1055 M. tuberculosis synthetic peptides spiked into either neat or human urine backgrounds at dilutions ranging from 1:1 to 1:256 (three replicates each). SWATHProphet was used to analyze these data with an assay library containing the spiked-in peptides (1316 precursor assays), 1001 human urine peptides (1092 precursor assays), 2556 assays of M. tuberculosis synthetic peptides not present in the sample (“target false positives”), and decoys (see supplemental information). Using the target false positive peak groups as known incorrect results, the computed probabilities were determined to be accurate for the control data set samples (Fig. 1A). Good discrimination of the computed probabilities was demonstrated by 100% of the objectively identified true positive results in the 1:1 human urine background samples (see supplemental information) being identified at 1% estimated FDR.
Fig. 1.
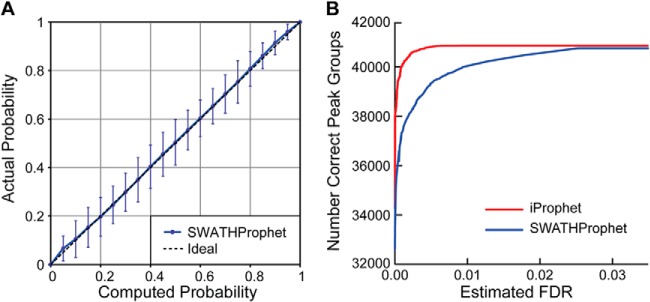
Accuracy and discrimination of computed probabilities. A, computed probabilities are plotted versus actual values averaged over dilution series samples. Actual numbers of correct results are based on counts of target false positives. B, increased discrimination of probabilities and numbers of identifications after iProphet analysis of combined data. Error bars represent S.E.
Combining SWATHProphet Results of Multiple Runs and Protein Inference
Accurate SWATHProphet probabilities can serve as input to downstream analyses in the highly developed TPP that apply both to DIA and shotgun MS results (see supplemental information and Fig. S4). The iProphet software component in the TPP combines shotgun search results together from multiple search engines, replicates, and samples. It can increase the number of overall identifications by modeling information available in the pooled data and adjusting probabilities accordingly. iProphet code in the TPP was modified to combine together SWATHProphet DIA MS results for multiple replicates and samples using applicable models such as the numbers of replicates with the same result, the numbers of identified peptides with alternative modifications, and the numbers of other identified peptides corresponding to the same protein. In addition, it includes two new models specific for DIA results: normalized retention time difference between results for alternative precursor charges of the same peptide within a run and alternative precursor windows of the same library assay within a run. The latter applies to assays with precursor m/z values falling in the overlap range of two adjacent precursor windows. These two models rely on the expectation that correct peak groups corresponding to a single peptide regardless of charge or precursor window should have similar retention times.
iProphet was run on the entire combined dilution series in both the neat and human urine backgrounds. Fig. 1B shows that the discrimination based on the iProphet-adjusted probabilities was improved, resulting in greater numbers of identified precursors at a fixed FDR. For example, 14% more identifications (4612 added to 33,374) were obtained at 0% estimated FDR, including an additional 1% unique peptides (22 added to 2163). Noteworthy is how the identifications of dilute synthetic peptides in human urine background samples are helped, their probabilities boosted by iProphet alignment with results of samples in which they are more concentrated (Table S1). This demonstrates how combining together SWATHProphet results of multiple replicates and samples can be leveraged to increase the number of identifications.
ProteinProphet infers protein contents in a sample based on the probabilities of identified peptides being correct. Although originally designed for shotgun data, it can be applied to SWATHProphet results in a straightforward manner. It will potentially be most helpful in the case of borderline identifications of library assays and for use with whole proteome libraries that contain multiple peptides for each protein. The iProphet results for the control data set dilution series were analyzed by ProteinProphet. At 0% estimated FDR, 278 of the 283 human urine proteins represented in the spectral library and 290 of the 294 M. tuberculosis proteins (corresponding to the spiked-in peptides) were identified.
Detection and Removal of Fragment Ion Interferences
A challenge to DIA MS data analysis is that combined fragmentation of many precursors can hamper the ability to detect and quantify any single precursor. This happens when two co-eluting sample precursors in the same precursor window share one or more of their library assay fragment ion m/z values within the mass tolerance of the instrument. Such fragment ion interferences can result in excess peak area quantitation contributed by the interfering precursor, lower intensity correlation with library, peak shape, and co-elution scores as well as computed probability. The number of interferences can be reduced by use of experimental designs with narrow precursor windows (7) or by selection of library assay fragment ions predicted to be unique to their precursor ion within a range of retention time using programs such as SRMCollider (21). Interferences are nevertheless inevitable because the chromatography and peptides in the sample, including semitryptic and modified peptides, can vary from run to run. In addition, it may not always be practical to use only fragment ions predicted to be interference-free if they are of low intensity.
SWATHProphet detects fragment ion interferences so they can be removed either by reanalysis after their substitution for non-interfering ions in the library or in silico by adjustment of peak group quantitation, scores, and computed probabilities. The latter is an important step toward enabling quantitative comparisons among diverse samples using standard library assays that may not be interference-free in all. SWATHProphet automatically detects fragment ion interferences in two different ways: intralibrary detection between two identified co-eluting library precursors and score-based detection from any sample precursors, even those not in the spectral library, based on peak group scores.
The intralibrary strategy detects interferences between identified peak groups corresponding to two different library precursors (Fig. 2A). Each identified peak group in a data set is compared against all others in the same precursor window that overlap in retention time to check whether they share any library assay fragment ion m/z values within the specified mass tolerance. If so, each fragment peak area in common to both peak groups is apportioned based on the observed peak group areas and library-predicted fragment ion intensities. Finally, the strength of the interference is computed as the sum of contributions to the observed XIC of a peak group originating from the interfering peak group (see supplemental information). Because the interference relationship is by nature bidirectional, both peak groups will be assigned their own interference strength. In general, it is useful to require that interfering peak groups have a high probability of corresponding to their library precursor to ensure that the detected interference is real. Intralibrary-detected interferences cannot originate from precursor ions not present in the spectral library or from fragment ions of library peptides not themselves included in the library assay.
Fig. 2.
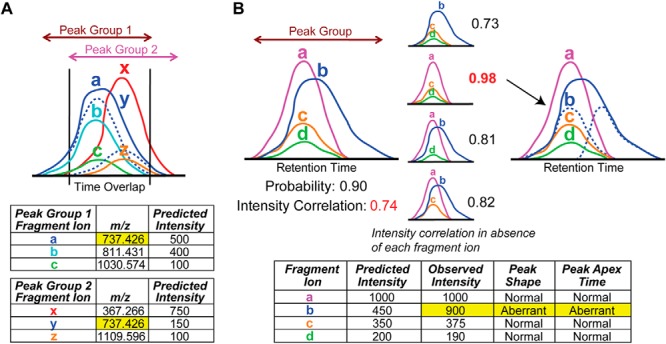
Detection of fragment ion interferences. A, intralibrary detection of fragment ion interferences between two peak groups corresponding to co-eluting precursors that have isobaric library assay fragment ions (a and y). The shared fragment ion trace is apportioned to the two peak groups according to their predicted intensities. B, score-based detection of fragment ion interferences for peak groups with high computed probabilities but low correlation of observed to library-predicted fragment ion intensities. The intensity correlation score is greatly increased upon exclusion of fragment ion b that exhibits aberrant peak shape and elution time with respect to the other ions. A share of the fragment ion trace is apportioned to the peak group according to its predicted intensity.
The score-based strategy, unlike the intralibrary strategy, can detect interferences arising from precursors or fragment ions not present in the spectral library. It uses three peak group scores that often indicate the presence of an interfering fragment ion: intensity correlation with library, co-elution, and shape (Fig. 2B). Peak groups with high probability but low intensity correlation with library score are examined for possible interference resulting in the low score. The score is recomputed in the absence of each fragment ion in turn or pairs of fragment ions if necessary. If the score is sufficiently increased in the absence of fragment ion(s) with poor co-elution, peak shape, or background intensity with respect to the others, then that ion(s) is inferred to have interference from another unspecified precursor ion in the sample. The strength of a detected interference, the sum of contributions to the observed XIC of the peak group that originate from the interfering precursor ion(s), is estimated from the library-predicted fragment ion intensities (see supplemental information). Alternatively, if the intensity correlation score is substantially increased in the absence of fragment ion(s) with normal co-elution, peak shape, and background levels or if the computed strength is below zero (indicating that the observed fragment ion intensity is below rather than above that expected by the library), that ion(s) is flagged as having intensities differing from those in the library without evidence of interference. Such cases can be used to correct the library-predicted intensities for future analyses if warranted.
In the control human urine background sample data, 5 and 24% of the 8423 high confidence peak groups had intralibrary and score-based strategy-detected interferences, respectively, whereas 2% of the high confidence peak groups had both types (Fig. 3A). Many of the intralibrary-detected interferences were of low strength and hence could not be detected on the basis of a significant increase in the intensity correlation score. The great majority of score-based strategy-detected interferences were not detected by the intralibrary strategy and hence are inferred to be due to peptides or fragment ions not present in the spectral library. This number would likely be reduced by use of a more comprehensive library. 3.7% of high confidence peak groups (312) had detected interferences with strengths of 0.4 or greater, indicating observed XIC values inflated by 40% or more due to the interfering precursor ion(s). Manual examination of fragment ion traces from 750 high confidence sample peak groups in the human urine background (250 in each control data set 1:1, 1:4, and 1:16 sample dilutions) suggests that ∼80% of all interferences were detected by either the intralibrary or score-based strategy.
Fig. 3.
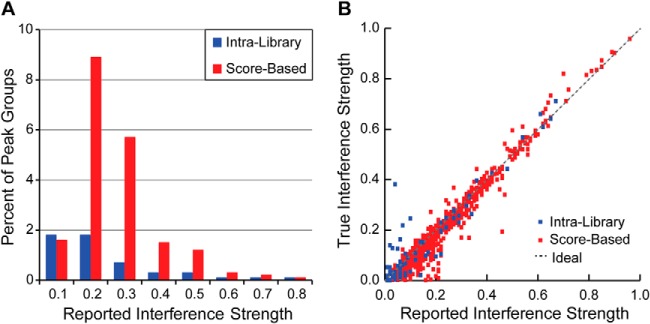
Strengths of detected interferences. A, frequencies of intralibrary and score-based strategy-detected fragment ion interferences of the indicated strengths (fraction of observed XIC) in human urine background sample peak groups filtered at an estimated 1% FDR. B, accuracy of reported strengths of interferences of M. tuberculosis precursor ions by human urine peptides in the control data set samples. Reported interference strengths are plotted against their true values as computed based on the XIC of corresponding peak groups lacking the interference in the neat background samples.
The true XIC of a peak group with detected fragment ion interference should be equal to its observed inflated value multiplied by (1 − interference strength). To validate that this is true and hence that the reported interference strengths are indeed accurate, it is necessary to independently determine the true XIC for synthetic peptide peak groups with detected interference. This is achieved by examining peak groups in the human urine background samples corresponding to M. tuberculosis synthetic peptides that have detected interference from a human urine peptide. Because the corresponding M. tuberculosis synthetic peptide peak groups in the neat background samples do not have interference from urine peptides, their true XIC values are equal to their observed XIC and can be used to infer the true XIC of the peak groups in the urine background samples. This is done by normalizing to the XIC value obtained by excluding the fragment ion(s) with interference, XIC−inf. The true interference strength of an M. tuberculosis synthetic peptide peak group in a human urine background sample, the fraction of its XIC contributed by the interfering fragment ions, is then given by Equation 1.
 |
where XICU and XICN are the XIC of the corresponding peak groups in the human urine and neat background samples, respectively. M. tuberculosis synthetic peptide peak groups with detected intralibrary interference from a human urine peptide were recognized in the urine background samples, filtered for an estimated 1% FDR, based on a reported interfering human urine peptide with a probability of 0.9 or greater of being a correct identification. Because the interfering peptide is unknown in the case of score-based interferences, those from a human urine peptide were inferred on the basis of that interference not being detected in the corresponding M. tuberculosis synthetic peptide peak group in the neat background sample. In all cases, corresponding M. tuberculosis synthetic peptide peak groups in the human urine and neat background samples were identified based on their normalized retention times falling within 0.5 min of each other. Fig. 3B shows that good agreement was observed between the true and reported interference strengths over a wide range of values for both intralibrary and score-based strategy-detected interferences. The reported interference strengths are therefore accurate measures of the fraction of observed XIC contributed by interfering precursor ion(s).
Once interferences are detected, they can be removed in silico by adjustment to quantitation and probability values. Quantitation can be adjusted using the reported interference strength, specifically by multiplying the observed XIC by (1 − interference strength). Accurate quantitation is thereby achieved even for precursor ions that encounter interfering fragment ions in a particular sample. The interference contribution to each shared fragment ion peak area can furthermore be removed, and the intensity correlation with library score can be recomputed. Because this score contributes to the discriminant score with known weight, the increase upon removal of interference can be translated into an increase in discriminant score and, using the peak group validation model, to an increase in probability. Fig. 4 shows examples of M. tuberculosis synthetic peptide peak groups in the human urine background samples with detected intralibrary and score-based interferences from urine peptides. In silico removal of the interferences confers adjusted XIC, intensity correlation score, and probability values that more closely match those of corresponding peak groups lacking the interference in the neat background samples. For example, the true XIC of the MYGTAPIPR* 2+ peak group with a score-based strategy-detected interference of strength 0.49, its observed inflated XIC multiplied by (1 − 0.49), can be compared directly with quantitation values in other samples, including neat background samples that have no interference. Its probability was furthermore increased from 0.82 to 1 following removal of the interference, enabling its identification at a lower estimated FDR.
Fig. 4.

In silico removal of detected fragment ion interferences. Shown on the left are peak groups corresponding to 2+ peptide GGIQFADTR* in the 1:4 dilution sample in the urine background with intralibrary-detected y4_1 fragment ion interference from the y4_1 fragment ion of 2+ human peptide VVVDVSHEDPEVK (see arrow) and in the neat background with no interference. Shown on the right are peak groups corresponding to 2+ peptide MYGTAPIPR* in the urine background with score-based strategy-detected b4_1 fragment ion interference (see arrow) and in the neat background with no interference. In silico removal of the detected interferences involves adjusting the peak group XIC to remove the contribution from the interfering precursor ion(s), the reported interference strength, and the probability value to reflect the increase in intensity correlation score (red font).
DISCUSSION
We have demonstrated that SWATHProphet analyzes DIA MS data in an automated manner, providing validation that identified peak groups correspond to their library precursor assays with accurate computed probabilities. SWATHProphet results and their computed probabilities are converted to a standard format pepXML file where they can leverage the strength of the widely used open source analysis components of the TPP (12). The iProphet software component can be used to combine together results of multiple replicates and samples with improved discrimination, and ProteinProphet can be used to infer sample proteins with computed probabilities. These important steps are currently not possible with other targeted analysis software for DIA data. Conversion of SWATHProphet results to pepXML and protXML standard data formats will generally facilitate subsequent analysis of targeted DIA MS data using a wide variety of other tools being made available.
The improved discrimination and hence numbers of identifications obtained upon combining together multiple replicates and sample runs with iProphet will have great benefit for obtaining quantitative results of peptides across multiple conditions. In such cases, samples with strong identifications will facilitate identifications in other samples in which the peptides are less abundant, thereby enabling accurate quantitation values in all samples. ProteinProphet results will be used in the future to combine quantitation of peptides to the protein level for comparison among samples and identification of outlier peptides.
SWATHProphet detects and reports fragment ion interferences, enabling one to modify the spectral library to avoid the interferences upon reanalysis. Most importantly, the software automatically removes the detected interferences in silico, conferring accurate quantitation, scores, and probabilities. This robust analysis facilitates the use of standard library assays to compare peptide quantitation in a wide variety of samples, including those that by chance encounter interfering fragment ions. Adjustment to probability values upon removal of the detected interference enables improved sensitivity of detecting peptides.
Using this software one can compile statistics on the frequency and strengths of detected interferences. This information can be used to evaluate different spectral libraries and experimental parameters for their effects on the numbers of fragment ion interferences encountered. We report here for the first time the frequency of detected fragment ion interferences in a DIA MS data set. In the future, it will be interesting to compare that with the frequencies observed in analyses of more complex samples.
The spectral library plays a critical role in targeted analysis of DIA MS data. Accurate predicted fragment ion peak intensities and normalized retention times aid in the identification and validation of peak groups assigned to precursor ions as well as to the detection and removal of fragment ion interferences. Methods to derive accurate predicted fragment ion peak intensities for DIA MS spectral library assays are being developed and released to the public for broad dissemination. Because SWATHProphet analysis documents discrepancies between library and observed peak intensities, it can generally be used to revise library values, if warranted, based on properties of high confidence results. The ability to provide SWATHProphet as part of the existing and widely used Trans-Proteomic Pipeline enables its rapid integration and broad dissemination to users worldwide.
Supplementary Material
Acknowledgments
Software Availability and License—SWATHProphet is available at tools.proteomecenter.org/software/SWATHProphet/and is released under a dual license. For academic, non-commercial use of the software, the GNU General Public License (GPLv3) open source license may be used. Other users who wish to use SWATHProphet in ways that are not compatible with open source licenses can contact the authors at the Institute for Systems Biology for licensing.
Acknowledgments
We thank Joseph Slagel and Dr. Michael R. Hoopmann for advice and technical assistance and members of the Moritz laboratory for helpful discussions. We thank Dr. Ulrike Kusebauch and David S. Campbell for synthetic peptide resources, Dr. Aaron Hudson, Dr. Christie Hunter and Mark Cafazzo (SCIEX) for access to a 5600+ TripleTOF MS instrument.
Footnotes
Author contributions: A.K., S.L.B., L.H., and R.L.M. designed research; A.K., S.L.B., D.S., and R.L.M. performed research; A.K. and D.S. contributed new reagents or analytic tools; A.K., S.L.B., D.S., and R.L.M. analyzed data; A.K., S.L.B., L.H., and R.L.M. wrote the paper.
* This work was supported, in whole or in part, by National Institutes of Health Grant RC2 HG005805 from the National Human Genome Research Institute through the American Recovery and Reinvestment Act and Grants 2P50 GM076547 (Center for Systems Biology) and GM087221 from the NIGMS. This work was also supported by National Science Foundation Major Research Instrumentation Grant 0923536 and Bill and Melinda Gates Foundation Grants OPP1039684 and OPP1115430.
 This article contains supplemental information, Figs. S1–S5, and Table S1.
1 The abbreviations used are:
- SRM
- selected reaction monitoring
- XIC
- extracted ion chromatogram
- DIA
- data-independent acquisition
- TPP
- Trans-Proteomic Pipeline
- Th
- thomson
- FDR
- false discovery rate.
REFERENCES
- 1. Aebersold R., Mann M. (2003) Mass spectrometry-based proteomics. Nature 422, 198–207 [DOI] [PubMed] [Google Scholar]
- 2. Michalski A., Cox J., Mann M. (2011) More than 100,000 detectable peptide species elute in single shotgun proteomics runs but the majority is inaccessible to data-dependent LC-MS/MS. J. Proteome Res. 10, 1785–1793 [DOI] [PubMed] [Google Scholar]
- 3. Gillet L. C., Navarro P., Tate S., Röst H., Selevsek N., Reiter L., Bonner R., Aebersold R. (2012) Targeted data extraction of the MS/MS spectra generated by data-independent acquisition: a new concept for consistent and accurate proteome analysis. Mol. Cell. Proteomics 11, O111.016717. [DOI] [PMC free article] [PubMed] [Google Scholar]
- 4. Panchaud A., Scherl A., Shaffer S. A., von Haller P. D., Kulasekara H. D., Miller S. I., Goodlett D. R. (2009) Precursor acquisition independent from ion count: how to dive deeper into the proteomics ocean. Anal. Chem. 81, 6481–6488 [DOI] [PMC free article] [PubMed] [Google Scholar]
- 5. Plumb R. S., Johnson K. A., Rainville P., Smith B. W., Wilson I. D., Castro-Perez J. M., Nicholson J. K. (2006) UPLC/MS(E); a new approach for generating molecular fragment information for biomarker structure elucidation. RCM 20, 1989–1994 [DOI] [PubMed] [Google Scholar]
- 6. Venable J. D., Dong M. Q., Wohlschlegel J., Dillin A., Yates J. R. (2004) Automated approach for quantitative analysis of complex peptide mixtures from tandem mass spectra. Nat. Methods 1, 39–45 [DOI] [PubMed] [Google Scholar]
- 7. Egertson J. D., Kuehn A., Merrihew G. E., Bateman N. W., MacLean B. X., Ting Y. S., Canterbury J. D., Marsh D. M., Kellmann M., Zabrouskov V., Wu C. C., MacCoss M. J. (2013) Multiplexed MS/MS for improved data-independent acquisition. Nat. Methods 10, 744–746 [DOI] [PMC free article] [PubMed] [Google Scholar]
- 8. Chapman J. D., Goodlett D. R., Masselon C. D. (2014) Multiplexed and data-independent tandem mass spectrometry for global proteome profiling. Mass Spectrom. Rev. 33, 452–470 [DOI] [PubMed] [Google Scholar]
- 9. Röst H. L., Rosenberger G., Navarro P., Gillet L., Miladinović S. M., Schubert O. T., Wolski W., Collins B. C., Malmström J., Malmström L., Aebersold R. (2014) OpenSWATH enables automated, targeted analysis of data-independent acquisition MS data. Nat. Biotechnol. 32, 219–223 [DOI] [PubMed] [Google Scholar]
- 10. Reiter L., Rinner O., Picotti P., Hüttenhain R., Beck M., Brusniak M. Y., Hengartner M. O., Aebersold R. (2011) mProphet: automated data processing and statistical validation for large-scale SRM experiments. Nat. Methods 8, 430–435 [DOI] [PubMed] [Google Scholar]
- 11. MacLean B., Tomazela D. M., Shulman N., Chambers M., Finney G. L., Frewen B., Kern R., Tabb D. L., Liebler D. C., MacCoss M. J. (2010) Skyline: an open source document editor for creating and analyzing targeted proteomics experiments. Bioinformatics 26, 966–968 [DOI] [PMC free article] [PubMed] [Google Scholar]
- 12. Keller A., Eng J., Zhang N., Li X. J., Aebersold R. (2005) A uniform proteomics MS/MS analysis platform utilizing open XML file formats. Mol. Syst. Biol. 1, 2005.0017. [DOI] [PMC free article] [PubMed] [Google Scholar]
- 13. Shteynberg D., Deutsch E. W., Lam H., Eng J. K., Sun Z., Tasman N., Mendoza L., Moritz R. L., Aebersold R., Nesvizhskii A. I. (2011) iProphet: multi-level integrative analysis of shotgun proteomic data improves peptide and protein identification rates and error estimates. Mol. Cell. Proteomics 10, M111.007690. [DOI] [PMC free article] [PubMed] [Google Scholar]
- 14. Nesvizhskii A. I., Keller A., Kolker E., Aebersold R. (2003) A statistical model for identifying proteins by tandem mass spectrometry. Anal. Chem. 75, 4646–4658 [DOI] [PubMed] [Google Scholar]
- 15. Chambers M. C., Maclean B., Burke R., Amodei D., Ruderman D. L., Neumann S., Gatto L., Fischer B., Pratt B., Egertson J., Hoff K., Kessner D., Tasman N., Shulman N., Frewen B., Baker T. A., Brusniak M. Y., Paulse C., Creasy D., Flashner L., Kani K., Moulding C., Seymour S. L., Nuwaysir L. M., Lefebvre B., Kuhlmann F., Roark J., Rainer P., Detlev S., Hemenway T., Huhmer A., Langridge J., Connolly B., Chadick T., Holly K., Eckels J., Deutsch E. W., Moritz R. L., Katz J. E., Agus D. B., MacCoss M., Tabb D. L., Mallick P. (2012) A cross-platform toolkit for mass spectrometry and proteomics. Nat. Biotechnol. 30, 918–920 [DOI] [PMC free article] [PubMed] [Google Scholar]
- 16. Craig R., Beavis R. C. (2004) TANDEM: matching proteins with tandem mass spectra. Bioinformatics 20, 1466–1467 [DOI] [PubMed] [Google Scholar]
- 17. Keller A., Nesvizhskii A. I., Kolker E., Aebersold R. (2002) Empirical statistical model to estimate the accuracy of peptide identifications made by MS/MS and database search. Anal. Chem. 74, 5383–5392 [DOI] [PubMed] [Google Scholar]
- 18. Lam H., Deutsch E. W., Eddes J. S., Eng J. K., Stein S. E., Aebersold R. (2008) Building consensus spectral libraries for peptide identification in proteomics. Nat. Methods 5, 873–875 [DOI] [PMC free article] [PubMed] [Google Scholar]
- 19. Escher C., Reiter L., MacLean B., Ossola R., Herzog F., Chilton J., MacCoss M. J., Rinner O. (2012) Using iRT, a normalized retention time for more targeted measurement of peptides. Proteomics 12, 1111–1121 [DOI] [PMC free article] [PubMed] [Google Scholar]
- 20. Dempster A., Laird N., Rubin D. E. (1977) Maximum likelihood from incomplete data via the EM algorithm. J. R. Stat. Soc. Ser. B 39, 1–38 [Google Scholar]
- 21. Röst H., Malmström L., Aebersold R. (2012) A computational tool to detect and avoid redundancy in selected reaction monitoring. Mol. Cell. Proteomics 11, 540–549 [DOI] [PMC free article] [PubMed] [Google Scholar]
Associated Data
This section collects any data citations, data availability statements, or supplementary materials included in this article.